#ETHEREUM – Macro Breakout Setup#ETHEREUM – Macro Breakout Setup 🚀
▶️ 6th time in history testing $4K macro resistance.
▶️ A clean weekly close above could ignite HTF expansion to $8K → $10K → $15K.
6 rejections in 4 years… one breakout can change it all.
NFA & DYOR
ETHUSDT.3S trade ideas

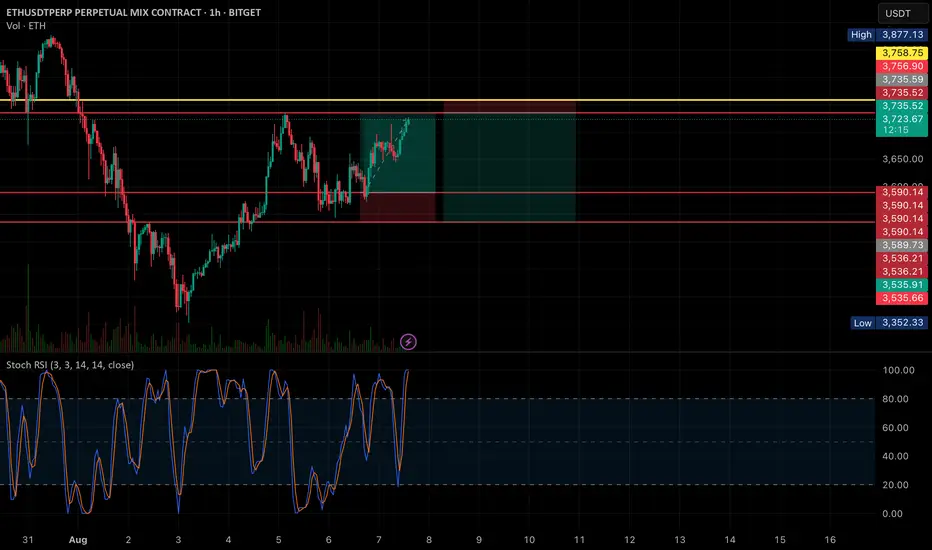
[SeoVereign] ETHEREUM BEARISH Outlook – August 10, 2025In this idea, I would like to present a bearish perspective on Ethereum.
This perspective was derived based on the Elliott Wave Theory.
Until this pattern is confirmed, I have been continuously tracking the Elliott Waves and adding reasons for the bearish scenario one by one.
As a result, I have concluded that the next major move is likely to be downward, and while searching for a specific entry point, I detected the recent trendline break.
If this wave is clearly confirmed, I believe there is a high possibility of a decline to around the average take-profit level of 3763 USDT without much difficulty, and therefore, I am considering entering a short position.
All the details have been drawn on the chart, so please refer to it.
Thank you very much for reading, and as time goes by and the chart becomes clearer, I will continue to update this idea accordingly.
Thank you.

Eth tp hit and now going for short with low slLast chart tp hitted perfectly
NOW looking for shorts again and this is nothing those are catch the full runnnn
Must share this more coming
Scalping opportunity in ETHUSDT ??
Scalping Opportunity in ETH? 📉 Short Setup Below 3488
📈 ETHUSDT is currently in a strong uptrend on the higher timeframes.
However, on the lower timeframe, there's a possibility of a short-term correction.
🔻 A short position can be considered below 3488, targeting 3361.
If the weakness continues, the fall may extend to 2570. ETHUSDT might consolidate within this range (3488 to 3361) for the next few weeks.
So, a safe exit zone would be around 3361.
🎯 Plan the trade, manage risk, and trail your stops accordingly.
#ETH #ETHUSDT #CryptoAnalysis #TradingView

ETH rise foreverMy advanced fibo technical analysis says that It has 6100 easy target in sometime. Then It can take bit of a break and then rise other levels. My ultimate target for Etherium is unbelievably 10k in coming time. It's currently undervalues. If BTC touch 100k mark this can easily double triple in no time.
Follow the targets given in the chart.


ETHUSDT Bullish Momentum Alert Ethereum is showing strong bullish momentum, and buyers are taking control.
I'm expecting the price to touch 3670 in the upcoming sessions if this momentum continues.

#ETH Bullish Idea And Possible MoveAll signs point to Ethereum’s crash risk being behind us for now. Get ready—once the volume picks up, ETH is set to pump hard!
I’m using a unique approach beyond just the usual TA and PA, so don’t overthink it. Just follow the trend and watch those candlesticks light up!
Disclaimer: This isn’t financial advice or a trade call—just sharing my excitement!
ETH LongLonging ETH is a good setup rn
Market Htf bullish (Weekly)
Daily - Consolidation
and in consolidation as we are into the range lows and tagged this 12hrs OrderBlock And Showed strength i will prefer longing rather than shitting into my own pants like bears

ETHEREUM Long Outlook – Grand Supercycle Perspective(2025.05.21)Hello everyone,
This is SeoVereign, operator of the SeoVereign Team.
Today, I would like to share an Ethereum analysis based on the daily (1D) chart for the first time in a while.
Before reading this post, please refer to the idea I uploaded on April 18, 2025, through the link below. It will help you better understand the context:
🔗
(Clicking the image will take you to the corresponding link.)
If you look at the April 18 idea, you’ll see that I presented a bullish outlook based on the Deep Crab pattern.
This analysis is a continuation of that idea.
Through years of research, I’ve observed that when a Deep Crab pattern sees a rebound from the PRZ (Potential Reversal Zone), the trend that begins from that point tends to extend for a long time.
If you look closely at the chart, you’ll also see the 2.24 Fibonacci extension level.
Some people messaged me saying, “Since it went above 1.902 and even exceeded the 2.0 Fibonacci line, isn’t this Deep Crab invalid?”
However, I’ve studied harmonic patterns in depth for a long time and have set my own Fibonacci criteria based on that research.
In this particular Deep Crab case, I define the invalidation level as 2.24.
Therefore, I judged that the pattern is still valid, and this allowed me to forecast a long-term bullish trend.
Back to the main point,
Based on this Deep Crab pattern, I’ve consistently maintained a bullish outlook on the daily chart,
and so far, there have been no clear signals indicating a reversal into a bearish trend.
Thus, I would like to post a continuation of the bullish outlook on the daily chart.
On May 19, 2025, there was a sharp drop around the 2,587 USDT level.
At that time, our team expected the bullish trend that started from around 2,447 USDT to hold its low and continue.
However, the price broke below 2,447 USDT and made a new low.
We then closely monitored Bitcoin’s movement in response.
Typically, strong volatility occurs before a major trend begins.
Bitcoin was also showing significant volatility at the time.
So we concluded: “Let’s maintain a bullish stance, but do not be fully convinced until the previous high of 2,587 USDT is clearly broken upward.”
And by the time this post is published, we’ve confirmed that the price has indeed broken above 2,587 USDT.
Therefore, I have come to the conclusion that the bullish trend is still valid.
Based on this, I present the following three target levels.
🎯 SeoVereign’s Ethereum Bullish Targets
1st Target: 3,000 USDT
2nd Target: 3,400 USDT
3rd Target: 3,700 USDT
The market still shows strong volatility.
I sincerely hope you all trade wisely and calmly, achieving great returns,
and may great fortune be with you both in trading and in life.
I’ll see you again in the next daily analysis.
Thank you.
- SeoVereign

TAKE LONG POSITION IN ETHasia killzone creating a high and btc is start to new ath and S&P 500 is bullish nasdaq also bullish so to take a position long

ETH BREAKDOWN BULL OR MANIPULATION ?SCENARIO 1
if eth break 3856 wait for 1H&4H candle close 2ND conformation BTC breakout TO BULLISH
SCENARIO 2
huge liq sweep already happen in previous price 4113 so price RETRACEMENT IN 4113 becareful

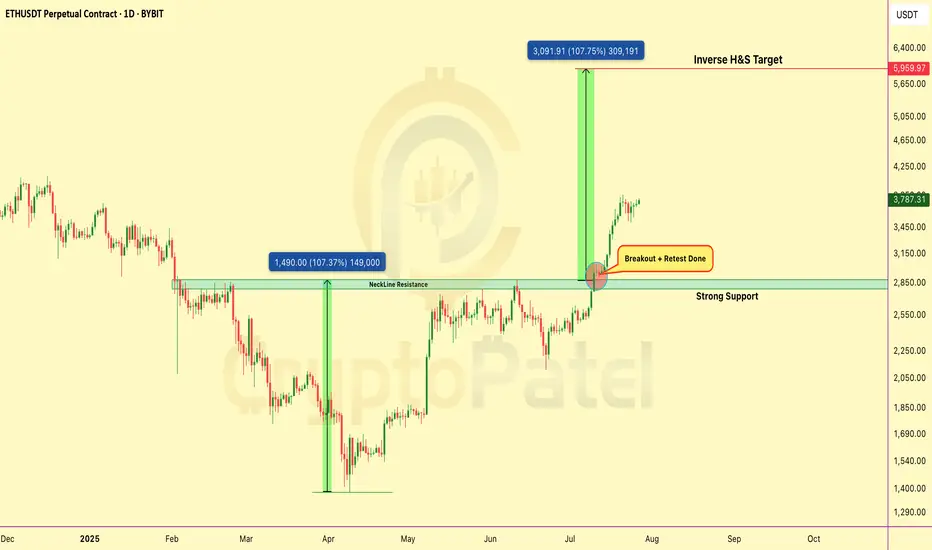
Ethereum Breakout Confirmed – Retest CompletedCRYPTOCAP:ETH has broken out Inverse Head & Shoulders on daily chart.
✅ Neckline breakout above $2,850
✅ Retest successful – strong support confirmed
✅ Targeting full move toward $6,000
Structure is bullish, momentum building. As long as #Ethereum holds above the neckline, continuation is likely.
Note: NFA & DYOR
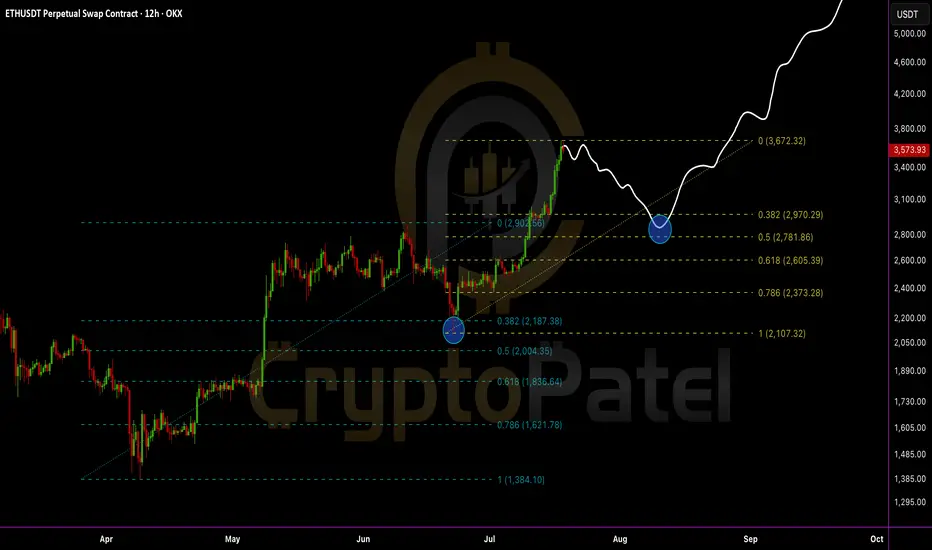
Everyone’s bullish now… but smart traders are waiting for this EEthereum just tapped a key resistance near $3,672 and is starting to show signs of cooling off.
A healthy retracement could bring ETH back to:
0.382 Fib – $2,970
0.5 Fib – $2,781
0.618 Fib – $2,605 (Strong demand zone)
IMO, we can expect ETH to revisit the $2,700–$3,000 zone before the next leg up.
This area will be the golden re-entry for long-term targets of $6,000–$8,000.
Stop-loss: Recent high and candle close above $3,675
Structure remains bullish:
✅ Previous dips into Fibs triggered strong buybacks
✅ Clean higher highs and higher lows
✅ Demand zone + retracement = opportunity
My View: Let price pull back. Then load up again. Bigger wave incoming.
DYOR | NFA
is Ethereum ready to $10,000Ethereum just broke out of a massive inverse head & shoulders and it’s flying past $3,400 again after 5 months. 🚀
Chart looks Bullish for a run toward $6K… but don’t be surprised by a dip to ~$2,800 first.
ETH is super bullish.
Next stops: $6K → $8K → $10K.
NFA & DYOR

Eth moonshot shortly Next target would be 3300 and 3800 before a strong retrace counted by year for the next ath expected at 9000

$ETH IS FLIRTING WITH A MASSIVE BREAKOUTCRYPTOCAP:ETH IS FLIRTING WITH A MASSIVE BREAKOUT
Price is hovering just below the HIGH LIQUIDITY ZONE at $2,867 — a major inflection point!
✅ Break above… We could see a parabolic push toward ATHs.
❌ Rejection = A sharp correction might hit hard.
It’s make or break time for Ethereum.
What’s your plan if this breaks?
NFA & DYOR

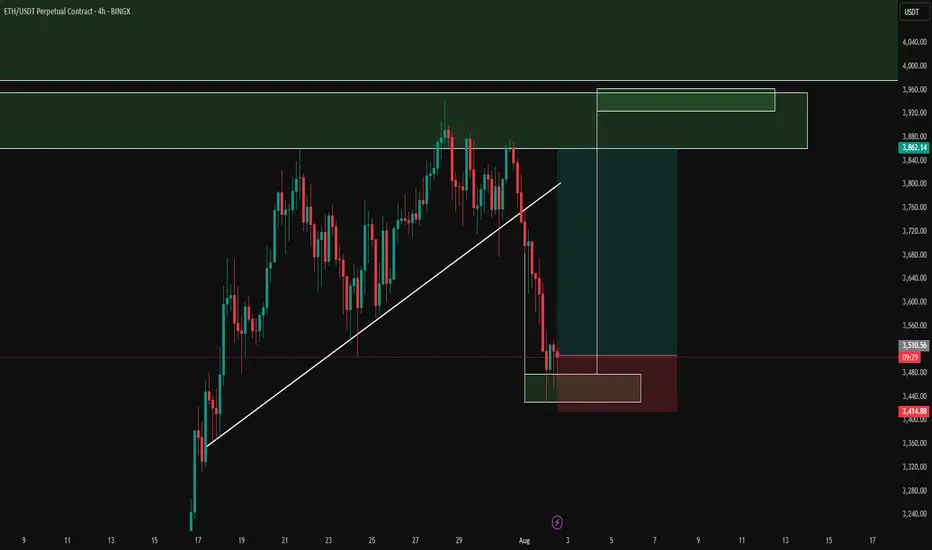
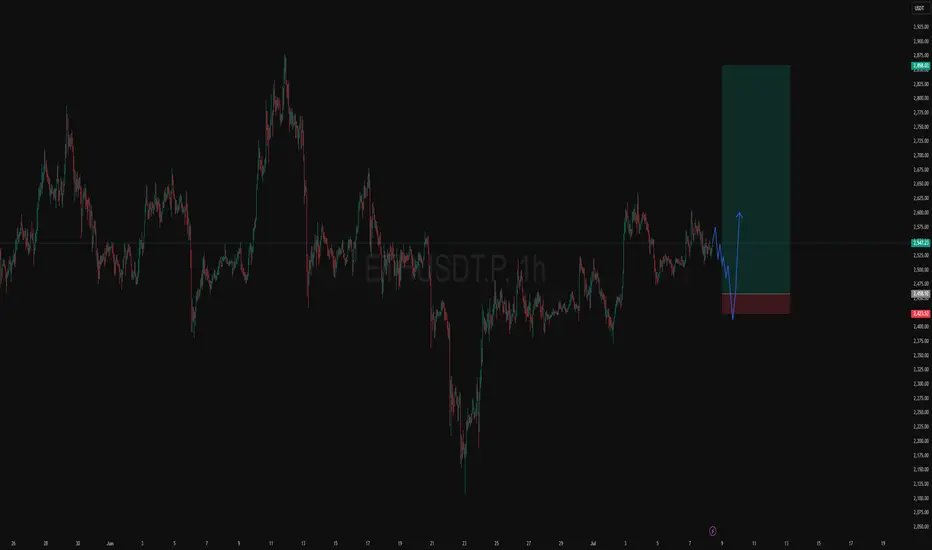
Weekly Long Setup | Jul 8th 2025 | Valid Until Weekly ClosePrice might retrace to a strong pivot zone (marked by the red box).
Structure remains bullish with potential for continuation after pullback.
The green box represents a high-probability long opportunity with tight risk control.
Watch for price reaction within the red zone. Entry only if confirmation (e.g., bullish engulfing, strong wick rejections) appears.
The setup expires at end of the weekly candle close.
ETH Long Setup: Key Support Zone at $2,453.72The $2,453.72 zone on CRYPTOCAP:ETH looks promising for our next potential long setup.
It’s a key support level and holds significant liquidity—definitely a zone worth watching.
This is not financial advice. Always trade at your own risk.

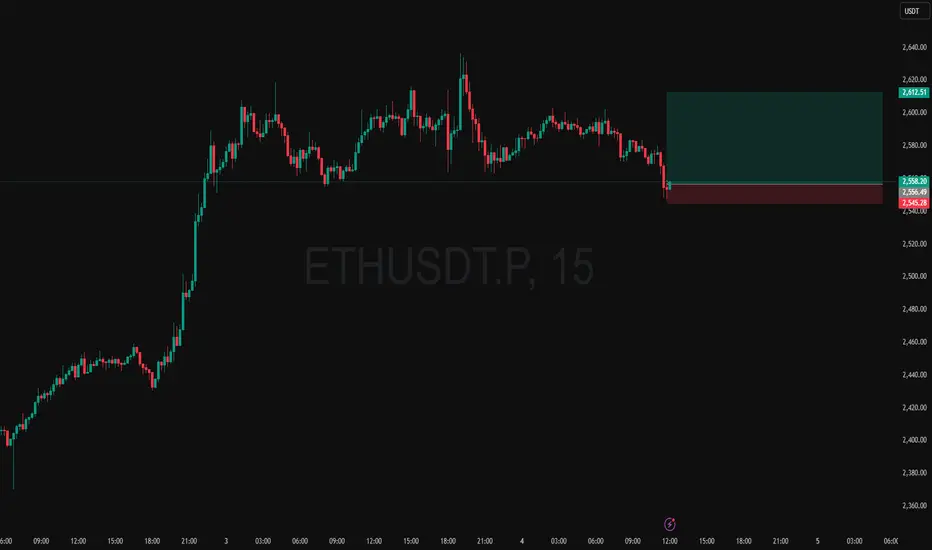
Intraday Long Setup | July 4th 2025 | Valid Until Daily ClosePrice retraced to a strong pivot zone.
Structure remains bullish with potential for continuation after pullback.
Tight risk control.
Watch for price reaction within the red zone. Entry only if confirmation appears
The setup expires at end of the daily candle close.
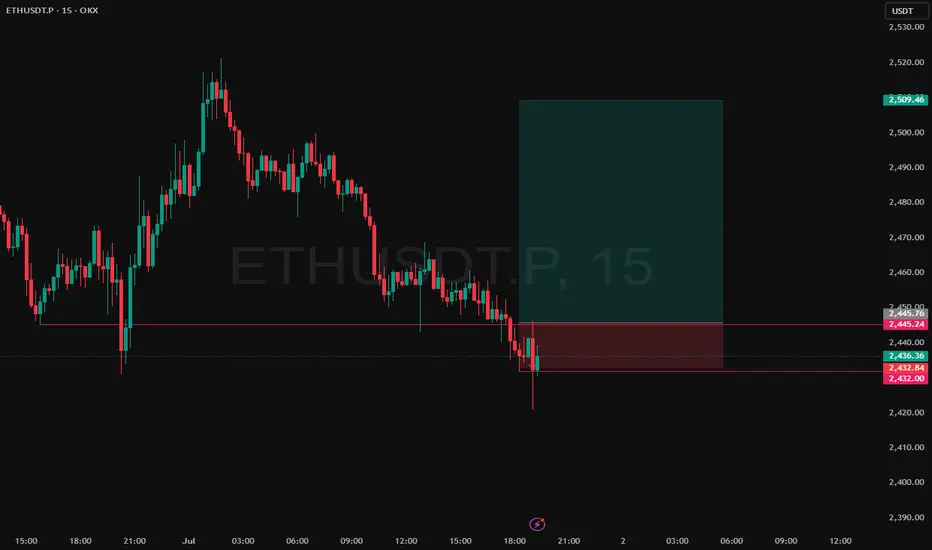
Intraday Long Setup | July 1st 2025 | Valid Until Daily ClosePrice retraced to a strong pivot zone.
Structure remains bullish with potential for continuation after pullback.
Tight risk control.
Watch for price reaction within the red zone. Entry only if confirmation appears
The setup expires at end of the daily candle close.
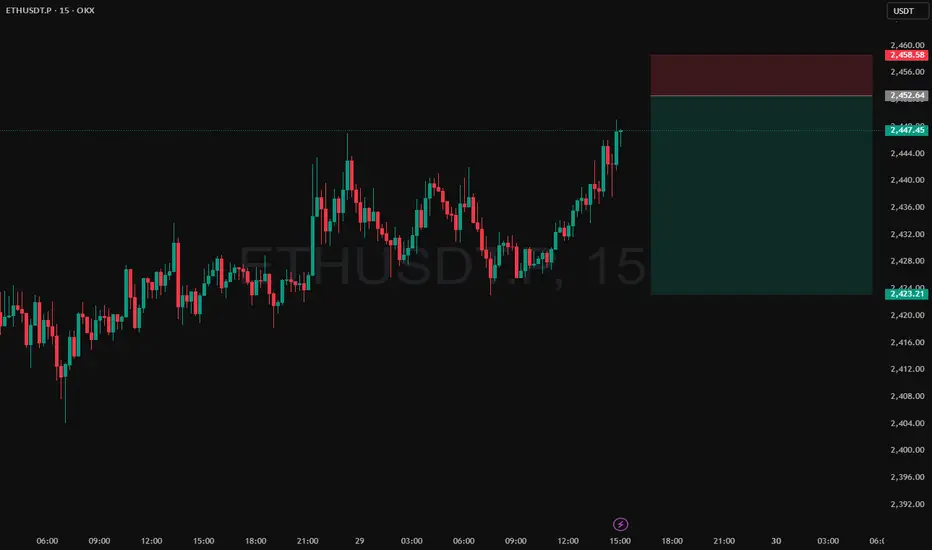
Intraday Short Setup | June 29th 2025 | Valid Until Daily ClosePrice has pushed into a potential intraday Pivot supply zone (red box) where sellers may step in. This trade is based on the expectation of a rejection from this area.
Entry: Red box — a short entry zone aligned with overhead supply
Stop Loss: Above the red zone (invalidates the setup)
Target: Green box — area to consider partial/full exit based on momentum
Risk-reward is favorable with a tight invalidation and clean downside target
Price may stall or reverse near the red box, creating short opportunity
Note:
This is an intraday trade idea that expires at 00:00 UTC (Daily Candle Close). Re-evaluate the setup if price remains indecisive near the entry zone close to that time.
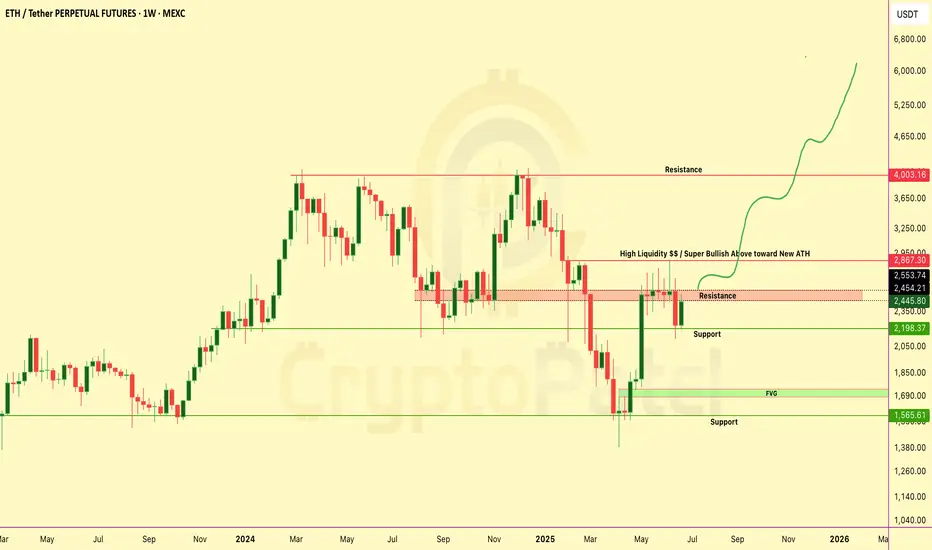
ETHEREUM Weekly Chart Breakdown – Massive Move Loading?ETHEREUM Weekly Chart Breakdown – Massive Move Loading?
ETH just pumped +9.9% this week... but it’s what comes next that really matters 👇
Key Resistance Wall → $2,867
🔹 This zone is packed with liquidity traps and past rejections.
🔹 Break this level = Unlocks ATH push toward $4K–$6K-$10k
Why This Chart Matters:
✅ Bullish structure reclaim
✅ Targeting “High Liquidity” zone above
✅ Possible parabolic rally if breakout confirms
Dips = Opportunities
If ETH dips from here... don’t panic.
→ Every dip = fresh accumulation zone
→ Below $2,000 = golden buy zone for long-term bulls
Liquidity Zone Break it = ATH rally incoming
Reject it = Buy the dip and ride the next wave
Comment & tag a friend who needs this alpha!
NFA & Dyor