ETH/USDT (4H) chartETH/USDT (4H) chart:
The price is currently trading near a support zone (around $3,250–3,300).
The chart shows a potential bullish setup with two marked target points above.
The Ichimoku Cloud suggests resistance around mid-levels before a full reversal.
Here’s the breakdown 👇
🔹 Key Levels:
Support zone: $3,250 – $3,300
First target (inside the cloud): around $3,700 – $3,750
Second target (top / resistance zone): around $4,150 – $4,200
🔹 Summary:
If ETH holds the current support and breaks above the cloud:
Target 1: ≈ $3,700
Target 2: ≈ $4,200
Invalidation: below $3,200 (support breakdown)
Trade ideas

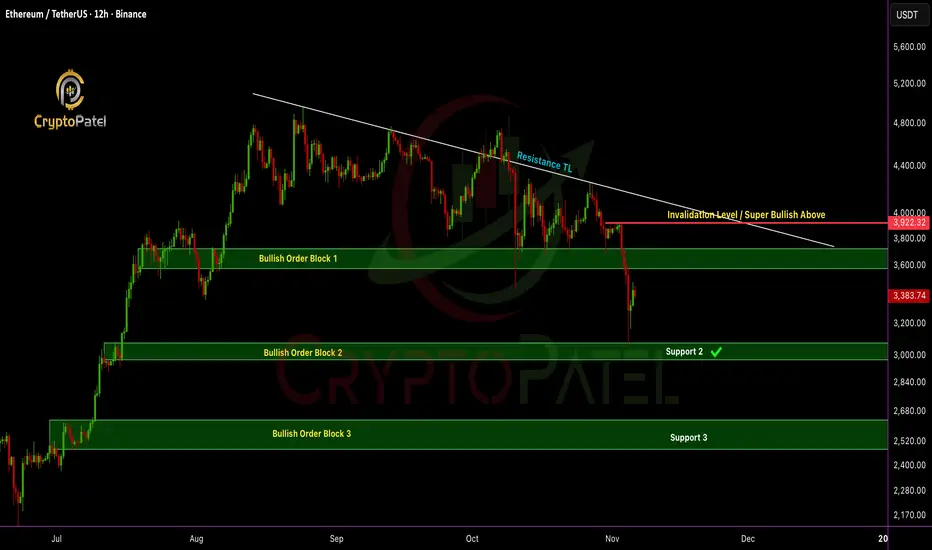
ETH/USDT dumped 20% after my analysisETHEREUM Update: Price just hit the bullish order block at $3,057 and bounced exactly as predicted ✅
Quick recap:
✅ Short-term: I’m bearish below $3,920, next potential leg down $2,500–$2,200 if $3,000 support breaks.
✅ Medium-term: Holding $3,000 support is key, could spark the next bullish wave.
✅ Long-term: Still super bullish & Target remains $10K–$15K ETH
Paper hands panic. Legends load the blood & hold.
Which one are you? 👇
NFA & DYOR
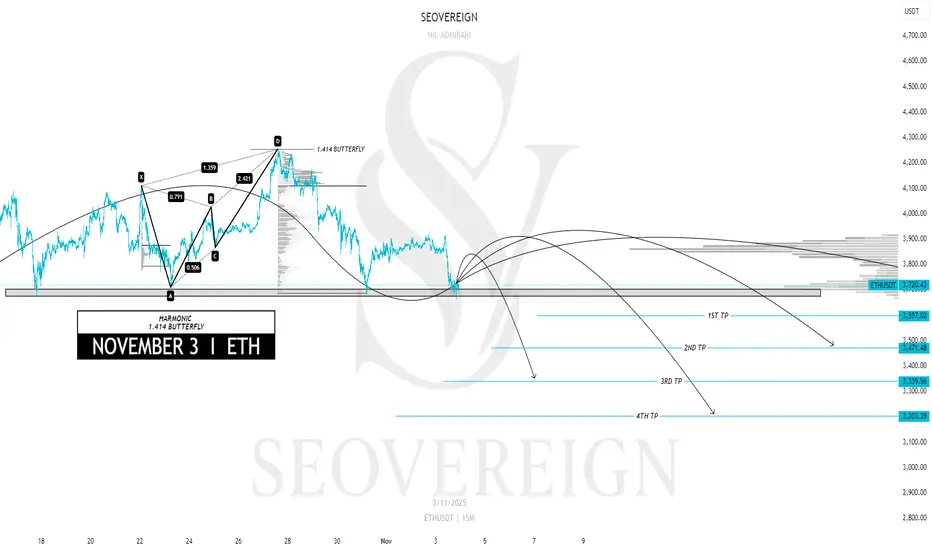
[SeoVereign] ETHEREUM BEARISH Outlook – November 03, 2025I would like to share my Ethereum idea as of November 3.
This idea is an extension of the one from October 27. The short positions entered on the 27th will be closed in profit in connection with this idea, and I plan to add some additional positions at the same time.
Basis — Harmonic 1.414 Butterfly Pattern
Currently, Ethereum is approaching the completion zone of the 1.414 Harmonic Butterfly pattern that I personally designed.
This zone is structurally an overextension area,
where a strong technical reversal possibility exists.
Accordingly, I set the average target price around 3,400 USDT.
Further position management and updates will be provided depending on market conditions.
Thank you for reading.
[SeoVereign] ETHEREUM BEARISH Outlook – October 27, 2025Hello everyone,
Currently, Ethereum has re-entered a major resistance zone,
and there is a high probability of a short-term corrective movement emerging.
First Basis — FIBONACCI 1.13~1.272
Ethereum is positioned within the 1.13–1.272 range relative to the upper structure.
This zone is generally recognized as an overheated area of an upward wave,
where selling pressure tends to emerge following the formation of a short-term high.
Second Basis — WAVE.M = WAVE.N × 1.618
The ongoing M-wave shows an extension ratio of approximately 1.618 relative to the previous N-wave.
This represents an overextended structure in wave theory,
which is typically interpreted as a sign of trend exhaustion and potential reversal.
Accordingly, the average target price is set around 3,864 USDT.
This perspective is based on data as of October 26,
and further updates will be provided to refine this outlook as the market develops.
Thank you for reading.

Intraday Long Setup | Oct 26th 2025 | Valid Until Daily ClosePrice might retrace to a strong pivot zone.
Structure remains bullish with potential for continuation after pullback.
Tight risk control.
Watch for price reaction within the red zone. Entry only if confirmation appears
The setup expires at end of the daily candle close.

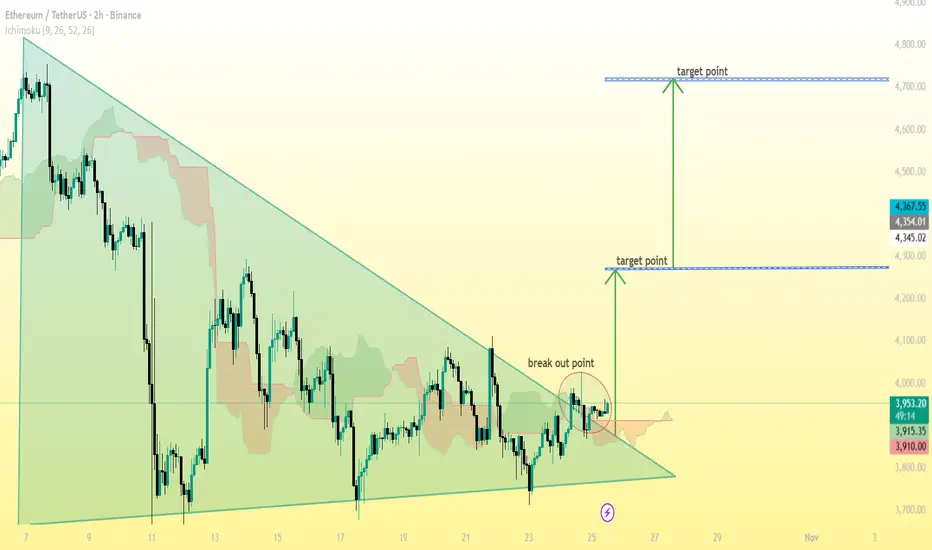
ETH/USDT (Ethereum vs Tether) on the 2-hour timeframe...ETH/USDT (Ethereum vs Tether) on the 2-hour timeframe, the pattern drawn is a symmetrical triangle — a consolidation setup that often leads to a strong breakout.
Here’s the target breakdown based on my chart:
---
📈 Current breakout level:
Around $3,950 – $3,960
🎯 Target 1 (short-term):
Around $4,350 – $4,370
This is the first target after the breakout, matching my chart’s lower target point.
(≈ +10% move from the breakout)
---
🎯 Target 2 (extended / major):
Around $4,700 – $4,750
This is the second target — the measured move from the triangle’s height projected upward.
(≈ +18%–20% move from the breakout)
---
⚠ Support / Stop-loss suggestion:
If price closes back below $3,900, it may invalidate the breakout and signal a false move.
---
✅ Summary:
Breakout point: $3,950
Target 1: $4,350
Target 2: $4,700
Stop loss: $3,900
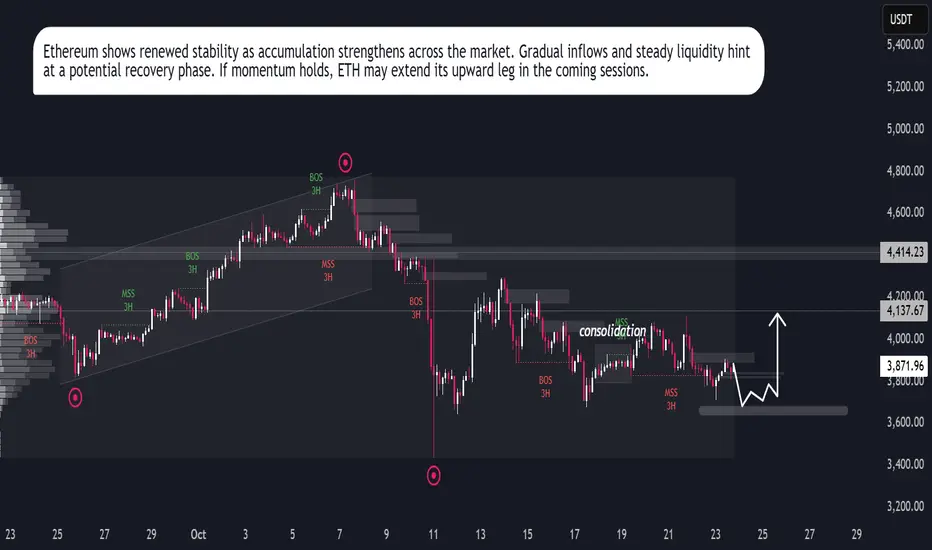
ETH Eyes Upside RunEthereum shows signs of regaining strength after a prolonged corrective phase. The asset is currently stabilizing, supported by gradual inflows from institutional participants and renewed investor accumulation. Market behavior indicates controlled volatility, suggesting a preparation phase before a potential expansion.
Network data reflects consistent transaction activity, while liquidity concentration hints at sustained participation from long-term holders. The recent stabilization in funding rates and improved open interest add weight to the recovery outlook.
If momentum continues to build under these conditions, Ethereum could enter a structured growth cycle in the coming sessions.
[SeoVereign] ETHEREUM BEARISH Outlook – October 21, 2025Hello everyone,
This idea is connected to the one shared on the 19th.
I am still holding the short position that was entered based on the October 19 idea, and since some of the underlying reasons have been slightly revised, I’m sharing this as an additional update.
Today, as of October 21, I would like to present my bearish (short) outlook on Ethereum.
Basis — BEARISH BAT PATTERN / WAVE5 = WAVE1 × 0.5
Ethereum is currently positioned near the PRZ (Potential Reversal Zone) of the Bearish Bat Pattern.
This pattern represents a typical retracement-based bearish reversal structure,
where the price tends to form a top around the 0.886 retracement level of XA before transitioning into a downward move.
In addition, within the wave structure, the ratio of WAVE5 = WAVE1 × 0.5 is being formed,
which is generally interpreted as an early termination zone of a short-term downward wave.
In other words, both pattern completion and ratio convergence are occurring simultaneously,
indicating that the current region provides a valid reversal signal from a bearish perspective.
Accordingly, I set the average target price around 3,756 USDT.
Depending on future chart developments,
I will continue to provide updates regarding position management and any changes.
Thank you.

ETH ready to boom🚀 **ETH/USDT Setup (1H Chart)**
Current Price: **$3,871**
ETH is consolidating tight around support after a clean rebound from $3.73K 📉
A breakout from this range could trigger a sharp move upward 📈
Do you think ETH can reclaim **$4K+** this week? 👀
Comment your view ⬇️ #ETH #Crypto #Want to trade like pro then join with me # drop a msg#PriceAction #CryptoAnalysis

$ETH LongMost likely I’ll look to long #Ethereum if #Bitcoin manages to reclaim $108K.
Even CRYPTOCAP:BTC seems to be forming a harmonic setup, which I’ll update soon. For now, ETH looks like the better play if we start seeing some relief in the market.

[SeoVereign] ETHEREUM BEARISH Outlook – October 18, 2025Today, as of October 18, I would like to share my bearish outlook on Ethereum.
This analysis is based on two main factors.
First — Bearish Bat Pattern
Currently, Ethereum is approaching the PRZ (Potential Reversal Zone) of the Bat pattern.
This area is generally interpreted as a zone where buying momentum weakens
and short-term reversal pressure tends to concentrate.
If the price fails to sustain upward momentum within this PRZ,
a corrective retracement from the overextended zone is likely to occur.
Second — Wave 5 = Wave 1 × 0.618 Ratio Structure
This represents a typical harmonic ratio completion between waves in Elliott Wave Theory,
indicating that the upward momentum is gradually being exhausted.
The current wave structure is nearing this ratio,
suggesting a potential entry into a correction phase along with a short-term upside limit.
Accordingly, the average target price is set around 3,700 USDT.
Depending on future chart developments,
I will continue to provide updates on position management and any changes to this outlook.
Thank you.

Ethereum Accumulation Before BreakoutEthereum has regained bullish momentum after a recent correction phase, supported by improving sentiment in the broader crypto market. The asset is displaying early signs of stabilization as traders begin accumulating around value zones, indicating renewed confidence among market participants.
From a macro perspective, Ethereum continues to benefit from increasing network activity, particularly within the DeFi and Layer-2 ecosystems. The sustained growth in on-chain transactions and staking participation reflects long-term investor interest, adding strength to the current recovery phase.
Market data also shows that institutional inflows into major crypto assets are on the rise, with Ethereum standing out due to its strong fundamentals and ecosystem resilience. This inflow supports the likelihood of a continued price rebound, as liquidity and trading volume remain consistent.
Overall, ETHUSDT is showing a constructive recovery setup. The combination of improving sentiment, strong fundamentals, and gradual accumulation suggests a potential medium-term bullish continuation, provided global market conditions remain favorable.

Ethereum’s Next Move: $3,000 Buy Zone or $10,000 Breakout?Ethereum’s Next Move: $3,000 Buy Zone or $10,000 Breakout?
Current Market Overview:
Ethereum is currently trading below $4,000, indicating short-term weakness as bulls struggle to regain control. The $4,000 level remains a key pivot point, holding above it is essential for any sustained move toward higher targets.
Key Levels to Watch:
🔹 Immediate Resistance: $4,000
🔹 Major Support Zone: $3,000 – $2,600 (ideal accumulation area)
🔹 Upside Targets: $8,000 – $10,000 (if $4,000 is reclaimed)
Bullish Scenario:
If Ethereum breaks and holds above $4,000, it confirms bullish momentum and opens the path toward $8,000–$10,000 in the mid to long term.
Bearish / Accumulation Scenario:
If ETH remains below $4,000, expect a possible retracement toward $3,000 – $2,600. This zone could act as a strong accumulation area for long-term investors.
Outlook:
The broader structure remains long-term bullish despite short-term pullbacks. Dips into major support zones should be viewed as opportunities for strategic accumulation.
⚠️ Note: Always DYOR (Do Your Own Research) before making any investment decisions. This analysis is for educational purposes only.

[SeoVereign] ETHEREUM BEARISH Outlook – October 13, 2025Today, I would like to share my bearish outlook on Ethereum as of October 13.
The first basis for this view lies in the 0.707 Fibonacci retracement zone.
The 0.707 level is positioned between the traditional 0.618 and 0.786 ratios and is widely recognized in practical chart analysis as a zone where reversals frequently occur after an excessive retracement.
In particular, the 0.707 area is often interpreted as the final attempt by buyers, and resistance reactions at this level generally serve as signals of trend reversal.
Currently, Ethereum is facing upward pressure near this 0.707 ratio, suggesting that the likelihood of a short-term bearish reversal is gradually increasing.
The second basis is that the length ratio between arbitrary waves M and N is 1:1.618.
This forms a golden ratio structure, which aligns with a typical pattern where a corrective (retracement) wave appears after an asymmetrically extended impulsive wave.
In other words, when Wave N extends to 1.618 times the length of Wave M, it indicates that the market has entered an overheated phase—often followed by a corrective decline.
Accordingly, the average target price is set around 3,840 USDT.
Depending on the subsequent development of the chart,
I will provide updates on this idea, including position management and any notable changes.
Thank you for reading.

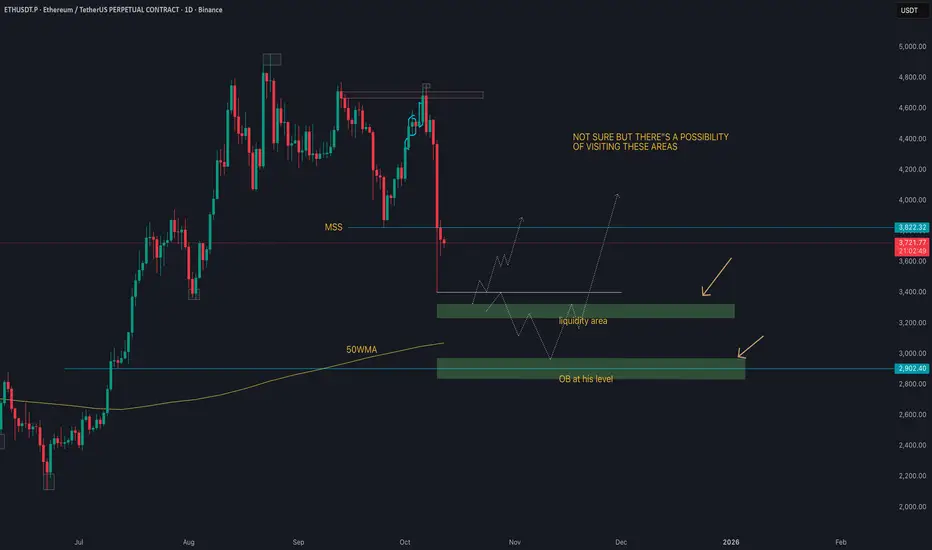
Ethereum 1H - LongEthereum 1H long, looks like an AMD (accumulation manipulation Distribution) set-up to me.
Very hard this time for $ETH
As the market structure shift and if CRYPTOCAP:ETH failed to close above it
there's a possibility that it visited these areas maybe.
I'll be happy if 'm wrong.
not sure but.....
🚩liquidity area below the long wick
🚩also there a OB at that level
or just it going up..it just a manipulation for creating fear
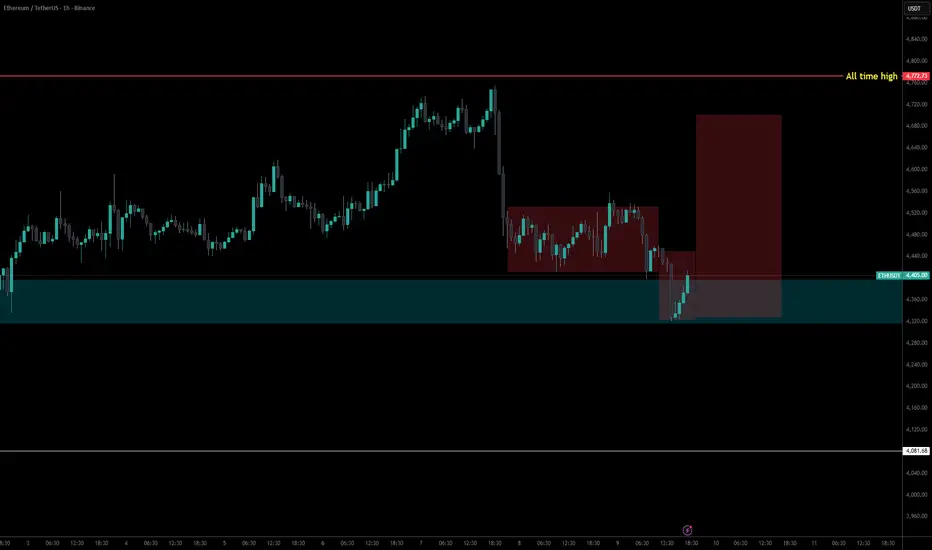
[SeoVereign] ETHEREUM BEARISH Outlook – October 05, 2025Hello everyone.
I hope you are all having a peaceful day.
Today, I am writing to share my short position perspective on Ethereum as of October 5th.
The first basis is the 1.13 Alternate Bat (ALT BAT). The Alternate Bat is a variation of the harmonic pattern established by Scott Carney, and its core principle lies in defining the PRZ (Potential Reversal Zone) where point D is located at 1.13 times the XA leg (=1.13XA). The convergence of these ratios creates a relatively narrow and reliable retracement (or reversal) zone, so when D is positioned around 1.13XA, it is necessary to carefully observe the potential for a short- or mid-term reversal.
The second basis is that an arbitrary wave N forms a 0.618 length ratio (that is, N ≒ 0.618 × M) with another arbitrary wave M. Among Fibonacci ratios, 0.618 (61.8%) is one of the representative standards used in Elliott Wave and harmonic analyses for measuring wave length and retracement. When one wave exhibits approximately 61.8% of another’s length, that point tends to act as a natural retracement or termination zone, and the reliability increases especially when it overlaps with other technical grounds.
Accordingly, the average target price is set around 4,415 USDT.
As the chart movement unfolds, I will provide updates on position management through revisions to this idea.
Thank you for reading.

Decoding Market Movements with Volume ProfileWhat is Volume Profile?
Volume Profile is a graphical representation of the amount of trading volume that has occurred at various price levels over a specified period. Unlike traditional volume bars that are plotted at the bottom of a price chart (showing volume over time), Volume Profile displays volume horizontally across price levels, highlighting where the most trading activity occurred.
This is critical because it helps identify price acceptance and rejection zones — areas where traders were most or least interested in transacting. These zones often become future levels of support and resistance.
Core Components of Volume Profile
Point of Control (POC):
This is the price level at which the highest volume of trading occurred within the selected time frame. The POC acts as a “magnet” for price and often represents a fair value area where both buyers and sellers have agreed most.
Value Area (VA):
This is the range of prices that contains around 70% of the total traded volume. It indicates where the majority of trading took place and is divided into:
Value Area High (VAH): The upper boundary of the value area.
Value Area Low (VAL): The lower boundary of the value area.
Prices moving outside this range suggest either overvaluation or undervaluation in the short term.
High Volume Nodes (HVN):
These are zones with concentrated trading activity. They signify strong price acceptance and tend to act as support or resistance.
Low Volume Nodes (LVN):
These are price levels with very little trading activity, showing price rejection zones. When price revisits these areas, it often experiences quick movement due to a lack of liquidity.
How Volume Profile Differs from Traditional Volume Indicators
Traditional volume indicators, such as the volume histogram or On-Balance Volume (OBV), show how much volume occurred over time but do not indicate at which prices the volume took place. Volume Profile, on the other hand, provides a spatial context — revealing where the big players entered or exited the market.
This distinction is vital because markets are driven by institutional traders who operate at specific price levels. By analyzing these price-based volume concentrations, retail traders can align themselves with “smart money” and anticipate key turning points.
Using Volume Profile in Market Analysis
1. Identifying Market Structure
Volume Profile helps traders classify the market into balance (range-bound) and imbalance (trending) conditions.
In a balanced market, volume is evenly distributed, and the price rotates around the POC.
In an imbalanced market, volume shifts in one direction, signaling a new trend or breakout.
Recognizing these conditions early allows traders to adjust strategies — employing mean reversion in balanced phases and trend-following in imbalanced phases.
2. Spotting Support and Resistance Levels
Volume clusters (HVNs) often become key support and resistance zones. When price moves back toward these areas, it may pause or reverse, as these levels represent heavy institutional interest. Conversely, LVNs are potential breakout zones, where prices move swiftly due to a lack of opposing orders.
For example:
If the price rises above VAH with strong volume, it signals bullish conviction.
If it falls below VAL with heavy volume, it indicates bearish strength.
3. Detecting Institutional Activity
Institutions trade in large volumes, and their footprints are visible on the Volume Profile. When you see a large volume concentration forming abruptly, it’s often the result of institutional accumulation or distribution. Understanding these patterns can help traders anticipate future price moves.
For instance:
Accumulation: Heavy volume at the bottom of a range followed by upward price movement.
Distribution: Heavy volume at the top of a range followed by a downward trend.
4. Volume Profile and Trend Confirmation
When analyzing trends, Volume Profile confirms whether price movements are supported by strong participation.
In an uptrend, increasing volume at higher price levels suggests healthy demand.
In a downtrend, higher volume at lower prices confirms strong selling pressure.
If volume weakens during trend continuation, it may signal an impending reversal.
Integrating Volume Profile with Other Technical Tools
To enhance accuracy, traders often combine Volume Profile with complementary tools such as:
Moving Averages:
Identify overall trend direction, while Volume Profile reveals strong price zones within that trend.
Price Action Analysis:
Combine candlestick patterns (like pin bars or engulfing candles) with volume zones to spot high-probability entries.
Market Profile (TPO Charts):
While Volume Profile shows volume distribution, Market Profile displays time spent at each price level, offering a deeper understanding of market behavior.
Fibonacci Retracements:
When Fibonacci levels align with HVNs or LVNs, the confluence strengthens potential reversal zones.
Volume Profile Across Different Markets
Stock Market:
In equities, Volume Profile reveals where institutional buying or selling occurred. It helps traders determine entry levels during consolidations and exit points during rallies.
Futures Market:
Futures traders rely heavily on Volume Profile to identify fair value zones. Exchanges provide accurate volume data, making this tool extremely effective for intraday and positional analysis.
Forex Market:
Though Forex lacks centralized volume data, many platforms offer tick volume approximations. Even this limited data, when analyzed with price levels, gives valuable market insights.
Cryptocurrency Market:
In crypto trading, where volatility is high, Volume Profile helps traders detect zones of high liquidity and potential breakout points.
Practical Trading Strategies Using Volume Profile
1. Reversion to Mean (POC Bounce) Strategy
Wait for price to move away from POC and show exhaustion.
Enter trade when price starts reverting back toward POC.
Use VAH and VAL as targets and stop-loss zones.
2. Breakout and Retest Strategy
Identify LVN or VAL/VAH breakout levels.
Wait for the price to retest these zones with declining volume.
Enter in the direction of the breakout, using the next volume node as the target.
3. Volume Gap Play
When there’s a visible volume gap between two HVNs, it indicates a low liquidity zone.
If price enters this gap, it usually moves quickly until it reaches the next high-volume area.
4. Intraday Volume Profile Setup
Use smaller time-frame profiles (like 5-min or 15-min sessions).
Identify session POCs and value areas.
Trade pullbacks to these zones in alignment with overall market bias.
The Psychology Behind Volume Profile
Volume Profile doesn’t just show numbers — it visualizes market psychology. Every spike or dip in volume tells a story about traders’ emotions:
High-volume zones reflect equilibrium — agreement between buyers and sellers.
Low-volume zones reflect indecision or rejection — a lack of conviction.
Shifts in volume concentration reveal sentiment transitions, such as greed turning to fear or vice versa.
By interpreting these patterns, traders can anticipate how collective behavior might drive the next market phase.
Advantages of Using Volume Profile
Provides clear visual representation of where the real market interest lies.
Identifies hidden support and resistance levels ignored by conventional indicators.
Helps understand institutional footprints and market intent.
Offers flexibility across all markets and time frames.
Encourages data-driven trading decisions instead of emotional impulses.
Limitations of Volume Profile
Despite its effectiveness, traders must remain aware of its constraints:
It requires accurate volume data — not always available in decentralized markets.
Works best when combined with other technical tools.
Interpretation can be subjective; novice traders might misread key zones.
In fast-moving or news-driven markets, volume analysis may lag behind price action.
Conclusion
The Volume Profile is not just another indicator; it’s a comprehensive framework for understanding how markets truly function. By revealing the invisible dynamics of supply and demand, it allows traders to see beyond surface-level price movements. When integrated with disciplined market analysis, it becomes a strategic advantage — helping identify fair value, detect institutional participation, and forecast future price direction with greater confidence.
In today’s algorithm-driven trading environment, those who understand where and why volume accumulates can anticipate market turns before they happen. Whether you’re a short-term scalper, swing trader, or long-term investor, mastering the Volume Profile can transform your market perspective — turning raw data into actionable insight and uncertainty into opportunity.
Part 2 Ride The Big Moves Understanding Call and Put Options
There are two main types of options: Call Options and Put Options.
Call Option:
A call option gives the holder the right to buy the underlying asset at a fixed strike price within a specified time.
Example: If you buy a call option on Reliance at ₹2,500 strike price and the price rises to ₹2,700, you can exercise your right to buy at ₹2,500 and profit from the difference.
Put Option:
A put option gives the holder the right to sell the underlying asset at a fixed strike price within a specified time.
Example: If you buy a put option on Infosys at ₹1,500 strike price and the stock falls to ₹1,300, you can sell at ₹1,500 and gain the difference.
Think of a Call Option as being bullish (expecting price rise) and a Put Option as being bearish (expecting price fall).

Supercycle 2025: Metals, Energy, and PricesIntroduction
The global commodities market is experiencing a significant transformation in 2025, characterized by a resurgence in metal and energy prices. This phenomenon, often referred to as a "commodity supercycle," is driven by a confluence of factors including the energy transition, geopolitical tensions, and structural supply constraints. Understanding the dynamics of this supercycle is crucial for investors, policymakers, and industry stakeholders.
1. Understanding the Commodity Supercycle
Definition and Historical Context
A commodity supercycle refers to an extended period during which commodity prices remain well above their long-term trend, typically lasting several years or even decades. Historically, such supercycles have been driven by factors like industrialization, technological advancements, and shifts in global demand.
Current Drivers
In 2025, the supercycle is primarily fueled by:
Energy Transition: The global shift towards renewable energy sources is increasing demand for metals like copper, lithium, and nickel.
Geopolitical Instability: Conflicts and trade tensions are disrupting supply chains, leading to price volatility.
Supply Constraints: Limited investments in mining and energy infrastructure over the past decade are leading to supply shortages.
2. Metals: The Backbone of the Supercycle
Copper
Copper is at the forefront of the current supercycle. Its demand is surging due to its essential role in electric vehicles (EVs), renewable energy systems, and grid infrastructure. In 2025, copper prices have climbed to near-record levels, driven by a complex interplay of surging demand and significant supply disruptions. Analysts project a 30% increase in copper demand by 2040.
Lithium and Nickel
Lithium and nickel are critical for battery production. The rise of EVs and energy storage solutions is propelling their demand. However, supply is struggling to keep pace, leading to price increases.
Gold
Gold has emerged as a safe haven amid economic uncertainties. In October 2025, gold prices surpassed $4,000 per ounce for the first time, marking a 53% increase year-to-date. This rally is attributed to factors like anticipated interest rate cuts, a weak U.S. dollar, and geopolitical instability.
3. Energy: The Fuel of the Supercycle
Oil
The energy sector is witnessing a paradox. While global oil production is at record highs, oversupply concerns are leading to price declines. The U.S. Energy Information Administration (EIA) forecasts U.S. oil production to reach 13.53 million barrels per day in 2025, yet prices are expected to average $65 per barrel, down about 15% from the previous year.
Natural Gas
Natural gas prices are experiencing volatility due to fluctuating demand and supply disruptions. The transition to cleaner energy sources is also impacting its long-term outlook.
Renewable Energy
Investments in renewable energy infrastructure are driving demand for materials like steel, aluminum, and rare earth elements. The shift towards a materials-intensive energy system is reshaping global commodity markets.
4. Implications for Investors and Policymakers
Investment Opportunities
Metals and Mining Stocks: Companies like Tata Steel and Hindalco are benefiting from rising metal prices and increased demand.
Energy Infrastructure: Investments in renewable energy projects and related infrastructure are poised for growth.
Commodity ETFs: Funds like SPDR Gold Shares (GLD) and United States Oil Fund (USO) offer exposure to commodity markets.
Policy Considerations
Supply Chain Resilience: Policymakers must address vulnerabilities in commodity supply chains, especially concerning critical minerals.
Sustainable Mining Practices: Encouraging environmentally responsible mining can mitigate the ecological impact of increased extraction activities.
Energy Transition Strategies: Developing comprehensive plans for transitioning to renewable energy can ensure energy security and economic stability.
5. Conclusion
The commodity supercycle of 2025 presents both challenges and opportunities. While rising prices can benefit producers and investors, they also underscore the need for strategic planning and investment in sustainable practices. As the world continues its transition towards cleaner energy, the dynamics of commodity markets will play a pivotal role in shaping the global economic landscape.

3 - Possibile Outcome on $ETHAny of these three scenarios might play out on ETH: a continuation from here, or a drop to retest the H4 FVG followed by a reversal.

E-Commerce Trading1. Introduction
E-commerce trading, also known as electronic commerce trading, represents the buying and selling of goods and services over digital platforms. Unlike traditional trading, which relies on physical stores, direct interaction, and manual processes, e-commerce operates over the internet, enabling global access, efficiency, and automation. With the exponential growth of internet penetration, smartphone usage, and digital payment systems, e-commerce trading has become one of the fastest-growing segments of the global economy.
E-commerce trading encompasses a broad spectrum of activities, including retail trading, wholesale trading, business-to-business (B2B) transactions, business-to-consumer (B2C) sales, consumer-to-consumer (C2C) platforms, and increasingly, business-to-government (B2G) operations. This digital marketplace has transformed traditional commerce by integrating technology, logistics, marketing, and finance, enabling businesses and consumers to interact seamlessly.
2. History and Evolution
Early Beginnings
The concept of e-commerce trading dates back to the late 20th century. Early examples include Electronic Data Interchange (EDI) systems used by corporations to exchange business documents electronically. The first online retail sale is often credited to the 1994 sale of a Sting CD via the website NetMarket. Soon after, Amazon and eBay emerged as pioneers, creating the blueprint for online marketplaces.
Technological Milestones
Several technological developments accelerated the growth of e-commerce trading:
Internet Expansion: The widespread availability of broadband internet allowed users to access online stores easily.
Secure Payment Gateways: Innovations like SSL encryption, PayPal, and later UPI, digital wallets, and credit/debit card integrations made online transactions secure and convenient.
Mobile Commerce: With smartphones becoming ubiquitous, mobile apps and responsive websites enabled trading anytime, anywhere.
AI and Data Analytics: Personalized recommendations, demand forecasting, and dynamic pricing became possible, improving trading efficiency.
Cloud Computing: Allowed scalable online storefronts and storage solutions for businesses without heavy infrastructure investments.
3. Types of E-Commerce Trading
E-commerce trading is not a monolithic concept; it can be categorized based on the nature of participants:
3.1 Business-to-Consumer (B2C)
B2C trading involves businesses selling directly to consumers. Amazon, Flipkart, Myntra, and Walmart are classic examples. This segment focuses on:
Product variety and convenience.
Personalized marketing using AI and customer analytics.
Rapid delivery services.
Seamless payment methods, including COD, wallets, and UPI.
3.2 Business-to-Business (B2B)
B2B platforms facilitate transactions between companies. Examples include Alibaba, IndiaMART, and ThomasNet. Key characteristics:
Bulk transactions at negotiated prices.
Long-term partnerships and contracts.
Integration of supply chain management with trading platforms.
3.3 Consumer-to-Consumer (C2C)
C2C platforms allow individuals to trade with each other. eBay, OLX, and Quikr are examples. Features include:
Peer-to-peer sales of used goods or handmade items.
Trust-building through rating systems.
Secure payment mechanisms to ensure safe trades.
3.4 Business-to-Government (B2G)
B2G trading involves businesses providing products or services to government agencies. Digital tendering platforms, government e-procurement systems, and contracts for public projects are part of this domain.
4. Key Components of E-Commerce Trading
E-commerce trading relies on multiple integrated components that ensure smooth operation:
4.1 Online Marketplace Platforms
Platforms such as Amazon, Flipkart, Shopify, and Etsy provide the digital infrastructure for trading. These platforms host multiple sellers, offer product search and categorization, manage orders, and facilitate payments.
4.2 Payment Gateways and Financial Services
Secure payment systems are the backbone of e-commerce. Payment gateways process online transactions, while financial technologies (FinTech) like UPI, PayPal, Stripe, and digital wallets ensure instant transfers and refunds.
4.3 Logistics and Supply Chain Management
Efficient trading requires prompt delivery. Logistics includes warehousing, transportation, inventory management, and last-mile delivery. Companies like DHL, FedEx, and Indian startups like Delhivery revolutionized supply chain efficiency.
4.4 Digital Marketing
E-commerce trading thrives on digital marketing strategies, including:
Search Engine Optimization (SEO)
Social media advertising
Influencer marketing
Email campaigns and retargeting
Personalized recommendation engines
4.5 Technology Infrastructure
Modern e-commerce trading depends on advanced technologies:
Cloud computing for scalable server architecture.
AI and machine learning for predictive analytics and chatbots.
Big data for consumer insights.
AR/VR for immersive shopping experiences.
Blockchain for secure transactions and supply chain transparency.
5. Advantages of E-Commerce Trading
E-commerce trading offers numerous benefits for both businesses and consumers:
5.1 Global Reach
Unlike traditional stores limited by location, e-commerce platforms enable businesses to reach customers worldwide, expanding market potential significantly.
5.2 Cost Efficiency
Lower overhead costs due to the absence of physical storefronts, reduced staff requirements, and automation in operations contribute to cost efficiency.
5.3 Convenience
Consumers can shop 24/7, compare prices, read reviews, and receive products at their doorstep, enhancing customer satisfaction.
5.4 Personalized Experiences
Using AI-driven recommendations and behavioral analytics, e-commerce platforms provide tailored product suggestions, increasing sales and customer loyalty.
5.5 Analytics-Driven Decisions
Real-time tracking of sales, customer preferences, and market trends allows businesses to make informed decisions about inventory, pricing, and marketing.
6. Challenges in E-Commerce Trading
Despite its growth, e-commerce trading faces significant challenges:
6.1 Cybersecurity Risks
Hacking, data breaches, and fraudulent transactions threaten businesses and consumer trust.
6.2 Logistics and Supply Chain Bottlenecks
Delivery delays, damaged products, and inventory mismanagement can reduce customer satisfaction.
6.3 Intense Competition
Low barriers to entry in e-commerce result in fierce competition, driving prices down and impacting profit margins.
6.4 Regulatory and Legal Issues
Compliance with tax laws, consumer protection regulations, cross-border trade laws, and data privacy rules is complex.
6.5 Technological Dependence
Overreliance on digital infrastructure exposes businesses to risks of downtime, server failures, or software glitches.
Conclusion
E-commerce trading has transformed the way businesses and consumers interact, creating an ecosystem that is fast, efficient, and global. It bridges the gap between markets and customers, empowers small businesses, and drives technological innovation. While challenges like cybersecurity, logistics, and competition remain, emerging trends in mobile commerce, AI, AR, and sustainability promise a bright and transformative future.
Businesses that adapt quickly, embrace technology, and prioritize customer-centric strategies are likely to thrive, while traditional models will need to evolve or collaborate with digital platforms to remain relevant. In essence, e-commerce trading is not just a trend—it is the new norm in global commerce, reshaping the very fabric of trade in the 21st century.

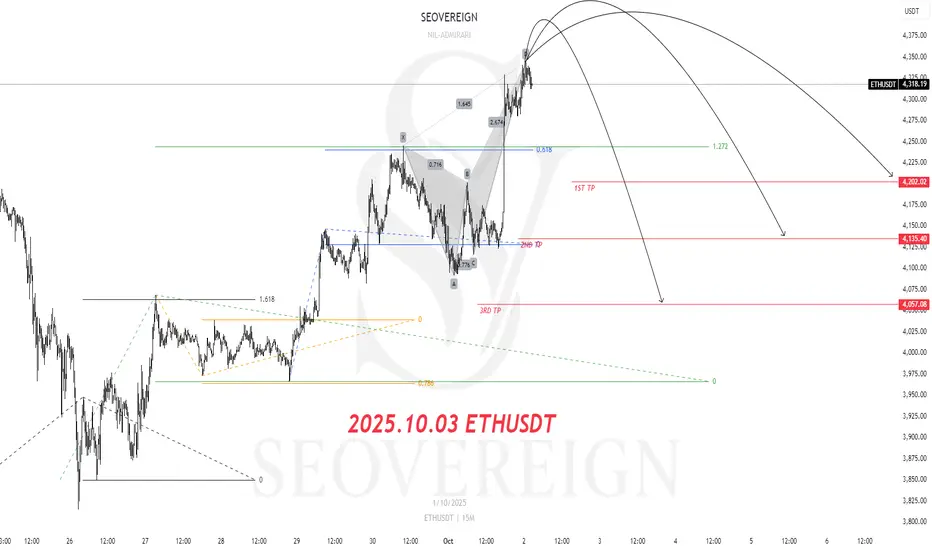
[SeoVereign] ETHUSDT BEARISH Outlook – October, 03 2025The key basis for presenting a bearish perspective in this idea is that the Crab pattern, one of the harmonic patterns, has been fully confirmed.
For clearer verification, I have directly plotted the relevant section on the chart for your reference.
For reference, the Crab pattern is an extended harmonic pattern with high volatility, typically forming point D at the 1.618 level relative to the XA wave, and is characterized by a strong reversal movement thereafter.
Due to these characteristics, it is evaluated as a highly reliable pattern within the Potential Reversal Zone (PRZ).
Accordingly, the average target price is set around 4,135.40 USDT.
Additional briefings will continue to be updated in this idea as the chart develops.