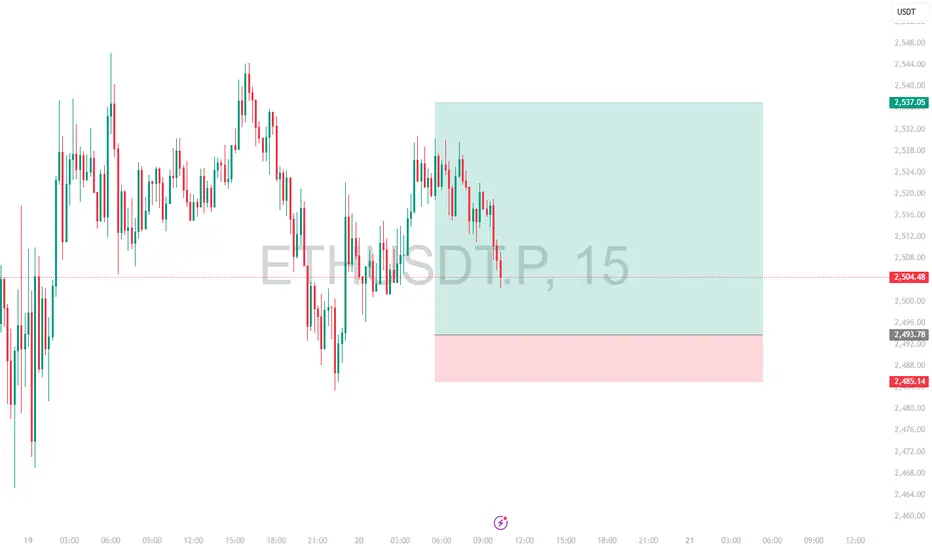
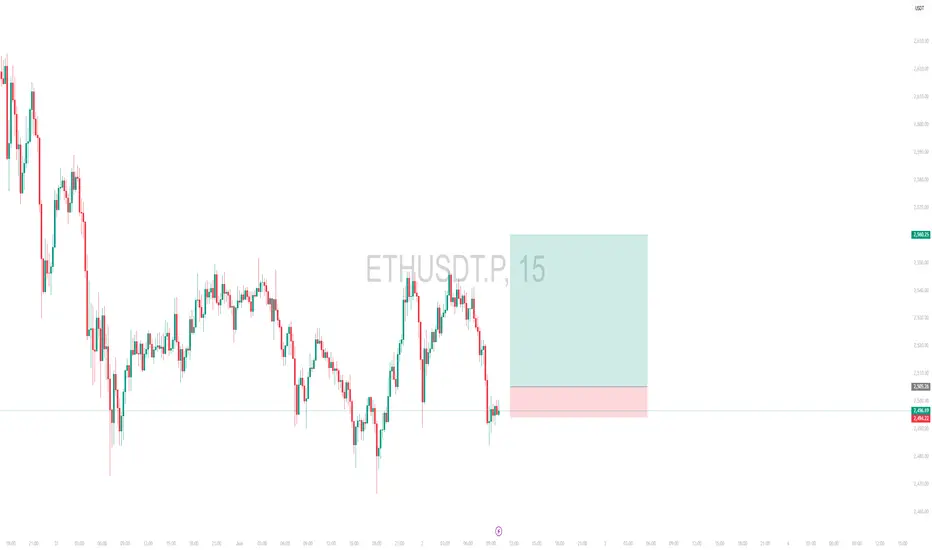
Intraday Long Setup | June 20th 2025 | Valid Until Daily ClosePrice retraced to a strong pivot zone.
Structure remains bullish with potential for continuation after pullback.
Tight risk control.
Watch for price reaction within the red zone. Entry only if confirmation appears
The setup expires at end of the daily candle close.
Trade ideas
ETH/USDT – Bearish Rejection from Resistance ZoneETH/USDT – Bearish Rejection from Resistance Zone 🚨🧱
The chart reflects a clear bearish structure for Ethereum (ETH/USDT), presenting multiple rejection signals from the resistance zone (~$2,750 - $2,850) marked by red arrows. Here's the breakdown:
🔴 Resistance Zone
Price attempted to break above this zone three times, each met with a sharp rejection.
This indicates strong seller dominance and confirms the zone as a solid supply area.
📉 Current Market Structure
After the last rejection, ETH broke below minor support, turning structure bearish.
Price is currently trading around $2,529.69, forming lower highs and lower lows – a textbook downtrend.
🟢 Support Zone Target
The price is expected to move downward toward the support zone (~$2,250 - $2,300).
The projection drawn on the chart suggests further selling pressure before any potential reversal.
📊 Conclusion
Unless ETH reclaims the resistance zone, the bearish bias remains strong. A move to the support zone looks likely in the near term, where buyers may reassess the market.
📌 Trade Note:
Resistance holds ➡️ look for short entries 📉
Support approaches ➡️ prepare for potential bounce or consolidation

"Bearish Reversal Opportunity Following Supply Zone Rejection"1. Double Top Formation (Resistance Level Identified)
The chart displays a clear double top structure at the 2,760–2,800 USDT level.
This level has acted as a strong supply zone (highlighted in red), where price previously reversed, indicating heavy selling interest.
Current price action has retested this resistance zone and shown signs of rejection.
2. Liquidity Sweeps & False Breakouts
On the left side of the chart, an aggressive downward wick (marked with a blue arrow) suggests a liquidity sweep below a key low before strong bullish momentum returned.
This type of price action indicates smart money involvement, designed to remove weak hands before pushing price higher.
3. Accumulation Phases (Sideways Consolidation)
Multiple accumulation ranges are highlighted with blue rectangles.
These ranges show horizontal consolidation, where price builds up energy before breakout.
The most recent breakout led to a vertical rally toward the resistance zone, signaling an end of the accumulation and a start of distribution.
4. Double Bottom Support Structure
Identified near the 2,480 level, marked by red circles.
This level has historically acted as demand/support, evidenced by multiple bounces from this price zone.
Now highlighted with a grey zone, it is projected to act as the next key support area.
5. Bearish Projection
A large black arrow suggests a forecasted bearish move from the current high (~2,800) back to the support zone (~2,480).
This aligns with the idea of a mean reversion or pullback after a strong bullish impulse.
---
Conclusion & Trade Idea:
🔻 Bias: Bearish (Short-term)
The chart presents a classic reversal pattern with a double top at a well-defined supply zone.
Entry could be considered after confirmation of rejection from this level.
🧠 Trade Plan Suggestion:
Entry: Short near 2,780–2,800 after bearish confirmation (e.g., bearish engulfing candle or break of structure).
Target: 2,480 (support zone).
Stop Loss: Above 2,820 (recent high).
Risk-Reward: Approximately 1:2.5 or better depending on execution.

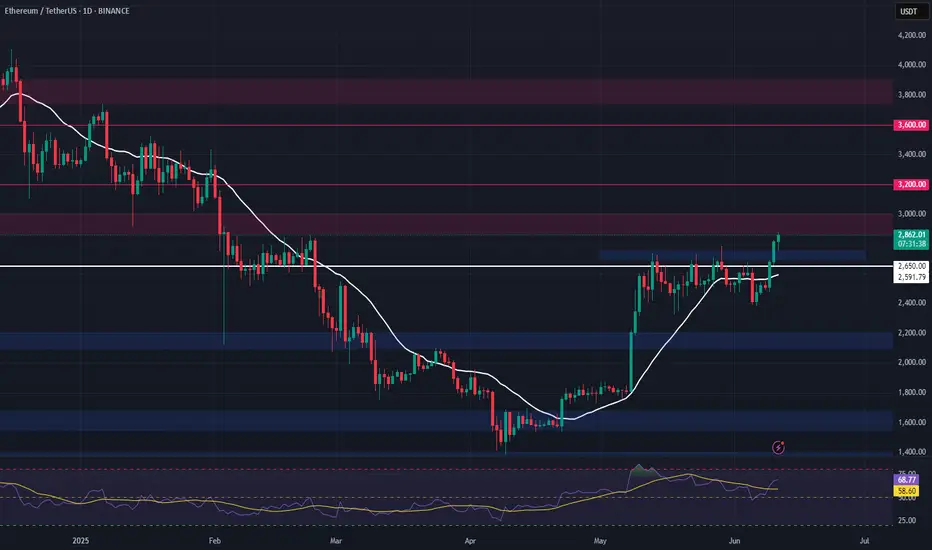
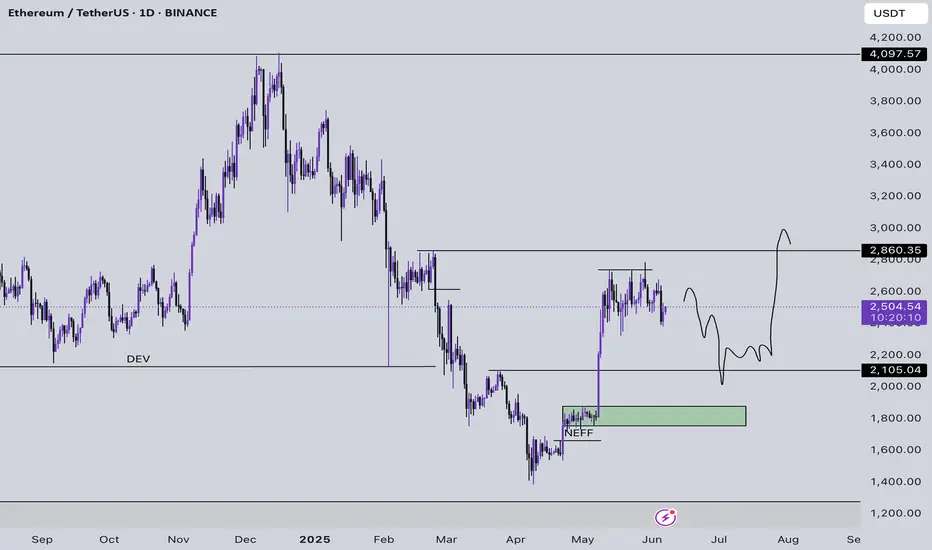
$ETH BLOODBATH: -15% Dump! Next Stop $2100? CRYPTOCAP:ETH BLOODBATH: -15% Dump! Next Stop $2100?
I shorted right from $2862 — nailed the move.
Now trading below critical $2550 support.
👉 Hold $2550? Reversal towards $3000-$4000 possible.
👉 Lose it? We likely fill $2100-$2200 FVG — 0.618 fib at $2116.
$2860 remains THE level to watch for a New ATH.
💬 Comment your ETH target!
🔁 Retweet if this helps your gameplan.

ETH Long Swing Setup – Breakout Retest of Key ResistanceETH has broken above the critical $2,750 resistance, signaling bullish momentum. We’re now watching for a retrace into the $2,700–$2,750 zone, which is expected to act as support for a continuation higher.
📌 Trade Setup:
• Entry Zone: $2,700 – $2,750
• Take Profit Targets:
o 🥇 $3,000
o 🥈 $3,200
o 🥉 $3,700
• Stop Loss: Daily close below $2,650
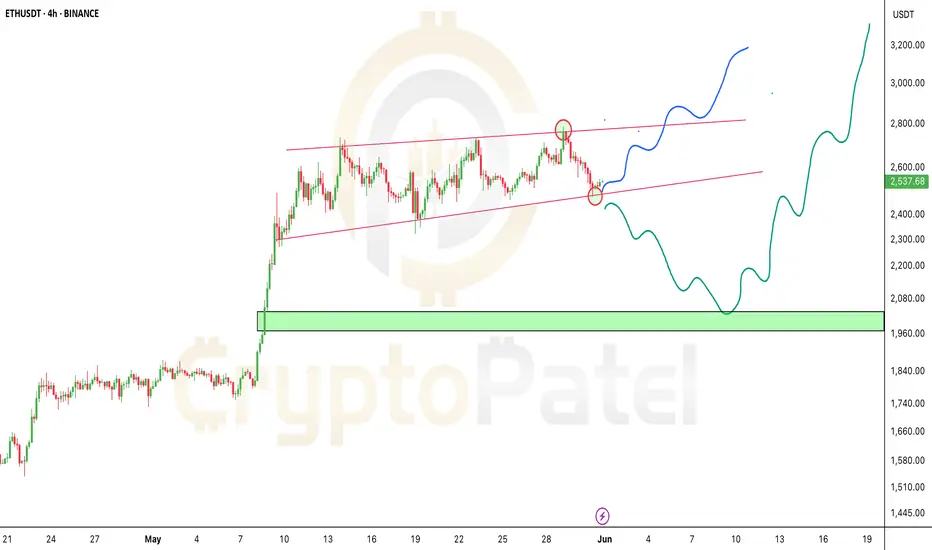
ETHEREUM Short Position Update – June 11, 2025We are the SeoVereign Trading Team.
With sharp insight and precise analysis, we regularly share trading ideas on Bitcoin and other major assets—always guided by structure, sentiment, and momentum.
🔔 Follow us to never miss a market update.
🚀 Boosts provide strong motivation and drive to the SeoVereign team.
--------------------------------------------------------------------------------------------------------
Ethereum downside perspective shared.
Recently, Ethereum has been continuously setting new highs, showing strong upward momentum. However, from a technical analysis standpoint, a breakdown below the lower trendline and an exit from a converging wedge pattern have been observed.
This suggests the potential for a short-term cooling-off phase, prompting the sharing of a bearish idea.
The first target is set at 2,771.
While Ethereum and the broader market continue to reach new highs, I personally believe a corrective phase may be approaching.
Detailed ratio analysis and further reasoning will be shared through an idea update once the first target is reached.
Flexible response according to market conditions is essential.

ETH Traders — Late Long Setup Might Be Here
We're currently inside a descending channel on the 15-minute chart. What's interesting is:
The number of touches to the channel top is significantly higher than the bottom.
In the most recent move, price reacted strongly to the midline without even touching the channel bottom — suggesting buying pressure is stepping in early.
As price moved back toward the top of the channel, volume increased, which is a bullish sign.
This could be a good late-entry long setup for those who missed the earlier Bitcoin move.
I’m not discussing shorts — this is a bullish market, and I'm not fighting the trend.
No need to overcomplicate it. Let price speak.
📌 If you want a breakdown of another coin, just drop it in the comments.
⚠️ Without proper risk management, you're just a ticking time bomb.

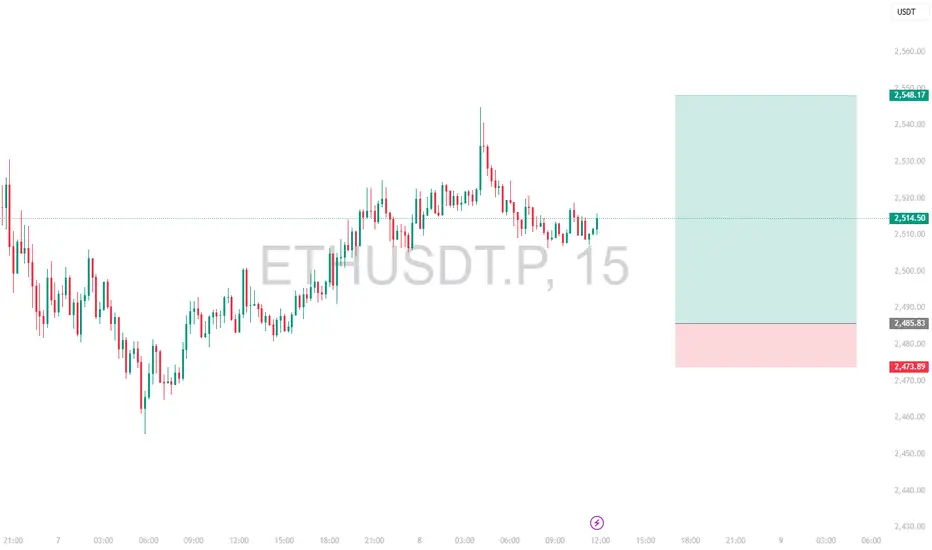
Intraday Long Setup | June 9th 2025 | Valid Until Daily ClosePrice is retracing to a strong pivot zone.
Structure remains bullish with potential for continuation after pullback.
Tight risk control.
Watch for price reaction within the red zone. Entry only if confirmation appears
The setup expires at end of the daily candle close.
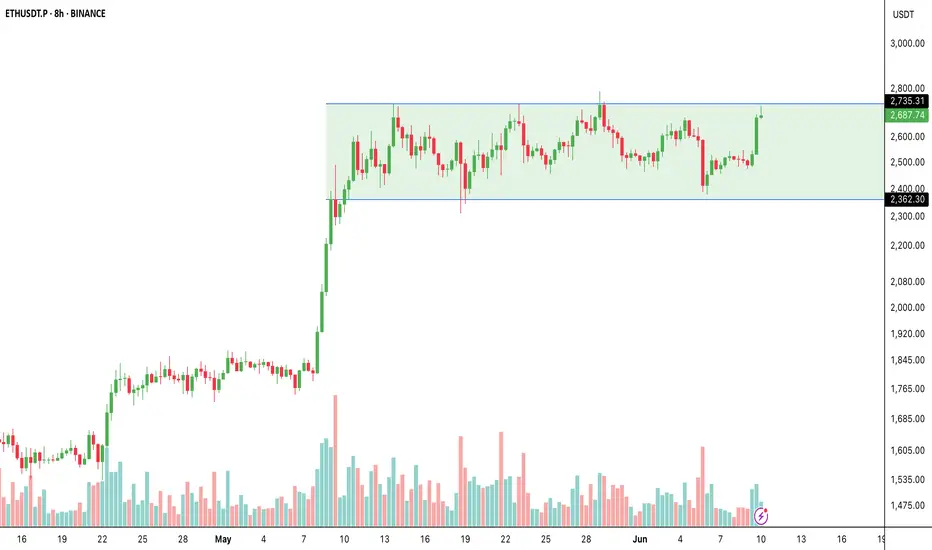
Ethereum Breakout Imminent?🚨 Ethereum Breakout Imminent?
CRYPTOCAP:ETH has been trading in a wide range:
👉 Support: ~$2,362
👉 Resistance: ~$2,735
Now ETH is once again testing this critical resistance zone with higher lows and rising volume — a classic breakout setup in play.
What to watch:
✅ Break & close above $2,735 → $2,800 → $2,900 → $3K
❌ Rejection → back to $2,400–$2,500 range.
Summary:
Ethereum is building momentum → next move could be explosive.
Will it break out or rotate? Stay sharp!
NFA & DYOR
Ethereum: Bull FlagCurrently moving in this range and forming a bull flag. On breakout can eye for target $3500. DYOR, NFA.
Disclaimer: I'm not a trading expert.

Intraday Long Setup | June 8th 2025 | Valid Until Daily ClosePrice is retracing to a strong pivot zone (marked by the red box).
Structure remains bullish with potential for continuation after pullback.
The green box represents a high-probability long opportunity with tight risk control.
Watch for price reaction within the red zone. Entry only if confirmation (e.g., bullish engulfing, strong wick rejections) appears.
The setup expires at end of the daily candle close.
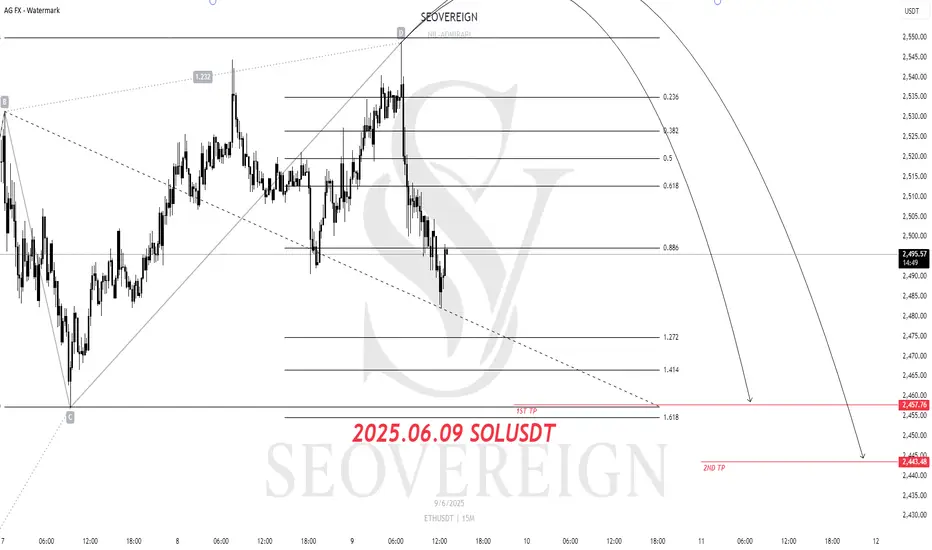
ETHEREUM Short Position Update – June 9, 2025We are the SeoVereign Trading Team.
With sharp insight and precise analysis, we regularly share trading ideas on Bitcoin and other major assets—always guided by structure, sentiment, and momentum.
🔔 Follow us to never miss a market update.
--------------------------------------------------------------------------------------------------------
Ethereum (ETH) Short Position Strategy
Position Basis: Technical reversal signal based on the ABCD
1st Target: 2.45
Analysis Summary:
Currently, ETH has entered the completion zone of the ABCD pattern, one of the harmonic patterns, suggesting a potential price reversal. This pattern provides a technical basis for a short entry along with an overbought signal at the top.
The targets are set as support zones that the downward wave may reach after the pattern completion, and a partial take-profit strategy may be effective depending on market conditions. Thorough risk management and setting a stop-loss are crucial to prevent pattern invalidation.
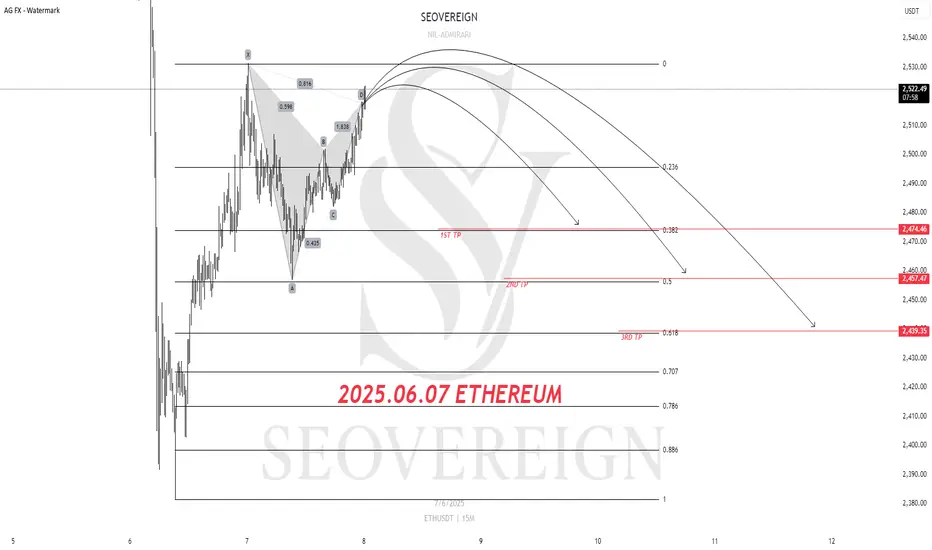
Ethereum Short Position Update – June 7, 2025We are the SeoVereign Trading Team.
With sharp insight and precise analysis, we regularly share trading ideas on Bitcoin and other major assets—always guided by structure, sentiment, and momentum.
🔔 Follow us to never miss a market update.
--------------------------------------------------------------------------------------------------------
Ethereum Short Position Share
Currently, Ethereum is approaching the completion zone of a Gartley pattern.
The Gartley pattern is one of the traditional corrective patterns and often acts as an important price reversal point.
In this pattern, the price is showing resistance near the high and signaling a reversal, indicating a high possibility of a shift into a short-term corrective phase.
Accordingly, a short position is considered with the first target set at $2,476.
This area corresponds to a previous support level and the pattern target, making it a technically significant selling target zone.
It is important to monitor market conditions and volume trends while managing risk simultaneously.
Ethereum Bull Run Analysis Here's the latest on Ethereum:
- Current price is $2,506
- There's been a surge in institutional interest, driving huge demand for ETH ETFs
- Asset managers like BlackRock and Fidelity have been buying Ethereum continuously while selling off BTC ETFs, resulting in record-high inflows
- This type of inflow is typically seen before Ethereum takes off and enters a parabolic phase
- Technically, it all depends on how USDT D and BTC D perform; they both need to drop significantly for money to rotate within the markets
- I still think Ethereum can easily revisit $2,100 before breaking out, which should signal the top for USDT D, ultimately leading to Ethereum outperforming and a 50% move from there.
- Accumulation Zones for ETH: 1700-1890$, 2000-2120$
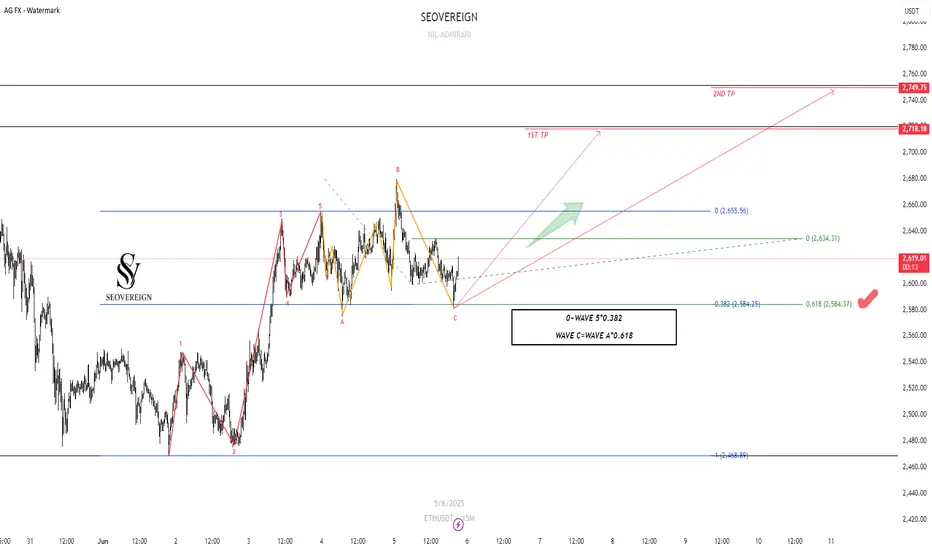
Ethereum Long Setup – Chart Analysis (June 5, 2025)We are the SeoVereign Trading Team.
With sharp insight and precise analysis, we regularly share trading ideas on Bitcoin and other major assets—always guided by structure, sentiment, and momentum.
🔔 Follow us to never miss a market update.
--------------------------------------------------------------------------------------------------------
Here is a technical analysis of Ethereum.
The current wave structure is considered to be in the final stage of a corrective wave, with the following evidence based on length ratios.
First, the 5th wave of wave C forms a length that is 0.618 times that of waves 0 to 3.
Second, the fact that wave C ended at the 0.382 Fibonacci retracement level of waves 1 to 5 increases the possibility of technical support.
As these conditions are met, the current zone is considered a valid buying point for entering a long position.
Target Prices
1st target: 2,700
2nd target: 2,750
This zone overlaps with past resistance and technical retracement ratios, making it appropriate as a short-term liquidation zone.
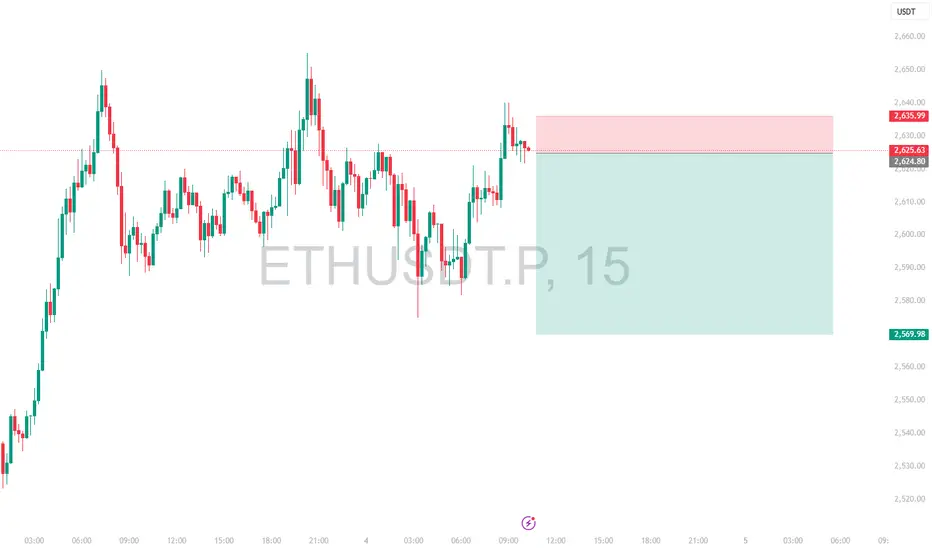
Intraday Short Setup | June 4th 2025 | Valid Until Daily ClosePrice has pushed into a potential intraday Pivot supply zone (red box) where sellers may step in. This trade is based on the expectation of a rejection from this area.
Entry: Red box — a short entry zone aligned with overhead supply
Stop Loss: Above the red zone (invalidates the setup)
Target: Green box — area to consider partial/full exit based on momentum
ETHUSDT has shown a strong bounce but is now approaching a key pivotal resistance zone
Risk-reward is favorable with a tight invalidation and clean downside target
Price may stall or reverse near the red box, creating short opportunity
Note:
This is an intraday trade idea that expires at 00:00 UTC (Daily Candle Close). Re-evaluate the setup if price remains indecisive near the entry zone close to that time.
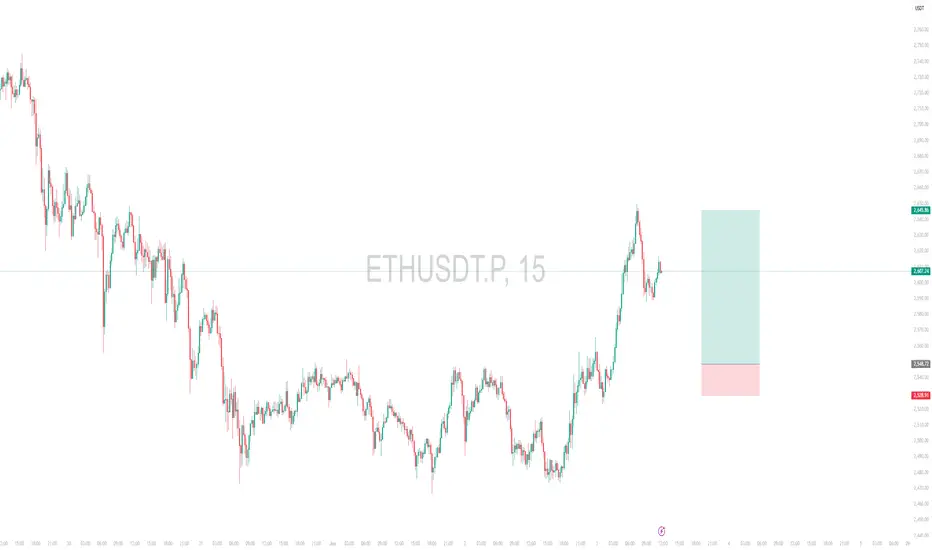
Intraday Long Setup | June 4th 2025 | Valid Until Daily ClosePrice is retracing to a strong pivot zone (marked by the red box).
Structure remains bullish with potential for continuation after pullback.
The green box represents a high-probability long opportunity with tight risk control.
Watch for price reaction within the red zone. Entry only if confirmation (e.g., bullish engulfing, strong wick rejections) appears.
The setup expires at end of the daily candle close.

Intraday Long Setup | June 3rd 2025 | Valid Until Daily ClosePrice is retracing to a strong pivot zone (marked by the red box).
Structure remains bullish with potential for continuation after pullback.
The green box represents a high-probability long opportunity with tight risk control.
Watch for price reaction within the red zone. Entry only if confirmation (e.g., bullish engulfing, strong wick rejections) appears.
The setup expires at end of the daily candle close.
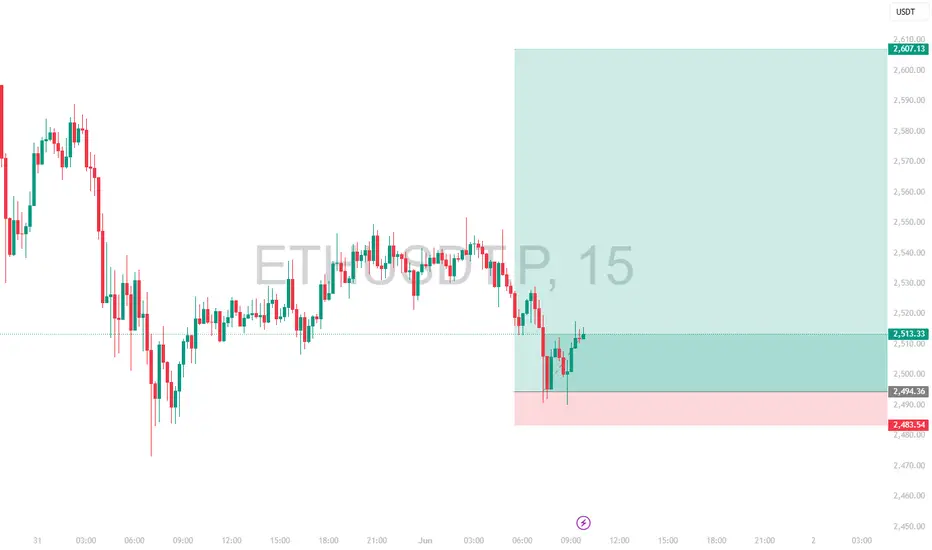
Intraday Long Setup | June 2nd 2025 | Valid Until Daily ClosePrice is retracing to a strong pivot zone (marked by the red box).
Structure remains bullish with potential for continuation after pullback.
The green box represents a high-probability long opportunity with tight risk control.
Watch for price reaction within the red zone. Entry only if confirmation (e.g., bullish engulfing, strong wick rejections) appears.
The setup expires at end of the daily candle close.
Intraday Long Setup | June 1st 2025 | Valid Until Daily ClosePrice is retracing to a strong pivot zone (marked by the red box).
Structure remains bullish with potential for continuation after pullback.
The green box represents a high-probability long opportunity with tight risk control.
Watch for price reaction within the red zone. Entry only if confirmation (e.g., bullish engulfing, strong wick rejections) appears.
The setup expires at end of the daily candle close.
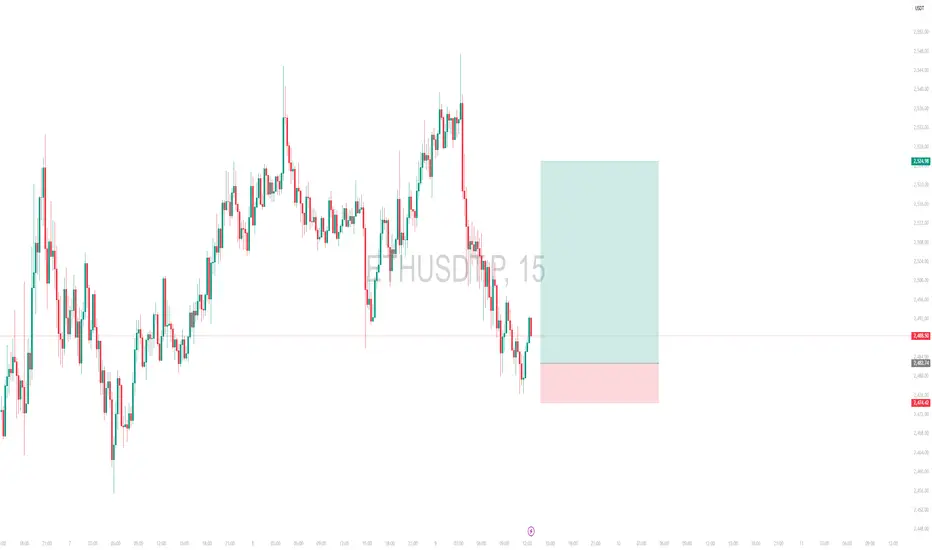
They saw a breakdown. I saw entry precision.ETH just did what it always does before a shift — it delivered into value.
Price rejected from 2,550 cleanly, took out weak buyers, and revisited the same HVN where prior accumulation began. That wasn’t a breakdown — it was completion.
I’m looking at the 2,488.11 zone — right at the 0.786 retracement — as the launchpad. It aligns with a low-volume tail, creating the exact imbalance Smart Money uses to reprice.
Above, I’m watching for a reversion to the mean at 2,511.9 (0.5), followed by a reaction at 2,532 — the last inefficient node before the supply wall at 2,550 gets filled again.
If we break through 2,550 clean, this becomes a much larger redistribution leg. But we trade it one delivery at a time.
Execution setup:
🎯 Entry: 2,488.11–2,474.0
🔑 Target 1: 2,511.9
🎯 Target 2: 2,550
❌ Invalidation: 2,474.0 clean break and continuation — wait for new structure
Nothing about this setup was noisy.
Just price completing its job.
I don’t chase the move. I meet it where it begins.

Ethereum Breakout UpdateETHEREUM AT A BREAKOUT POINT
CRYPTOCAP:ETH is sitting right on its key trendline support. What happens next could be BIG!
🔵 If support holds → $3,000+ is coming!
🔻 If it breaks → ETH could dip to $2,000 before the next pump!
This is the moment where patience meets opportunity.
Don’t chase — wait for the move and ride the wave!
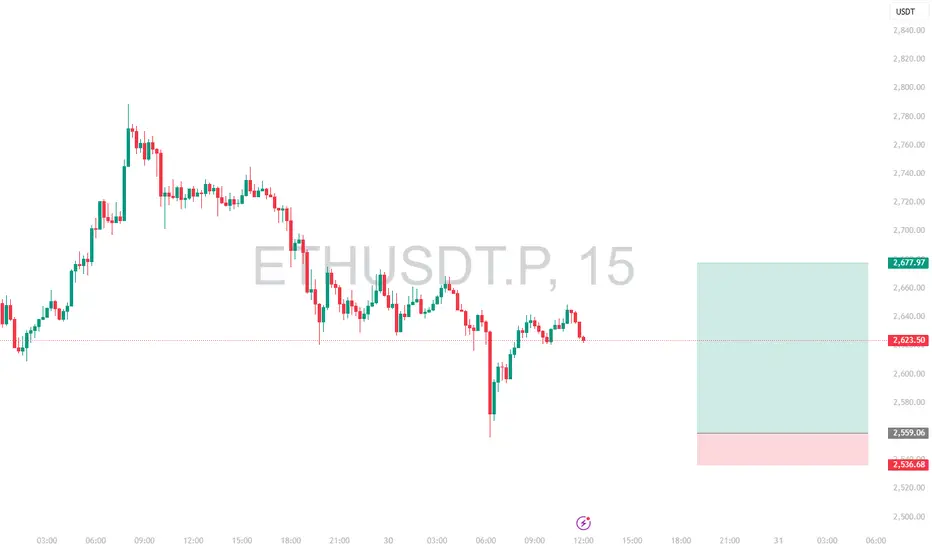
Intraday Long Setup | May 30th 2025 | Valid Until Daily ClosePrice is retracing to a strong pivot zone (marked by the red box).
Structure remains bullish with potential for continuation after pullback.
The green box represents a high-probability long opportunity with tight risk control.
Watch for price reaction within the red zone. Entry only if confirmation (e.g., bullish engulfing, strong wick rejections) appears.
The setup expires at end of the daily candle close.