ETH plan 1/9/2025 LTFTrading Plan for ETH
Primary Scenario (Red Path)
Expect a pullback toward the 4,000 level, forming a potential bottom structure.
Alternate Scenario (Blue Path)
If price breaks below 4,000, watch for deeper retracement toward the FVG HTF (~3,800) or even the Demand zone (~3,400). This area may off

Long viewI am going long from here for the target of 5000 As per three drive pattern.
It also touched the 4hr orderblock and getting rejection too.
If everthing goes good this trade would be amazing 😍
Trade as per your risk management.
Thak you .

ETH Long🔎 Chart Breakdown:
1. Trendline Support (Orange Line)
• You’ve drawn an ascending trendline starting from Aug 26.
• Price just touched and bounced from this trendline around $4,490, showing it’s acting as a dynamic support.
2. EMA Indicators (15 & 35)
• Blue = EMA 15
• Yellow = EMA 35
• Curre

ETH BULLISHETHUSD formed bullish flag pattern
break the last HH and print new HH
GOOD BUYING AREA 4420 for the target 5400

Eth resistance break buy , trend line break sell . Resistance level break out buy entry plan
. trend line break out sell entry plan

Eth trend line break out entry plan. Fvg rejection
. resistance line rejection
. trend line break out entry plan

Ethereum 21-Aug-2025 PredictionAs Shown in the chart, the box at the bottom was the level to be tested and the swing should change from here onwards. Target would be the Box on the Top of the Chart. Positive for a 150 point move.

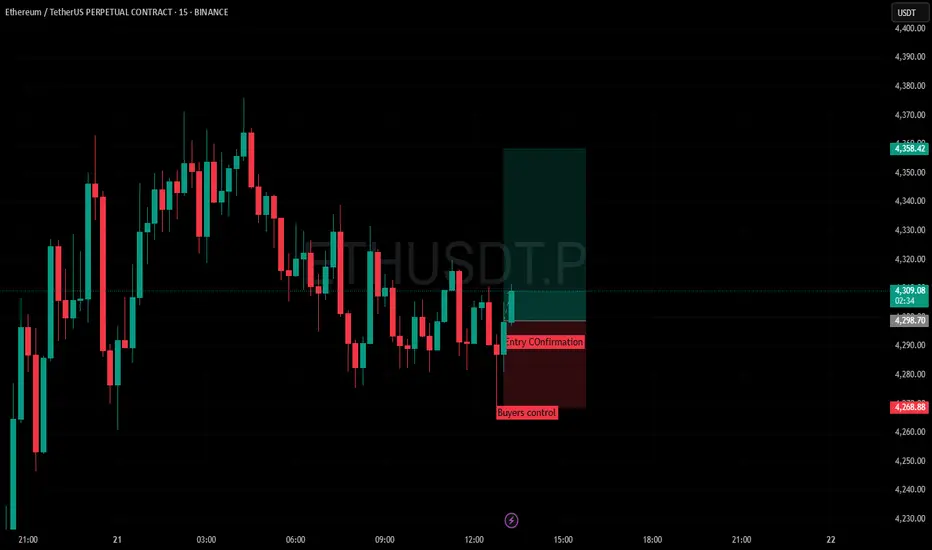
Simple Candlestick pattern Long tradeSimply wait for Buyers control and wait for confirmation candle that gives you volume and strength then entry and target for 1:2
ETH on the road to $10,000? Let’s break it down🔥 ETH on the road to $10,000? Let’s break it down 👇
Here’s why ETH looks stronger than ever:
1️⃣ Big Money Flowing In
🔹 ETFs & public companies bought 4.4M ETH ($20B) this quarter.
🔹 Whales & Web3 firms added another 2M ETH.
🔹 That’s more than 5% of total supply absorbed in just months.
2️⃣ Recor

Breakout in ETHEREUMA Big Breakout has happened in Ethereum in weekly time frame.
The Coin shoul be holded for months to achieve its final target.
As price has reached all time high which is its first target.
Rest two targets are 7400 and 7700.
No SL should be placed as the coin should be acquired on holding basis.

See all ideas
Summarizing what the indicators are suggesting.
Oscillators
Neutral
SellBuy
Strong sellStrong buy
Strong sellSellNeutralBuyStrong buy
Oscillators
Neutral
SellBuy
Strong sellStrong buy
Strong sellSellNeutralBuyStrong buy
Summary
Neutral
SellBuy
Strong sellStrong buy
Strong sellSellNeutralBuyStrong buy
Summary
Neutral
SellBuy
Strong sellStrong buy
Strong sellSellNeutralBuyStrong buy
Summary
Neutral
SellBuy
Strong sellStrong buy
Strong sellSellNeutralBuyStrong buy
Moving Averages
Neutral
SellBuy
Strong sellStrong buy
Strong sellSellNeutralBuyStrong buy
Moving Averages
Neutral
SellBuy
Strong sellStrong buy
Strong sellSellNeutralBuyStrong buy
Displays a symbol's price movements over previous years to identify recurring trends.