Ethereum – Elliott Wave Analysis (Weekly Chart)
#Phase 1:
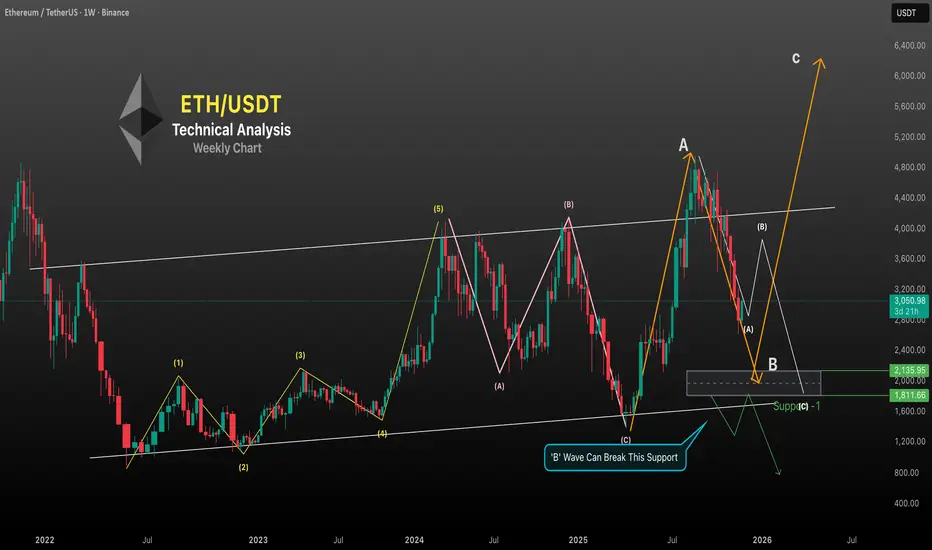
Impulse Wave (1–5) Completed
ETH completed a 5-wave impulsive structure from the 2022 lows to the 2024 top:
Wave (1) – Initial reversal from the bear market bottom
Wave (2) – Deep corrective pullback
Wave (3) – Strong expansion wave (typically the largest, as shown here)
Wave (4) – Sideways consolidation within the channel
Wave (5) – Final push into the upper resistance of the long-term channel
This 5-wave structure completed near the $4,093 region.
#Phase 2:
ABC Corrective Pattern Playing Out
After the 5-wave completion, ETH entered a large ABC correction:
(A) Wave
A sharp drop from the top, marking the start of correction.
(B) Wave
A lower-high retracement that couldn’t break above the multi-year channel resistance — classic sign of a corrective rally.
(C) Wave
This wave completed near the lower boundary of the long-term channel (shown on your chart), fulfilling the ABC structure.
#Phase 3:
New Cycle – Larger ABC Structure Forming
After completing the previous ABC cycle, ETH started a new higher-degree correction:
Wave A (up)
A strong rally to ~4,956 created the larger-degree Wave A.
Wave B (current)
Price is now declining in a steep Wave B structure.
Your highlighted grey demand zone ($1,800–$2,200) is the most likely B-wave target.
Notes Must Read
B-waves often break support briefly, creating a sentiment trap
#Phase 4:
Wave C – The Big Expansion (2026?)
After Wave B finishes inside $1,800–$2,200, ETH is likely to start a massive Wave C.
Wave C is typically:
Impulsive
Equal to Wave A or 1.618× Wave A
Target 🎯 $6,000 – $6,400 region
This matches the Elliott Wave rule where Wave C often extends strongly after a deep B-wave.
~Disclaimer~
High Risk Investment
Trading or investing in assets like crypto, equity, or commodities carries high risk and may not suit all investors.
Analysis on this channel uses recent technical data and market sentiment from web sources for informational and educational purposes only, not financial advice. Trading involves high risks, and past performance does not guarantee future results. Always conduct your own research or consult a SEBI-registered advisor before investing or trading.
This channel, Render With Me, is not responsible for any financial loss arising directly or indirectly from using or relying on this information.
Trade ideas
ETH Could Skyrocket to $7.8K After FUSAKA Upgrade: History ShowsCRYPTOCAP:ETH Could Skyrocket to $7.8K After FUSAKA Upgrade – History Shows
The last Ethereum Pectra Upgrade on 7 May 2025 triggered a massive move:
✅ +55% in 35 days
✅ +168% in 109 days
What’s next?
The FUSAKA Upgrade is scheduled for 3 December 2025. If history repeats:
👉 Target 35 days post-upgrade: $4,500 (7 Jan 2026)
👉 Target 109 days post-upgrade: $7,800 (22 Mar 2026)
Note: This is Purely Fractal Analysis Based on Pectra. Always DYOR – Markets can behave differently, and “Sell the News” Scenarios Happen.
Get ready for a potential ETHEREUM rally!
NFA & DYOR

Long is just begging to be on ETHUSDTA good support zone has formed a 4-hour imbalance, which could lead to a good buyback on a higher high. There hasn't been a breakdown in the structure (yet), so overall, it's worth a try.

CRYPTO LONG 25/11/2025We are in a H4 FVG, price is in a bullish orderflow,
I am looking for buys but not entered yet. I'm waiting for the current H4 candle to close and the next H4 candle to cause smt b/w eth,btc or total3, if this happens I will look for a 2R trade on the m15 TF.
Patience is the key. Do your own research.
Keep Winning! 👊👊👊

ETHUSDT LONGS 17/11/2025ETHUSDT is in a weekly FVG, and has caused SMT on weekly tume frame. We can also see it has taken out the sellside liquidity before forming 2 strong bullish upclose candle on H4, closing over the candle that ran out the lows. I have entered in a swing setup for 2 Rs

eth weekly trade for long term /swing tradeI have mentioned everthing in chart first target wil be from bottom to mid and then mid to top if it's starting halting and making position in lower time frames.

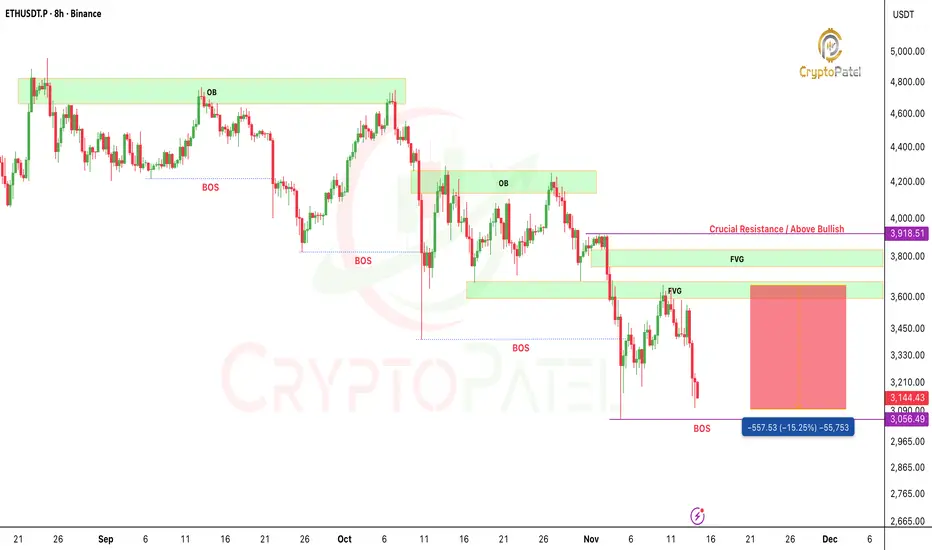
ETHEREUM Bearish Target achieved CRYPTOCAP:ETH has tapped the $3150–$3110 zone, a clean 15% move from our premium setup.
Perfect FVG fill + redistribution structure.
Huge profits for those who executed. Liquidity continues to lead.
NFA & DYOR
Indian Derivative Secrets1. The First Secret: India is a Market Dominated by Options, Not Futures
One of the biggest secrets that new traders miss is that India’s derivatives segment is overwhelmingly options-driven. More than 95% of the total derivatives turnover comes from options.
This creates unique behavior:
Market often moves to kill option premiums → popularly called premium eating market.
Expiry days show violent moves, as both buyers and sellers fight for option decay or reward.
Weekly expiries for Nifty, Bank Nifty, and FinNifty create short-term trend cycles.
The real secret:
Options sellers (institutions, prop desks) control the market more than options buyers (retail).
Because sellers have deep pockets and margin power, they dictate pricing through:
Heavy shorting on OTM strikes
Creating artificial range-bound movements
Sudden IV crushes after major events
Pinning the market to certain levels on expiry
2. The Second Secret: Open Interest (OI) is a Map of Smart Money
Retail traders look at price; professional traders look at Open Interest.
Key principles:
1. Rising OI + Rising Price → Long Build-up
Indicates accumulation; institutions betting on upward trend.
2. Falling OI + Rising Price → Short Covering
Often triggers sharp intraday rallies.
3. Rising OI + Falling Price → Short Build-up
A strong bearish signal.
4. Falling OI + Falling Price → Long Unwinding
Leads to slow downward drift.
But the deeper secret is this:
Option OI is used to trap retail traders.
Example:
If 20 lakh OI sits at Nifty 22500 CE, it creates a wall of resistance.
If suddenly the OI reduces, it means sellers are scared → breakout incoming.
If OI spikes massively, sellers are confident → reversal incoming.
Professionals track:
Change in OI in last 5 minutes
OI shifting to higher or lower strikes
OI unwinding during big candles
These help predict short-term market moves before they show on charts.
3. The Third Secret: India’s Market is Driven by Event Volatility
Unlike global markets, Indian derivatives see unique event-driven volatility cycles:
1. RBI Policy Days
Bank Nifty’s biggest moves occur here.
IV spikes → option prices increase.
2. Budget Day
High volatility, large swings, unpredictable behavior.
3. Election Results
Massive IV spikes that crush instantly post-event.
4. US Fed Days
Indian markets react sharply the next morning.
The secret?
Option sellers thrive before the event; option buyers thrive after.
The trick is to identify IV patterns:
Before events → IV increases → selling straddles/strangles becomes risky.
After events → IV crashes → buyers lose premium but directional traders profit.
4. The Fourth Secret: FIIs Don’t Control the Market Daily — The Myth
Many retail traders assume FIIs (Foreign Institutional Investors) drive daily trends. This is not true anymore.
The secret:
Proprietary trading firms (prop desks) influence intraday to medium-term moves more than FIIs.
FIIs provide long-term liquidity, but prop firms dominate:
Day trading
Spread strategies
Gamma scalping
Weekly expiry management
Arbitrage between indices
The “intraday direction” is mostly shaped by:
Prop firms (Indian)
High-frequency trading algorithms (HFT)
Market-making firms
5. The Fifth Secret: Option Pain Theory (Max Pain) Actually Works in India
“Max Pain” is the level where the maximum number of option buyers lose money.
In India’s weekly expiry system, this theory becomes extremely powerful.
Institutions try to move the price toward max pain.
Example:
If Nifty’s max pain is at 22400
And current price is 22580
Expect slow grinding downward movement on expiry.
Why?
Because sellers want to make maximum profit from premium decay.
Max pain is not 100% accurate, but works exceptionally well:
In range-bound markets
On expiry days
When OI build-up is clean
6. The Sixth Secret: Market Makers Control Intraday Volatility
A little-known fact:
India’s intraday volatility is heavily influenced by market makers who adjust hedges every second.
They use:
Delta hedging
Gamma scalping
Vega exposure reduction
Arbitrage between futures and options
Calendar spreads
This creates sudden:
Wicks
Fake breakouts
Violent reversals
Stop-loss hunting
Retail often blames “operators”, but the real cause is market-making algorithms.
7. The Seventh Secret: Expiry Day Moves Follow a Predictable Pattern
Every Thursday (and Tuesday/Friday for other indices), the market behaves differently.
9:15–11:30 AM
Range bound → sellers dominate.
11:30–1:30 PM
Small directional move, often fake.
1:30–3:00 PM
True move begins after OI shift.
3:00–3:20 PM
Massive expiry manipulation.
Expiry tricks:
Add huge OI at far OTM strikes → trap buyers
Shift support/resistance rapidly
Trigger SLs of retailers who go long or short
The secret strategy that institutions use:
Selling ATM straddles and hedging using futures or deep OTM options.
8. The Eighth Secret: Price Moves After Retail Stops Getting Trapped
Retail trader behavior is extremely predictable:
They buy options after big candles
They short after breakdowns
They panic during retracements
They buy tops and sell bottoms
Institutions use this to create traps:
Bull Trap
Breakout → triggers retail longs → market reverses.
Bear Trap
Breakdown → triggers retail shorts → market reverses.
The secret is to analyze:
Long/short buildup data
OI spikes near key levels
Market structure on 5-minute charts
9. The Ninth Secret: Volume Profile + OI = Institutional Footprint
The biggest secret weapon in derivatives trading is combining volume with OI.
1. High Volume + High OI → Strong Institutional Position
Expect a trend continuation.
2. High Volume + OI Unwinding → Trend Reversal
Institutions are exiting.
3. Low Volume + High OI → Trap Zone
Retail buyers are trapped; avoid entries.
Conclusion
Indian derivatives trading is not random — it follows the logic, psychology, and positioning of big players, OI structure, volatility cycles, and institutional strategies. The key secrets revolve around understanding who controls the market, how OI shapes price, how algorithms influence intraday volatility, and how weekly expiries create predictable traps and opportunities.
If you master these hidden mechanisms, derivatives trading transforms from gambling into a strategic and probability-driven game.

ETHUSDT/BTCUSDT Short idea 11/11/2025Wassup Lads!
This looks like a very enticing short setup simply because
1. Price in a daily bearish fair value gap
2. We have SMT Divergence between BTC and ETH on the daily time frame
Switching over to the H1 time frame I'm clearly seeing price print out a bearish orderflow, I have not yet entered but will look to enter a sell postion on retracement to the H1 Bearish fair value gap, targeting a basic 1 to 2 risk to reward ratio. So basically, if price retraces to the h1 bearish fair value gap I'll look for shorts or I'm happy waiting on the sidelines for a new setup.
As always -
1. Manage your risk
2. Stay disciplined
3. Do your own research
One wrong trade can spoil months of discipline
Keep winning!!

Sub-Brokers in India1. Who is a Sub-Broker?
A sub-broker is an intermediary who acts as a bridge between investors and stockbrokers. In simple terms, a sub-broker is an agent or franchise partner who does not directly trade on the stock exchanges but helps investors carry out their trades through a registered stockbroker.
Earlier, sub-brokers were required to register with SEBI under the SEBI (Stock Brokers and Sub-Brokers) Regulations, 1992. However, after 2018, SEBI discontinued the direct registration of new sub-brokers, shifting the model toward Authorised Persons (APs) under the exchange’s regulations (like NSE or BSE). Thus, in the current system, the term sub-broker and authorised person are used interchangeably, although “sub-broker” still exists in market terminology.
2. Evolution of Sub-Brokers in India
In the early 1990s and 2000s, the Indian capital market was dominated by physical trading and traditional brokerage houses. Investors from smaller towns had limited access to stock exchanges located in metros like Mumbai or Delhi. Sub-brokers emerged as local representatives of big brokers, offering access to markets through personalized services.
With the introduction of dematerialization, online trading, and discount brokerages, the ecosystem began to shift. Full-service brokers started expanding their presence through sub-broker networks and franchisees. After SEBI’s 2018 circular, the registration and regulatory structure changed, giving rise to the Authorised Person (AP) model, which simplified processes and brought all sub-brokers under the supervision of exchanges rather than SEBI.
Today, sub-brokers continue to play a vital role in financial inclusion, especially in tier-2 and tier-3 cities, where personal trust and relationships drive investment decisions.
3. Role and Responsibilities of Sub-Brokers
Sub-brokers perform several important functions that help the stock market ecosystem grow smoothly. Their main responsibilities include:
Client Acquisition and Relationship Management:
They identify and onboard new investors, explaining investment opportunities and helping clients open trading and demat accounts through their affiliated brokers.
Advisory Services:
Many sub-brokers provide personalized advisory support—guiding clients about market trends, suitable investment products, and portfolio diversification (though only SEBI-registered advisors can offer paid advice).
Trade Execution Assistance:
They help clients place buy/sell orders, manage trade confirmations, and ensure smooth execution through the broker’s platform.
Documentation and Compliance:
Sub-brokers assist in completing KYC (Know Your Customer) documentation and ensure compliance with SEBI and exchange rules.
After-Sales Service:
They support clients with margin updates, account statements, payout requests, and grievance redressal.
In short, sub-brokers act as the local face of big brokerage firms, ensuring last-mile connectivity and personal service to clients.
4. The Regulatory Framework
The SEBI (Stock Brokers and Sub-Brokers) Regulations, 1992 originally governed sub-broker activities. However, with changing market dynamics, SEBI simplified the process by amending the regulations.
Key milestones include:
1992: Sub-broker registration made mandatory under SEBI rules.
2018: SEBI discontinued new registrations of sub-brokers and replaced them with the Authorised Person (AP) model.
Current Framework:
A sub-broker (now AP) must be affiliated with a SEBI-registered stockbroker (member of NSE, BSE, or MCX).
The stock exchange maintains records and ensures due diligence before approving an AP.
Sub-brokers must follow all rules regarding client onboarding, KYC, and grievance handling.
Thus, while the term “sub-broker” still exists informally, all new participants are registered under the AP structure.
5. How to Become a Sub-Broker or Authorised Person
To become a sub-broker (or AP) in India, the following steps are generally followed:
Select a Broker Partner:
Choose a SEBI-registered brokerage firm like Angel One, ICICI Direct, Zerodha, Sharekhan, or Motilal Oswal that offers franchise or AP programs.
Application Process:
Submit an application to the broker and respective stock exchange with necessary documents (identity proof, educational qualification, business address, etc.).
Documentation:
The documents required typically include:
PAN and Aadhaar Card
Proof of business premises
Educational certificates (minimum 10+2)
Bank statement and canceled cheque
Photograph and signature
Exchange Approval:
The broker forwards the application to the exchange (e.g., NSE or BSE) for approval. Once approved, the applicant becomes an authorised person and can start operations.
Franchise Agreement:
A business agreement is signed between the broker and the sub-broker/AP defining revenue sharing, rights, and responsibilities.
6. Revenue Model of Sub-Brokers
Sub-brokers earn income mainly through revenue sharing with the main broker. The structure varies depending on the broker, product type, and business volume.
Common revenue models include:
Commission Sharing:
The sub-broker earns a fixed percentage of the brokerage generated by clients introduced by them. The typical sharing ratio is 60:40 to 80:20 (in favor of the sub-broker).
Referral Income:
For clients referred to digital brokers, sub-brokers may earn a one-time onboarding incentive or small lifetime brokerage sharing.
Additional Incentives:
Some brokers offer performance bonuses, marketing support, or rebates for reaching trading volume targets.
Thus, income potential depends on the sub-broker’s client base, service quality, and regional presence.
7. Advantages of Being a Sub-Broker
Low Investment, High Potential:
Unlike starting a full-fledged brokerage, becoming a sub-broker requires limited capital investment.
Established Brand Support:
Working with reputed brokers allows sub-brokers to leverage brand trust and advanced technology platforms.
Wide Product Range:
Sub-brokers can offer clients access to equities, derivatives, commodities, mutual funds, and IPOs under one platform.
Recurring Income:
Since brokerage is earned on every transaction, sub-brokers enjoy recurring revenue as long as clients remain active.
Local Market Expansion:
Sub-brokers act as key drivers of financial inclusion, helping investors from smaller cities participate in markets confidently.
8. Challenges Faced by Sub-Brokers
Despite opportunities, sub-brokers face several challenges in the modern trading environment:
Digital Disruption:
Discount brokers like Zerodha and Groww have reduced brokerage fees drastically, impacting commission-based income.
Regulatory Compliance:
Sub-brokers must stay updated with frequent SEBI and exchange rule changes.
Client Retention:
With the rise of online self-trading, retaining clients through personalized service has become more critical.
Competition:
Thousands of sub-brokers and financial distributors operate in the same localities, making differentiation difficult.
Nevertheless, many sub-brokers are adapting by embracing digital tools, offering hybrid advisory models, and focusing on long-term wealth management.
9. Future of Sub-Brokers in India
The sub-broker system is not disappearing—it is evolving. The Authorised Person model, combined with digital franchise frameworks, is making sub-brokerage more transparent, scalable, and technology-driven.
In the coming years, the focus will shift toward:
Digital client acquisition and onboarding
AI-driven advisory and analytics tools
Multi-asset offerings (stocks, mutual funds, insurance, loans)
Partner networks expanding in rural and semi-urban regions
SEBI’s vision of financial inclusion aligns well with the sub-broker model, ensuring that even small investors across India get access to capital markets.
Conclusion
Sub-brokers have been the backbone of India’s retail participation in stock markets. While their regulatory identity has evolved into that of Authorised Persons, their importance remains undiminished. They serve as the personal link between investors and markets—educating, assisting, and empowering individuals to invest confidently.
In an age of digital platforms and algorithmic trading, sub-brokers continue to add human value—trust, guidance, and service—which technology alone cannot replace. As India’s financial markets expand, the sub-broker network will remain an essential pillar of inclusive market growth and investor participation.

My Journal Trade 2 - ETHUSDT LONGThis was a counter trade in a downtrend, low probability and also weekend, however it looked super clean and I took it. Coming to the trade
1. SMT between PDLs b/w ETH and BTC
2. Price tapped into H4 FVG
3. Smt with BTC in the H4 FVG
4. Target a basic 1 to 2 Risk to Reward
So this was a success. A risky one in a downtrend though, took it because it has all the elements of a good trade setup barring the time.

CRYPTO WEEKLY OUTLOOK 10/11/25 - 17/11/25Wassup Lads! So crypto is clearly in a downtrend as of now targeting pending daily sell side liquidity but it's also in a monthly key level that is a fair value gap, so what I am expecting price to do now is take out the pending lows on the daily timeframe on BTCUSDT and inverse the daily fair value gap, this would also cause an SMT Divergence with ETHUSDT signalling a shift in orderflow. So right now it's headed lower.
This is my plan,
1. Sell to the lows
2. Wait for an inversion of the daily bearish fair value gap on BTCUSDT, to confirm a reversal for buys.
Remember to -
1. Manage Risk
2. Do your own research
3. Stay Disciplined

BTC Analysis for next trade setupBTC Analysis for next trade setup. It's top down analysis where we are waiting for fibo levels to enter long.

Interest Rates Explained: Definition, Types and DeterminantsDefinition of Interest Rates
An interest rate is the cost of borrowing money or the reward for saving it, expressed as a percentage of the principal amount per period, typically per year. When you borrow money, you pay interest; when you lend or deposit money, you earn interest. Essentially, it represents the “price” of money — how much it costs to use someone else’s funds for a specific time.
For example, if you borrow ₹100,000 at an annual interest rate of 10%, you owe ₹10,000 as interest after one year. Conversely, if you deposit ₹100,000 in a bank account offering 6% interest, you earn ₹6,000 in a year.
Types of Interest Rates
Interest rates can be classified into several types depending on the context and application.
1. Nominal and Real Interest Rates
Nominal interest rate is the rate stated on financial instruments or loans without adjusting for inflation.
Real interest rate is the nominal rate minus the inflation rate.
Real Interest Rate = Nominal Rate − Inflation Rate
For example, if a bank offers 8% nominal interest and inflation is 5%, the real interest rate is 3%. Real rates reflect the true earning or cost of money in terms of purchasing power.
2. Fixed and Floating (Variable) Interest Rates
Fixed rate remains constant throughout the loan or investment term. This offers stability and predictability.
Floating or variable rate changes over time, often linked to a benchmark such as the repo rate or LIBOR (London Interbank Offered Rate). These rates fluctuate with market conditions.
3. Simple and Compound Interest
Simple interest is calculated only on the principal amount.
Simple Interest
=
𝑃
×
𝑅
×
𝑇
/
100
Simple Interest=P×R×T/100
Compound interest is calculated on both the principal and accumulated interest. It grows faster because of the compounding effect — interest on interest.
4. Short-term and Long-term Interest Rates
Short-term rates apply to loans or deposits with a maturity of less than a year.
Long-term rates apply to financial instruments with longer maturities, such as bonds or mortgages.
Determinants of Interest Rates
Interest rates are influenced by a combination of macroeconomic factors, government policies, and market dynamics. The key determinants include:
1. Central Bank Policy
The central bank (e.g., the Reserve Bank of India, or RBI) plays a crucial role in setting benchmark rates. In India, the repo rate — the rate at which banks borrow from the RBI — serves as the primary policy rate. When the repo rate rises, borrowing becomes more expensive, reducing liquidity and controlling inflation. Conversely, a lower repo rate stimulates borrowing and investment.
2. Inflation
Inflation has a direct relationship with interest rates. Higher inflation erodes the purchasing power of money, prompting central banks to raise rates to curb excessive spending. On the other hand, when inflation is low, rates are reduced to encourage consumption and investment.
3. Demand and Supply of Credit
When businesses and consumers demand more loans, the demand for credit rises, pushing interest rates up. If the supply of funds in the banking system is high, interest rates tend to fall.
4. Economic Growth
In a growing economy, investment opportunities expand, and demand for capital increases, often leading to higher rates. During recessions, central banks lower rates to revive growth.
5. Government Borrowing
When a government borrows heavily through bonds, it can increase the overall demand for credit, leading to higher interest rates, especially if private savings are limited.
6. Global Factors
Global interest rate trends, especially in major economies like the United States, influence domestic rates. For instance, if U.S. rates rise, investors might shift funds from emerging markets, prompting those countries to raise rates to retain capital.
Role of Interest Rates in the Economy
Interest rates act as a powerful lever of economic control, influencing spending, investment, inflation, and exchange rates. Their effects can be seen in several areas:
1. Consumption and Savings
High interest rates encourage people to save more and borrow less because the cost of loans increases and returns on savings rise. Low rates have the opposite effect — borrowing becomes cheaper, boosting consumption.
2. Business Investment
Companies often finance expansion through borrowed funds. When rates are low, borrowing costs decrease, encouraging investment in new projects, machinery, or technology. Higher rates discourage borrowing and can slow corporate growth.
3. Inflation Control
Central banks use interest rates to manage inflation. Raising rates helps reduce money circulation, cooling demand and lowering inflationary pressure. Lowering rates increases liquidity, stimulating spending when inflation is low.
4. Employment and Growth
When interest rates are low, investment rises, production expands, and employment increases. Conversely, high interest rates can slow down business activities, leading to reduced hiring and slower economic growth.
5. Exchange Rates and Foreign Investment
Higher interest rates attract foreign capital as investors seek better returns, strengthening the domestic currency. Lower rates can lead to currency depreciation but may boost exports by making goods cheaper abroad.
Interest Rates and Financial Markets
Interest rates have a profound impact on stock, bond, and real estate markets.
1. Bond Market
Bond prices and interest rates move inversely. When interest rates rise, existing bonds with lower yields become less attractive, causing their prices to fall. Conversely, when rates fall, bond prices rise.
2. Stock Market
Low interest rates usually lead to higher stock prices as companies benefit from cheaper financing and investors shift funds from low-yield savings to equities. High rates can depress stock prices due to higher borrowing costs and reduced profit margins.
3. Real Estate
Interest rates directly affect mortgage rates. Lower rates make housing loans cheaper, boosting demand for property. Rising rates, however, reduce affordability and slow down real estate growth.
Interest Rates and Personal Finance
For individuals, interest rates influence nearly every financial decision:
Loans and EMIs: Higher rates mean larger monthly payments for home, car, or education loans.
Savings and Investments: When rates are high, fixed deposits and bonds become more rewarding.
Credit Cards: Variable interest rates on credit cards can increase financial burden when rates rise.
Understanding interest rates helps individuals plan better, manage debt effectively, and optimize investment returns.
Recent Trends in Interest Rates
In recent years, global interest rates have fluctuated sharply due to economic disruptions like the COVID-19 pandemic, inflationary pressures, and central bank interventions. Many central banks, including the U.S. Federal Reserve and the RBI, initially cut rates to stimulate growth but later increased them to control rising inflation. The balancing act between growth and price stability continues to define interest rate trends worldwide.
Conclusion
Interest rates are much more than a number quoted by banks — they are a critical economic signal that affects every aspect of financial life. They determine the cost of credit, influence investment behavior, and serve as a tool for managing inflation and growth. Understanding how interest rates work enables individuals, businesses, and policymakers to make informed financial and economic decisions. In essence, interest rates reflect the heartbeat of an economy — when they change, the entire economic system responds.

ETH/USDT (4H) chartETH/USDT (4H) chart:
The price is currently trading near a support zone (around $3,250–3,300).
The chart shows a potential bullish setup with two marked target points above.
The Ichimoku Cloud suggests resistance around mid-levels before a full reversal.
Here’s the breakdown 👇
🔹 Key Levels:
Support zone: $3,250 – $3,300
First target (inside the cloud): around $3,700 – $3,750
Second target (top / resistance zone): around $4,150 – $4,200
🔹 Summary:
If ETH holds the current support and breaks above the cloud:
Target 1: ≈ $3,700
Target 2: ≈ $4,200
Invalidation: below $3,200 (support breakdown)

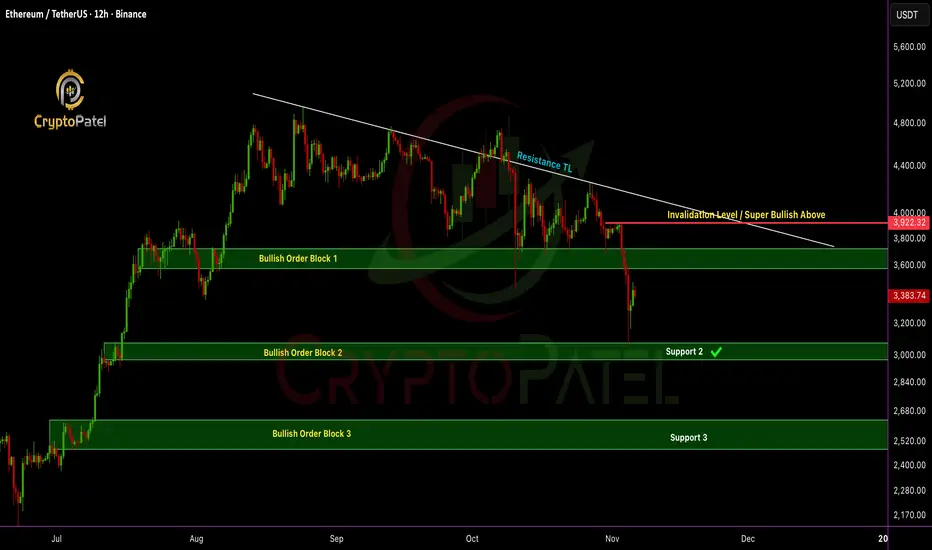
ETH/USDT dumped 20% after my analysisETHEREUM Update: Price just hit the bullish order block at $3,057 and bounced exactly as predicted ✅
Quick recap:
✅ Short-term: I’m bearish below $3,920, next potential leg down $2,500–$2,200 if $3,000 support breaks.
✅ Medium-term: Holding $3,000 support is key, could spark the next bullish wave.
✅ Long-term: Still super bullish & Target remains $10K–$15K ETH
Paper hands panic. Legends load the blood & hold.
Which one are you? 👇
NFA & DYOR
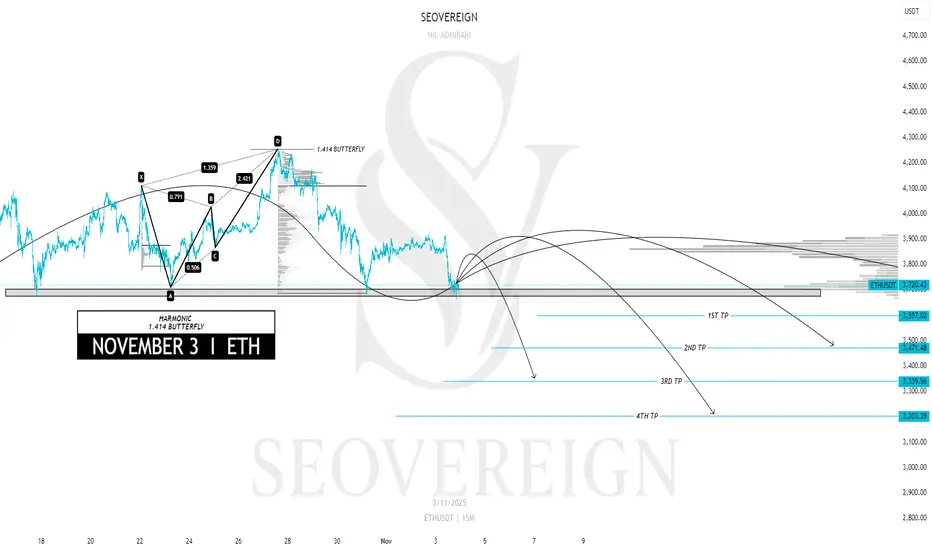
[SeoVereign] ETHEREUM BEARISH Outlook – November 03, 2025I would like to share my Ethereum idea as of November 3.
This idea is an extension of the one from October 27. The short positions entered on the 27th will be closed in profit in connection with this idea, and I plan to add some additional positions at the same time.
Basis — Harmonic 1.414 Butterfly Pattern
Currently, Ethereum is approaching the completion zone of the 1.414 Harmonic Butterfly pattern that I personally designed.
This zone is structurally an overextension area,
where a strong technical reversal possibility exists.
Accordingly, I set the average target price around 3,400 USDT.
Further position management and updates will be provided depending on market conditions.
Thank you for reading.
[SeoVereign] ETHEREUM BEARISH Outlook – October 27, 2025Hello everyone,
Currently, Ethereum has re-entered a major resistance zone,
and there is a high probability of a short-term corrective movement emerging.
First Basis — FIBONACCI 1.13~1.272
Ethereum is positioned within the 1.13–1.272 range relative to the upper structure.
This zone is generally recognized as an overheated area of an upward wave,
where selling pressure tends to emerge following the formation of a short-term high.
Second Basis — WAVE.M = WAVE.N × 1.618
The ongoing M-wave shows an extension ratio of approximately 1.618 relative to the previous N-wave.
This represents an overextended structure in wave theory,
which is typically interpreted as a sign of trend exhaustion and potential reversal.
Accordingly, the average target price is set around 3,864 USDT.
This perspective is based on data as of October 26,
and further updates will be provided to refine this outlook as the market develops.
Thank you for reading.

Intraday Long Setup | Oct 26th 2025 | Valid Until Daily ClosePrice might retrace to a strong pivot zone.
Structure remains bullish with potential for continuation after pullback.
Tight risk control.
Watch for price reaction within the red zone. Entry only if confirmation appears
The setup expires at end of the daily candle close.

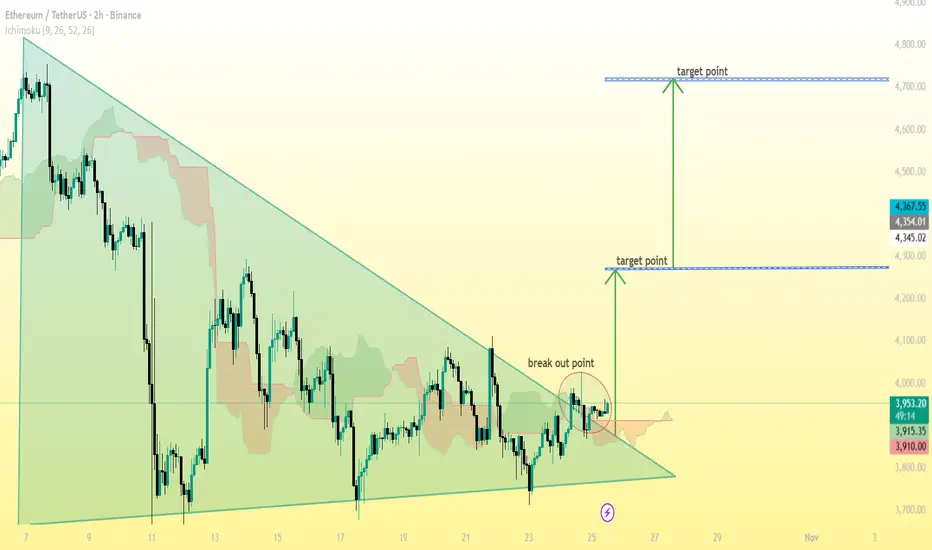
ETH/USDT (Ethereum vs Tether) on the 2-hour timeframe...ETH/USDT (Ethereum vs Tether) on the 2-hour timeframe, the pattern drawn is a symmetrical triangle — a consolidation setup that often leads to a strong breakout.
Here’s the target breakdown based on my chart:
---
📈 Current breakout level:
Around $3,950 – $3,960
🎯 Target 1 (short-term):
Around $4,350 – $4,370
This is the first target after the breakout, matching my chart’s lower target point.
(≈ +10% move from the breakout)
---
🎯 Target 2 (extended / major):
Around $4,700 – $4,750
This is the second target — the measured move from the triangle’s height projected upward.
(≈ +18%–20% move from the breakout)
---
⚠ Support / Stop-loss suggestion:
If price closes back below $3,900, it may invalidate the breakout and signal a false move.
---
✅ Summary:
Breakout point: $3,950
Target 1: $4,350
Target 2: $4,700
Stop loss: $3,900
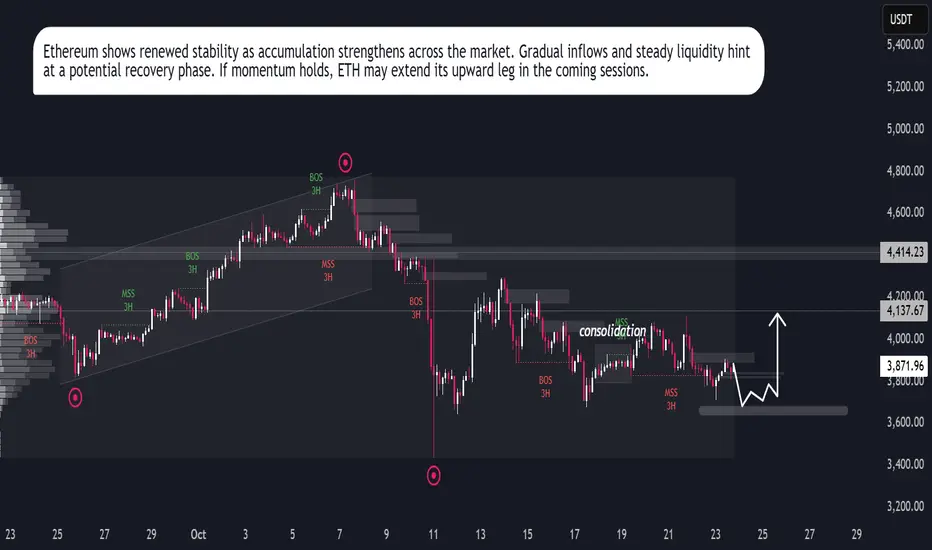
ETH Eyes Upside RunEthereum shows signs of regaining strength after a prolonged corrective phase. The asset is currently stabilizing, supported by gradual inflows from institutional participants and renewed investor accumulation. Market behavior indicates controlled volatility, suggesting a preparation phase before a potential expansion.
Network data reflects consistent transaction activity, while liquidity concentration hints at sustained participation from long-term holders. The recent stabilization in funding rates and improved open interest add weight to the recovery outlook.
If momentum continues to build under these conditions, Ethereum could enter a structured growth cycle in the coming sessions.
[SeoVereign] ETHEREUM BEARISH Outlook – October 21, 2025Hello everyone,
This idea is connected to the one shared on the 19th.
I am still holding the short position that was entered based on the October 19 idea, and since some of the underlying reasons have been slightly revised, I’m sharing this as an additional update.
Today, as of October 21, I would like to present my bearish (short) outlook on Ethereum.
Basis — BEARISH BAT PATTERN / WAVE5 = WAVE1 × 0.5
Ethereum is currently positioned near the PRZ (Potential Reversal Zone) of the Bearish Bat Pattern.
This pattern represents a typical retracement-based bearish reversal structure,
where the price tends to form a top around the 0.886 retracement level of XA before transitioning into a downward move.
In addition, within the wave structure, the ratio of WAVE5 = WAVE1 × 0.5 is being formed,
which is generally interpreted as an early termination zone of a short-term downward wave.
In other words, both pattern completion and ratio convergence are occurring simultaneously,
indicating that the current region provides a valid reversal signal from a bearish perspective.
Accordingly, I set the average target price around 3,756 USDT.
Depending on future chart developments,
I will continue to provide updates regarding position management and any changes.
Thank you.
