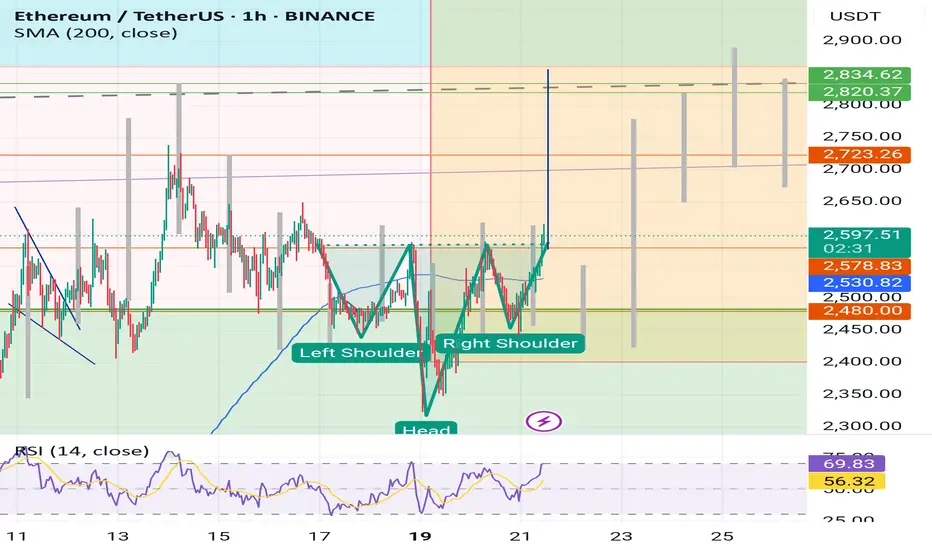
ETHUSDT 1HR time frame inverse head and shoulder pattern.Eth can go to 2850 as it's target of inverse head and shoulder pattern and also 2850 is a major resistance.
Trade ideas
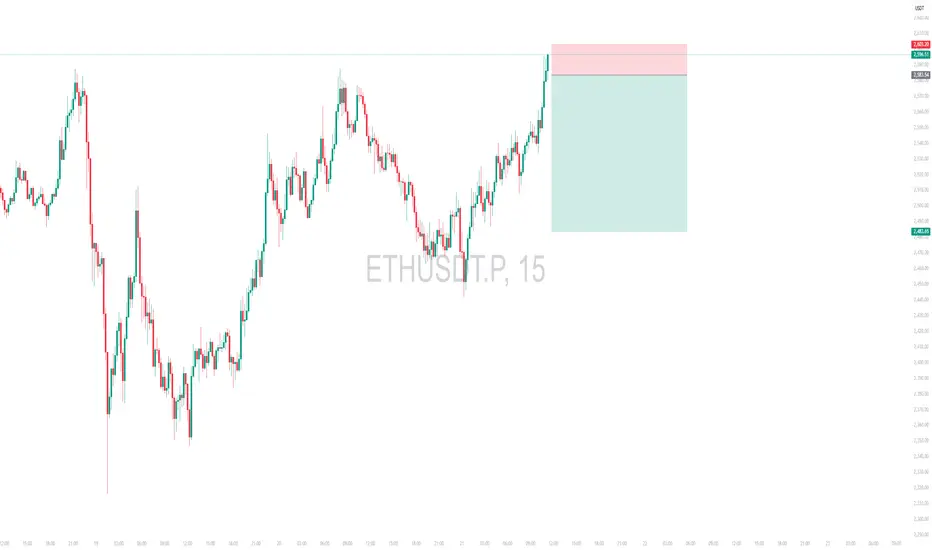
Intraday Short Setup | May 21st 25 | Valid Until Daily ClosePrice has pushed into a potential intraday Pivot supply zone (red box) where sellers may step in. This trade is based on the expectation of a rejection from this area.
Entry: Red box — a short entry zone aligned with overhead supply
Stop Loss: Above the red zone (invalidates the setup)
Target: Green box — area to consider partial/full exit based on momentum
ETHUSDT has shown a strong bounce but is now approaching a key pivotal resistance zone
Risk-reward is favorable with a tight invalidation and clean downside target
Price may stall or reverse near the red box, creating short opportunity
Note:
This is an intraday trade idea that expires at 00:00 UTC (Daily Candle Close). Re-evaluate the setup if price remains indecisive near the entry zone close to that time.
$ETH BULLS HAVE ENTERED ALREADY?From the chart we can say the bulls have entered around the green zone and trying their hard to push through the above red zone and and after every FUD the bulls just don't give up. What I see here is bulls would soon overpower the bears around the red zone and give a crazy upside spike clearing all shorts above. Now the question is how soon would that happen ?? Maybe a day or maybe a week or month. Sooner or later this would be cleared :). View is negated once closed below the green zone and broken the low of that candle. Rest you guys are smart enough to plan a trade and minimize your risk and enjoy the gains / learn with losses.
DISCLAIMER : VIEWS ARE PURELY EDUCATIONAL AND NOT AN INVESTMENT ADVICE IN ANY SENSE. PLEASE CHECK WITH YOUR FINANCIAL ADVISOR BEFORE FOLLOWING MY IDEAS BLINDLY

2025.05.18 ETHEREUM Short-term long positionWe are the SeoVereign Trading Team.
With sharp insight and precise analysis, we regularly share trading ideas on Bitcoin and other major assets—always guided by structure, sentiment, and momentum.
🔔 Follow us to never miss a market update.
📈 Ethereum (ETH) Long Position Outlook
Ethereum is currently one of the most difficult assets to predict in terms of direction.
Recently, it has shown frequent irregular movements, which—while unpredictable—can be attractive from a short-term trading perspective due to the increased volatility.
From a technical standpoint, Ethereum appears to have completed its B wave.
When measuring the 5-wave structure using trend-based Fibonacci extension, the B wave concludes near the 0.786 level.
This 0.786 extension is a custom wave ratio developed by the Seovereign team and has shown strong reliability in live trading scenarios.
To avoid visual clutter on the chart, we have chosen to highlight only the most important 0.786 level in this analysis.
All detailed wave counts and ratios have been marked on the chart, so feel free to refer to them for more specifics.
🎯 Target Levels
1st Target: 2,555
2nd Target: 2,589
3rd Target: 2,624
Due to the high volatility, the potential for opportunity is also high—but proper risk management remains essential.
This zone is considered a technically valid entry point for a long position.
Approach the market with flexibility and strategic focus.

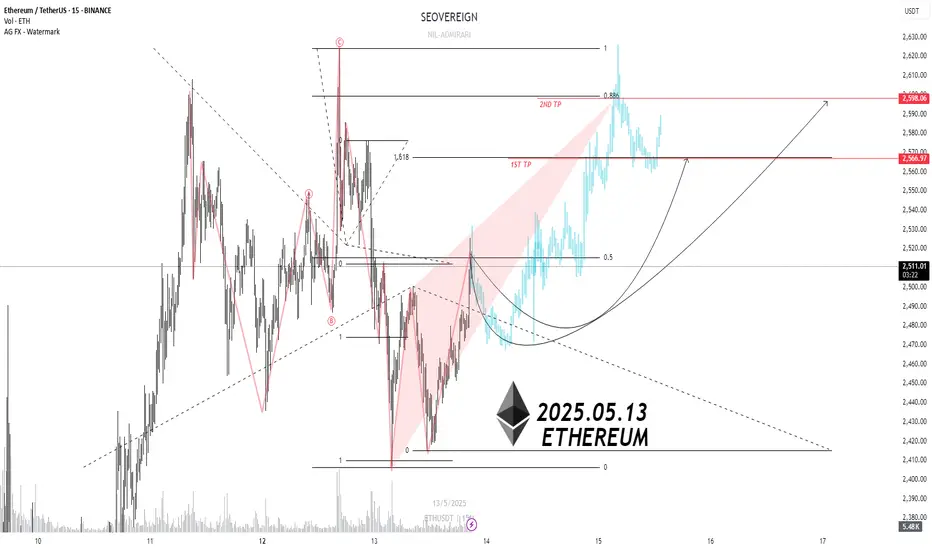
2025.05.15 ETH We are the SeoVereign Trading Team.
With sharp insight and precise analysis, we regularly share trading ideas on Bitcoin and other major assets—always guided by structure, sentiment, and momentum.
🔔 Follow us to never miss a market update.
The progression up to Wave B has been confirmed, and the current technical structure indicates a high probability of entering Wave C.
Accordingly, a short-term long (buy) bias is suggested.
Projected Wave C Targets (Short-Term):
1st Target: 2,599
2nd Target: 2,626
3rd Target: 2,653
Proper risk management is essential upon entry. Monitor closely for potential selling pressure near each target level.
It is also recommended to confirm directional alignment with macro trends and supporting technical indicators.

Is Now the Time for Ethereum to Be Re-evaluated?We are the SeoVereign Trading Team.
With sharp insight and precise analysis, we regularly share trading ideas on Bitcoin and other major assets—always guided by structure, sentiment, and momentum.
🔔 Follow us to never miss a market update.
🔥 As Bitcoin reclaims the 100K narrative, Ethereum is waking up.
In the wake of Bitcoin’s bullish momentum, Ethereum is flashing strong reversal signals.
After a prolonged period of undervaluation and market hesitation, it’s finally time for ETH to be re-evaluated for what it’s truly worth.
At SeoVereign, we’re positioning strategically long on Ethereum, aligning with both technical setups and market sentiment.
This isn't just a short-term bounce—it's potentially the start of a mid-term trend reversal.
🎯 Target 1: 2,566 — Breaking near-term resistance
🎯 Target 2: 2,598 — Key mid-structure objective
📊 Right now, the market is split between the hesitant and the proactive.
We're choosing to be ahead of the curve.
🚀 The SeoVereign Team is here to catch this wave—
Now is the time to ride the ETH long setup.
Ethereum (ETH) – Early Recovery Setup After Liquidity SweepEthereum has printed a bullish deviation below key liquidity ($1,500) and reclaimed the 20-day EMA, flipping prior resistance into support — a classic signal of early reversal momentum.
We're now watching for a pullback into the $2,100–$2,200 demand zone to offer an optimal spot entry before a potential move into higher timeframe targets.
🔹 Entry Zone:
$2,100 – $2,200 (pullback into reclaimed support/demand)
🎯 Take Profit Targets:
🥇 $3,000
🥈 $3,500
🥉 $3,900
🛑 Stop Loss:
Close below $2,000 (to invalidate reclaim of structure)
What a clear sign for long@CryptoPointHindi Jahapana tussi great ho... what more clear sign a market can give. Trinity ki jai ho . Jabardast zindabad.
Please free indicator ko rehne do bhai hum jaise praja k pass

Ethereu ETHUSDT Price Outlook: Key Resistance at 2005–2055 Level"On the Daily Time Frame, the levels 2005.00 and 2055.21 are key resistance zones. If the price approaches this area, there is a high probability of rejection. Should the market show bearish confirmation on the 1-hour time frame from this region, it may indicate a potential move lower—possibly to hunt liquidity near the trendline around 1730. Further downside could lead the price into the demand zone between 1600 and 1500, where it may find support."
No trade setup is ever 100% certain. Every trade carries both risk and reward. Effective risk management is the key to long-term success in trading.
Thanks for Your Support.

ETH Short Triggered — Here’s Why It Still Makes Sense
BINANCE:ETHUSDT Trade Breakdown – 🧠
🔹 Timeframe: 1H / 15min Trendline Focus
🔹 Position: Short
🎯 Cycle Overview:
• HWC (High Wave Cycle): Bullish 🔼 (but not strongly)
• MWC (Medium Wave Cycle): Ranging 🔁
• LWC (Low Wave Cycle): Weakly Bearish 🔽
Since this position is against the HWC (High Wave Cycle), I’ve reduced my risk. However, because the HWC is not strongly bullish and the MWC (Medium Wave Cycle) is ranging, taking a short position is still a valid option — as long as risk is properly managed. ⚠️
📈 Trendline Setup:
There are two key trendlines:
• Lower trendline on the 1H timeframe
• Upper trendline on the 15min timeframe
Both have 4 touches, which increases the probability of a breakout. I focus on breakouts in my strategy, so the number of touches matters.
The price was currently reacting to the lower trendline. Since it matched my breakout trigger, I entered short — but reduced my risk because it’s against the primary trend (HWC).
⚡ Also remember:
Trendlines that align with the main cycle direction tend to give stronger moves. So don’t just look at timeframe — the breakout direction matters too.
🔍 Volume & Price Action:
We've been ranging for 14 days, which builds potential energy for a sharp move.
The last touch on the trendline had a weak reaction, and volume is declining — which often signals an upcoming breakout.
🎯 Trade Details:
• Entry: 1798
• Stop Loss: 1802
• Target: 1750
🧠 Summary:
This setup matches my strategy criteria: clean touches, breakout trigger, weak reaction at the trendline, and volume confirmation. Despite being counter to HWC, risk was minimized accordingly.
Without proper risk management, you're just a ticking time bomb⚠️
— PXA 📊

THE REVERSAL TRADE1. The chart has been choppy for a while and slightly strong.
2. The accumulated SL are being hunted in this choppy period.
3. one can enter the long trade @ 1825 after the SL hunting and 15 min close bar above 1825 in green .
4. SL can be swing low RR 1:1.5

ETHUSDTMultiple confirmations aligning on ETH — already in profit, but this setup has massive potential ahead.
The structure, the momentum, the zones — everything is pointing toward a high-probability move.
I’m already riding this wave, but it looks like it’s just getting started.
Let’s see how far ETH can go from here!
#ETHUSD #CryptoTrading #Ethereum #PriceAction #WizardTrader #SmartMoneyConcepts #TradingSetup #CryptoAnalysis #TechnicalAnalysis #BreakoutTrade #TrendFollowing

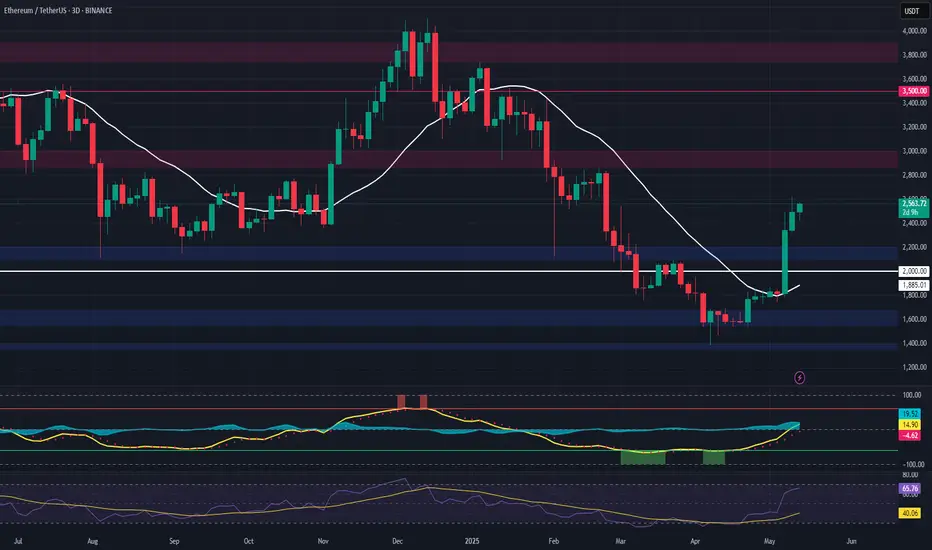
Ethereum Spot Bidding Zones - Ethereum is currently trading at 1462$ down 64% from its ATH
- Ethereum has underperformed BTC throughout the whole Crypto cycle and currently its continuing to do the same
- Ethereum has deviated below its important Market Structure Shifts and currently trying to pierce below its origin of the move
- Ethereum has a very good buying interest around 882$-1280$ this is a broader range where you should be keeping your eyes on in order to bid for Ethereum
- Another catalyst that I can see on the board is ETH/BTC pair vs BTC/DOM one is ready to bottom out near its point of interest on the other hand other is ready to top out
- BTC/D bearish and ETH/BTC bullish will print a lot of money in alts watch out both

EthUsdt bullish Buying from 30 min oB
Liquidity is stacked on buy side as marked by oval shape and as equal highs.
Fvg above showing insufficient Price action ,expecting to fill the gap atleast 50%
Good risk reward buy

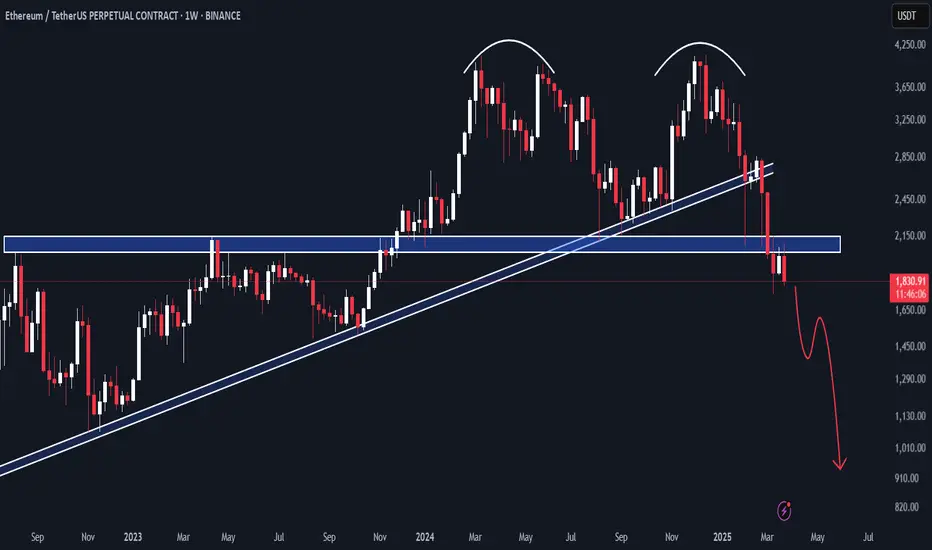
Ethereum Weekly AnalysisThe chart is showing some bearish signs for Ethereum. If the price doesn't bounce back above $1,750, we might see a bigger drop in the coming days or weeks.

ETHEREUM BULLISH DIVERGENCE TARGET 2500The CRYPTOCAP:ETH chart shows prices hovering around a key support zone of 1,750 - 1,830 within a descending channel. The red Ichimoku Cloud above acts as a strong resistance barrier, indicating potential challenges in breaking upwards.
If support holds, aim for a bounce towards the cloud resistance near 2,400. A successful breakout from the cloud could target 2,800 and beyond. However, if support fails, watch for a dip to 1,600 levels.

EthUsdt BearishLiquidity stacked on sell side as marked by blue oval or equal lows or retailers double bottom or strong support whatever.
Sell limit with a risk of 1% can give u 5% profit.
2054 is the sell point after a nice retrace.
Valid condition : market must retrace before taking out those liquidities.

Ethereum Accumulation Alert! 🚀 Ethereum Accumulation Alert! 🔥
Ethereum is entering a potential spring accumulation zone, presenting a solid long-term opportunity.
📉 Buy Zone: $1,900 – $1,550
🎯 Targets: $5,000 / $7,500 / $10,000
🔹 Key Support: $1,550 – Holding above this level keeps the bullish structure intact.
🔹 Breakdown Risk: If ETH loses $1,550, expect further downside toward sub-$1,000, where the next strong entry lies.
📊 Smart money is accumulating—don’t miss the dip!
#Ethereum #CryptoTrading #Accumulation #ETH #NFA #DYOR

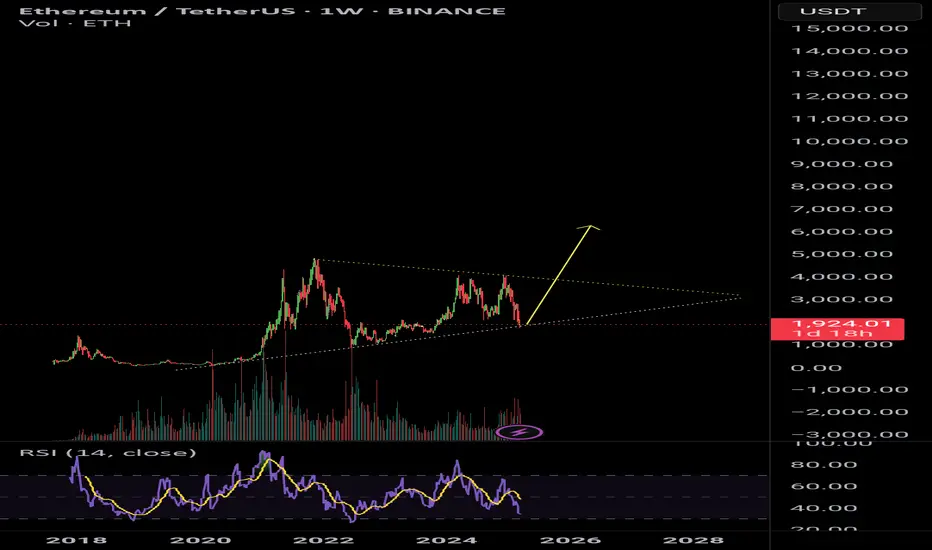
Triangle pattern Here's a possible description:
"Ethereum (ETH) Price Update: Triangle Pattern Forms, Breakout to $6,000 Level Imminent?
The Ethereum price chart is exhibiting a notable triangle pattern, hinting at a potential support. If the pattern holds, ETH could witness a significant surge, targeting the $6,000 level. Will Ethereum's price finally break free from its current range and reach new heights? Stay tuned for further updates!"
Ethereum 1D/1W Technical Price Commentary - Ethereum is currently trading at 1949$
- Ethereum has erased 53% from its recent swing high so far (4097$-1947$)
- Ethereum has been correcting and underperforming for more than a quarter now whereas in Q1 2025 Ethereum has lost half of its value
- ETH/BTC still has not bottomed out and we are still left with more downside technically. The path from 0.23-0.016 looks easy and can easily mitigate this level post that I will re-evaluate new levels.
- Ethereum is below the Point of interest deviating many important levels, unless you see a consolidation making higher high on a 4H Timeframe there's actually no point in longing Ethereum or adding it in SPOT.
- Next observation, the path that I have drawn clearly shows the next path for ETH, where I anticipate ETH to easily revisit 1521$. If that place has buyers interest it will be a quick liquidity grab and a strong bounceback for ETH or else we might start consolidating.

Elliott Wave Analysis: Long PositionElliott Wave Analysis: Long Position
Entry Point: 1900
Stop Loss: 1400
Target Price: 3400
Based on the Elliott Wave theory, the chart indicates a potential long position. The entry point is set at 1900, with a stop loss at 81,950 to manage risk. The target price is projected at 3400, suggesting a significant upside potential. This setup aligns with the wave patterns, indicating a bullish trend continuation.

$ETH - What do you think what should be the target?AMEX:ETH is broken down the channel and moving for next downside target, as of now it looks around 2390 usd and next would be around 2160 usd. Many things will depend on how CRYPTOCAP:BTC will react, there might be some small pullbacks, but I am assuming that these targets will be met.
