EDUCATIONAL | Uptrend OverEth has hit a major upward target.
Wave C is equal to Wave A
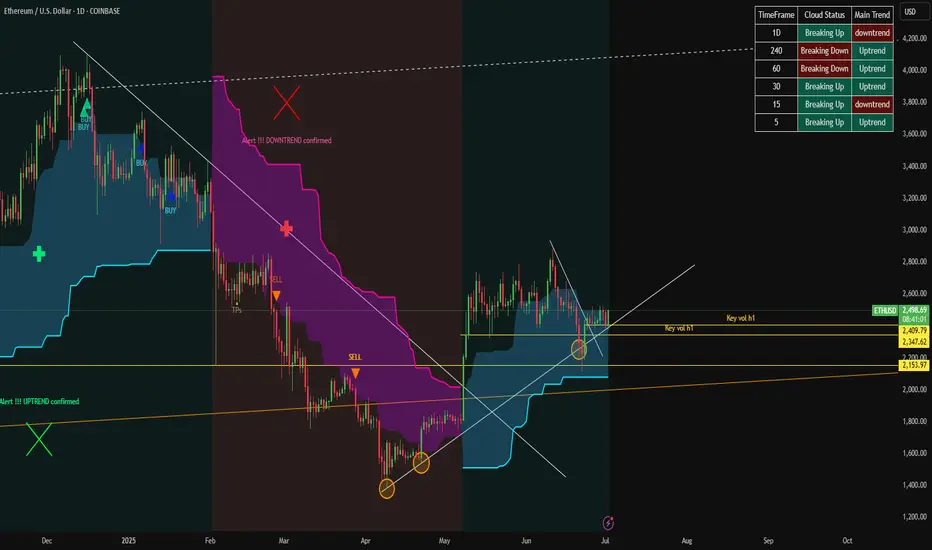
Will be on the lookout for shorting opportunities after getting a confirmation of downtrend, which will most likely be a corrective downtrend
ETHWAVAX_1ACF15.USD trade ideas

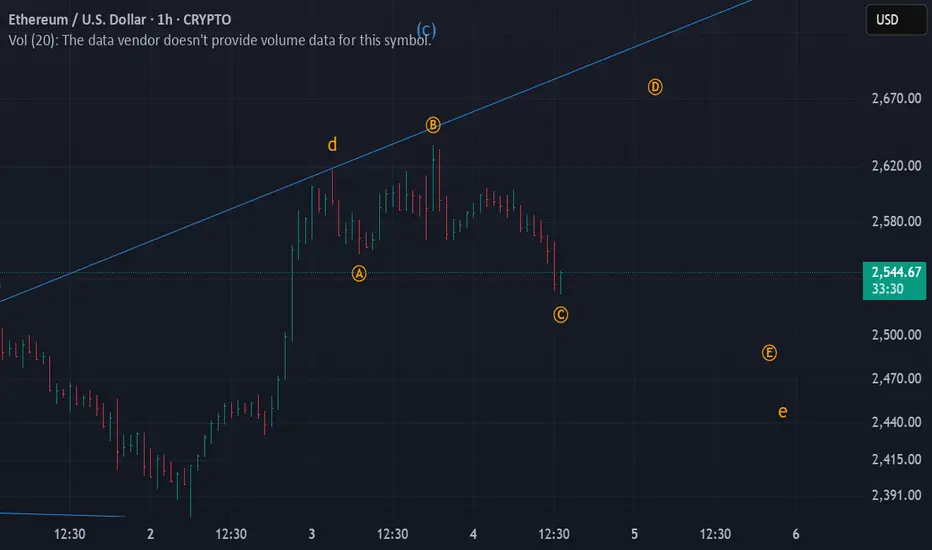
Corrective Rise UpEthereum seems to have completed Wave C of an expanding triangle and now we're headed towards Wave D.
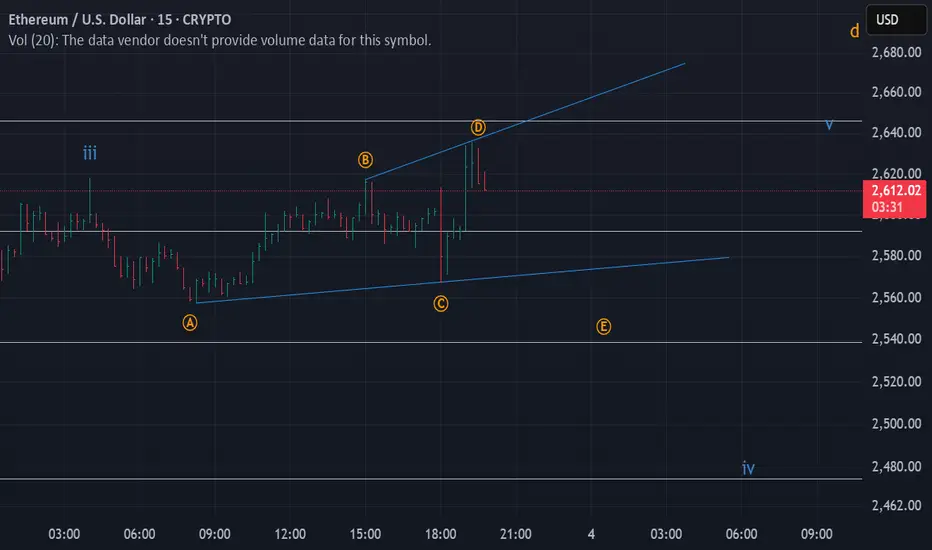
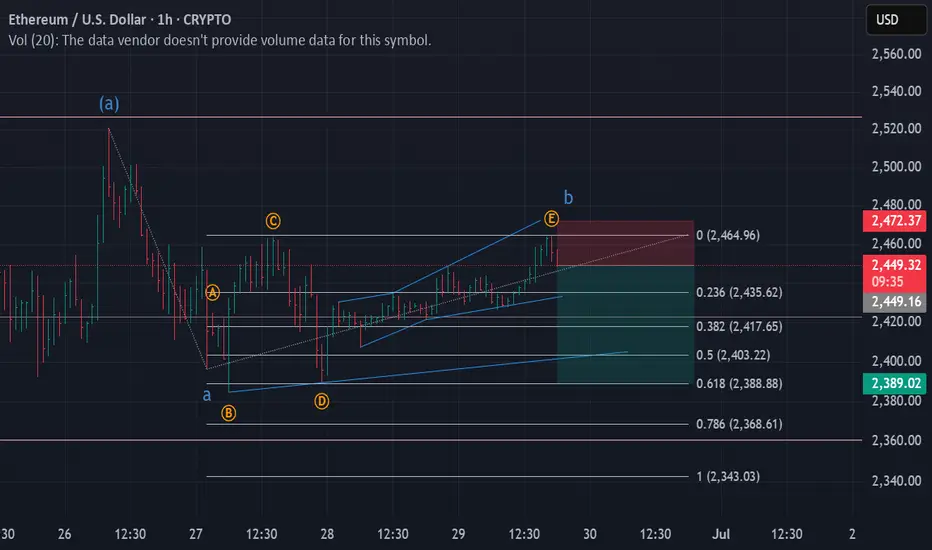
Rise UpEth seems to have completed wave 2 or wave B and now moving upwards.
Tgt 1 -> 2630
Tgt 2 -> 2645

Educational | Completed a complex triple correctionEthereum seems to have completed a triple combination pattern
Wave Z ended with a neutral triangle
Wave Y was a zigzag
Wave W was a flat.
Wave Y took equal time as Wave W to form
Wave Z took twice the time of Wave W/Y.
This triple combination completed Wave E of a larger neutral triangle.
The internal Wave E of a triangle is generally similar to the larger triangle of which it is a part of.
In this case too, the Wave E of the neutral triangle itself concluded with a neutral triangle.
Let me know if you'd more such educational content or larger timeframe analysis of Ethereum or any other asset.
Happy Trading!!

ETHERIUM best tipReal-time Ethereum (ETH/USDT) chart powered by TradingView. Yeh chart aapko live price movements, historical trends, aur technical indicators ke sath full customization deta hai — perfect for traders & investors.

Ethereum levels,try to sell near resistance 2150-220 buying areaHow My Harmonic pattern projection Indicator work is explained below :
Recent High or Low :
D-0% is our recent low or high
Profit booking zone: D13% -D15% is
range if break them profit booking start on uptrend or downtrend but only profit booking, trend not changed
SL reversal zone : SL 23% and SL 25% is reversal zone if break then trend reverse and we can take reverse trade
Target : T1, T2, T3, T4 and .
Are our Target zone
Corrective DowntrendEthereum seems to forming Wave E of an expanding triangle and could lead to below Wave C.
Will update in case we need to book profit
Corrective Rise UpEthereum seems to have completed Wave C
and now we're entering Wave D which will be a corrective rise.
I believe we're in the starting of a diametric formation which will be of 'diamond' category

ETH/USDT strong up trend.Looking at the ETH chart, we can see one thing, the price has accumulated and moved sideways for quite a while after a strong up leg before. With the bullish price structure still maintained, with ETH we look for long positions with futures or SPOT for good positions. The price is expected to surpass $3,000 soon
Corrective Downtrend | Hourly Ethereum seems to have completed Wave B in an hourly timeframe and now moving towards Wave C which could end a little lower than the starting of Wave B.
Will keep updating in case of any changes
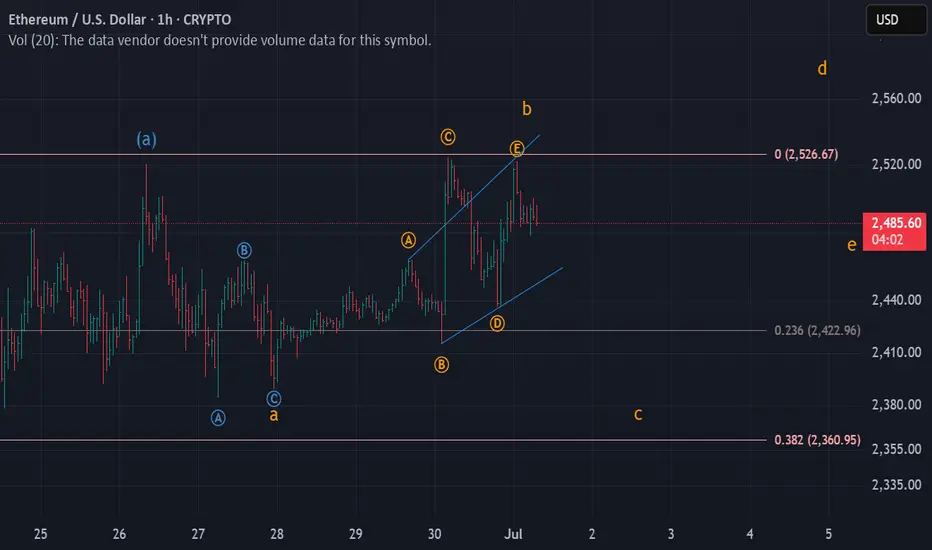
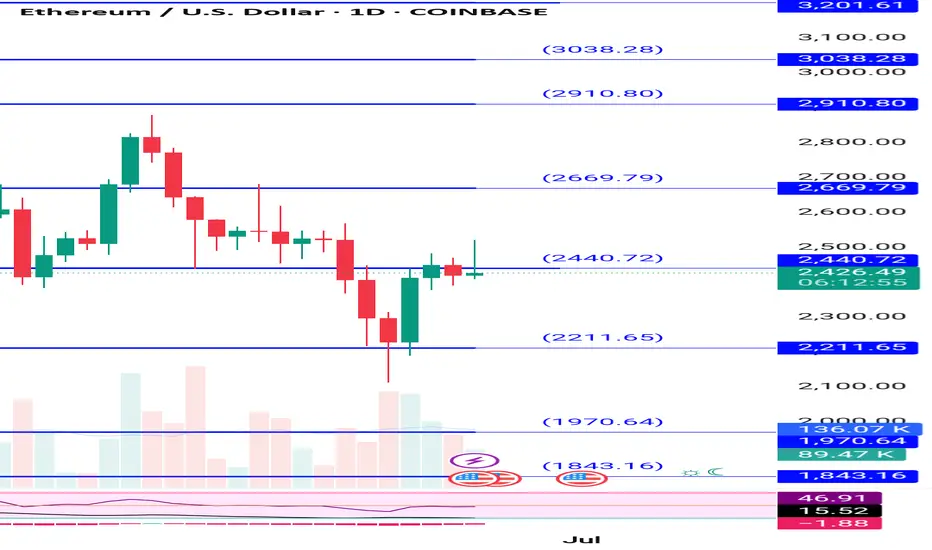
Corrective Rise UpEthereum seems to have or nearly completed Wave D of a neutral triangle and entering Wave E.
The minimum target of Wave E is around 2480
A break below current B-D trendline will be a warning sign that Wave D is still in progress
Ethereum buy near 2440 add more st 2380 sl 2340 target 2660,2730How My Harmonic pattern projection Indicator work is explained below :
Recent High or Low :
D-0% is our recent low or high
Profit booking zone: D13% -D15% is
range if break them profit booking start on uptrend or downtrend but only profit booking, trend not changed
SL reversal zone : SL 23% and SL 25% is reversal zone if break then trend reverse and we can take reverse trade
Target : T1, T2, T3, T4 and .
Are our Target zone

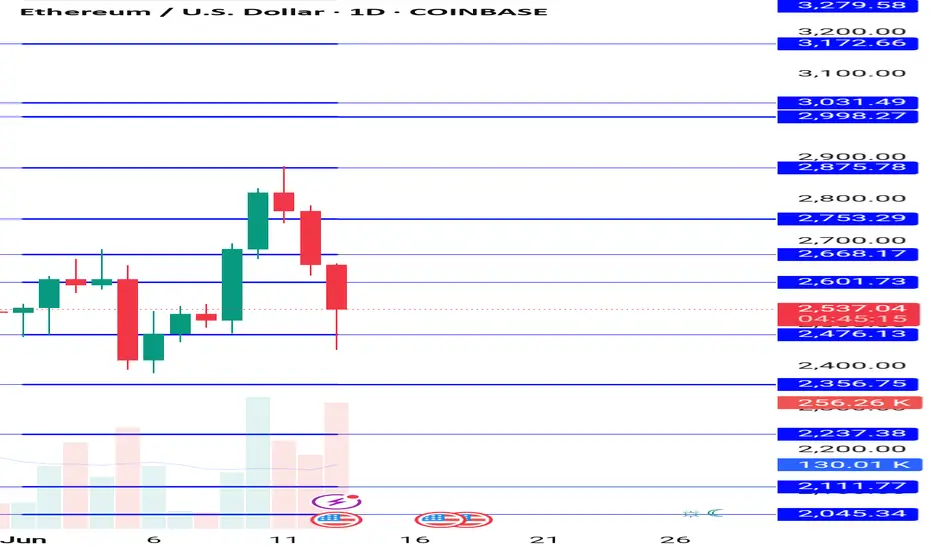
ETHUSD | SHORTEthereum seems to have completed Wave B and currently going to start Wave C of a ZigZag.
Current Price -> 2450
Stop Loss ~> 2475
Target 1 -> 2400
ETHUSD Entry at $2,422 with Target at $2,521and Support at 2,3921. Entry Point: ~2,422.2
This is the suggested buy area based on a recent bounce from the support zone.
2. Support Zone (Purple Box):
Bottom boundary: ~2,392.4
Top boundary: ~2,408.4
Price has bounced multiple times here, showing strong buying interest.
3. Resistance Point: ~2,463.9
A clear horizontal resistance line, previously tested.
4. EA Target Point: ~2,522.1
A bullish target if the price breaks above the resistance level.
---
🔶 Highlighted Patterns / Markers
Orange Circles: Indicate key swing highs and lows — possibly used to identify double tops/bottoms or rejection/wick zones.
Blue Arrows: Illustrate the anticipated move from:
Entry (2,408.1) → Resistance (2,463.9) → Target (2,521.2)
Target gain = +111.7 USD (+4.64%)
---
🔻 Stop Loss Level
Set just below the support box at ~2,392.4
Protects from false breakouts or deeper pullbacks.
---
📈 Strategy Outlook
Bullish Bias: The setup expects a breakout from the current price range.
Risk-Reward Ratio: Appears favorable — tight stop and wide target.
Confirmation Needed: A solid breakout and hold above 2,423–2,425 may be the early confirmation signal.
---
📌 Summary
Element Value
Entry Point ~2,422.2
Stop Loss ~2,392.4
Resistance ~2,463.9
Target (TP) ~2,521.2
R:R Ratio Approx. 3:1
Bias Bullish

Ethereum chart showing weakness avoid fresh buy until 2580 breakHow My Harmonic pattern projection Indicator work is explained below :
Recent High or Low :
D-0% is our recent low or high
Profit booking zone: D13% -D15% is
range if break them profit booking start on uptrend or downtrend but only profit booking, trend not changed
SL reversal zone : SL 23% and SL 25% is reversal zone if break then trend reverse and we can take reverse trade
Target : T1, T2, T3, T4 and .
Are our Target zone
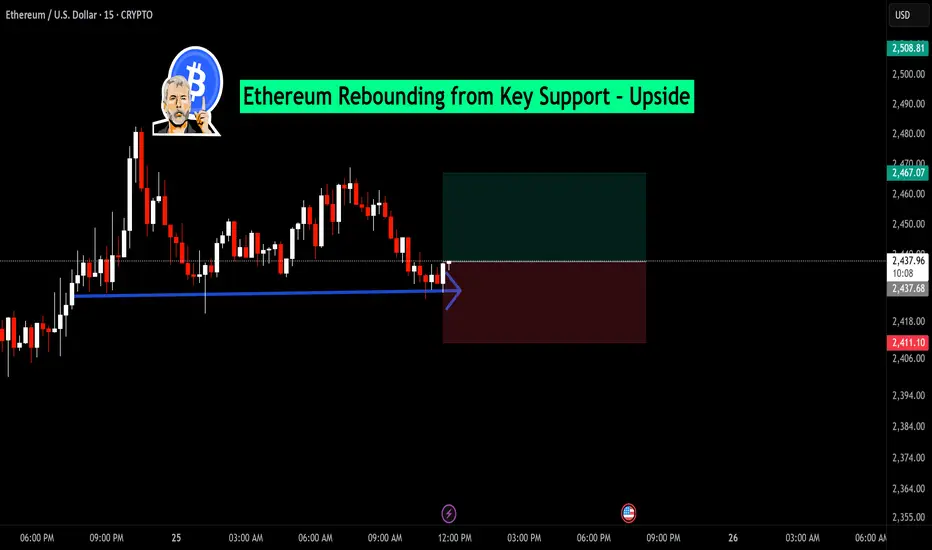
Ethereum Rebounding from Key Support – Upside TargetSupport Zone: Price has tested and respected a horizontal support level around $2,436, highlighted by the blue line and arrow. Multiple rejections here suggest buying interest.
Candlestick Reaction: A small bullish candle is forming right at support, hinting at a possible bounce.
Risk-Reward Setup: The green and red box indicates a favorable long trade setup:
✅ Entry: Near the support zone at $2,436
🎯 Target: Around $2,481 — a prior resistance level
🛑 Stop-Loss: Just below support, around $2,394 — protecting against breakdown
Ethereum (ETHUSD) Update – 15 Min ChartEthereum has respected the key support zone near $2,382, forming a potential bullish reversal candle after testing the level multiple times.
🔹 Support Held: $2,382
🔹 Current Price: $2,401
🔹 Resistance Zone: $2,435 – $2,440
🔹 Bias: Short-term bullish as long as price holds above $2,382
📌 A clean bounce from the demand zone indicates buyer interest. If ETH sustains above $2,400, we may see a move toward the $2,435 target.
🧠 Structure remains positive above support — risk-managed long opportunity.

Ethereum 2150-2130 positional Target hit now buy on dip How My Harmonic pattern projection Indicator work is explained below :
Recent High or Low :
D-0% is our recent low or high
Profit booking zone: D13% -D15% is
range if break them profit booking start on uptrend or downtrend but only profit booking, trend not changed
SL reversal zone : SL 23% and SL 25% is reversal zone if break then trend reverse and we can take reverse trade
Target : T1, T2, T3, T4 and .
Are our Target zone

Ethereum still looking negative if ceasefire news come then up How to take trades using Harmonic pattern projection Trade setup is explained below :-
Entry : 1st SL point : 0% is recent top or bottom.
Trailing D: 15.1% is work as trailing SL of buy or sell trade if hit then we have to book profit
.If price goes below 2nd D 22.5% to 24.5% range then early traders can make fresh reversals trade after breaking 1st D 15.1% safe traders can reversal trade after breaking Point D 22.5.4% to 24.5% range
Targets :
Target T1 : 36.1% to 38.3%
Target T3 : 49.1% to 52.5%
T3: 60.9% to 64.8% is our 3rd Target since this is reversal zone so must book profit if break then take fresh trade again
Target T4 : 76.4% to 79.7%
Next Targets are 100% , 127.2% ,141.4% and final Target 161.8%.
How to take reversal trade :
If price going upside/ downside then then buy or sell levels appear on Chart ( Automatically show when price reach any reversal zone of harmonic projection ).
Trailing SL:
After reach 1st Target trail SL to just above or below cost ( for example we are holding sell trade from 100 1st Target 110 hit then move trailing sl to 104-105 and move SL as price move upside or Downside)
Re- Entry :
For Re-entry in any pull back Point D ( 15.1% ) is used for re-entry then SL recent high or low Point SL ( 0% ) .
Blue Line is 1st support/ Resistance
Green line is 2nd support/ resistance
Red line is 3rd Support/ resistance

ETH/USD – Intraday Short Setup (15min)Ethereum faced rejection from the $2,555 zone and formed a short-term lower high structure.
📉 Trade Idea:
Entering a short position near $2,510
🎯 Target: $2,465
🛑 Stop Loss: $2,555
🔄 Risk-Reward: ~1:1
🔍 Price is struggling to sustain above key resistance and showing signs of exhaustion after a minor pullback. Ideal setup for scalpers/traders with a short bias.

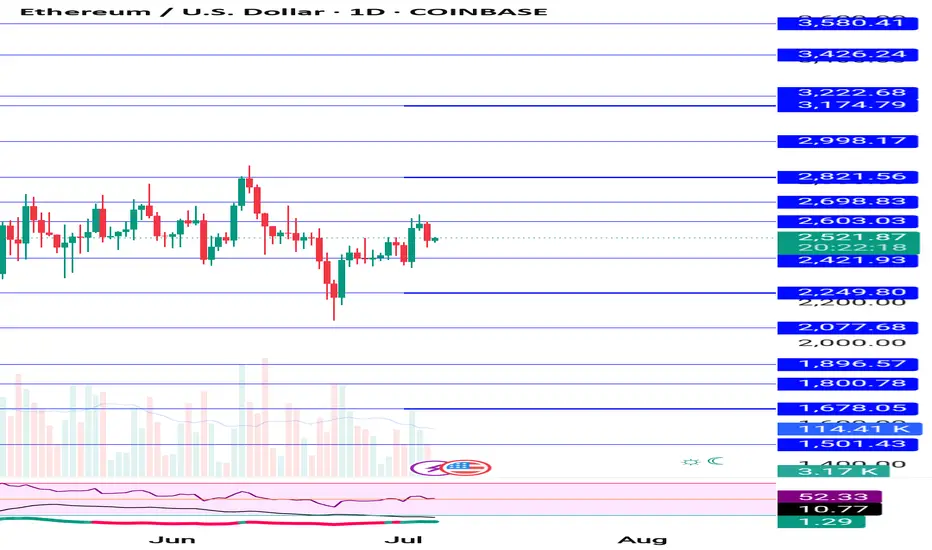
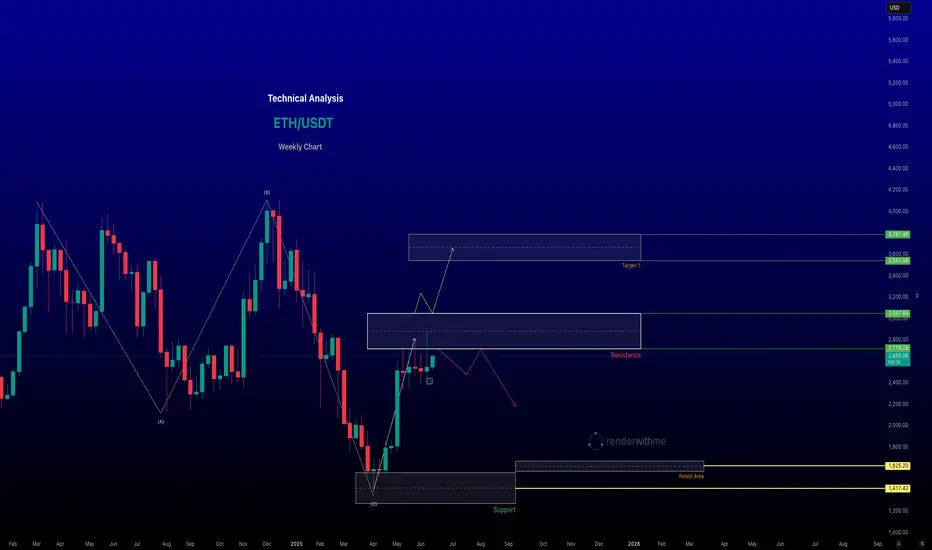
Ethereum Technical Analysis for the Week of June 16-June 231. Price Overview
Current Price: As of June 16, 2025, Ethereum's price is approximately $2,610.36 USD, with a 24-hour trading volume of $16.83 billion USD. It is up 2.59% in the last 24 hours.
Market Cap: Ethereum holds the #2 rank with a live market cap of $315.13 billion USD. Circulating supply is 120.72 million ETH.
Recent Performance:
Over the last 7 days, ETH has risen by 20%, showing strong upward momentum.
In the past month, ETH increased by 16.61%, adding an average of $624.97 to its value.
ETH has underperformed compared to Bitcoin in 2025 but shows signs of recovery with institutional interest growing.
# Support and Resistance Levels:
Support: Key support is around $2,160–$2,020
Resistance: Immediate resistance lies between $2,739–$2,850. A breakout above $2,800–$3,000 could target $3,400–$4,100.
-- Disclaimer --
This analysis is based on recent technical data and market sentiment from web sources. It is for informational purposes only and not financial advice. Trading involves high risks, and past performance does not guarantee future results. Always conduct your own research or consult a SEBI-registered advisor before trading.
#Boost and comment will be highly appreciated
Ethereum updated levels let ti go down near 2050-1990How to take trades using Harmonic pattern projection Trade setup is explained below :-
Entry : 1st SL point : 0% is recent top or bottom.
Trailing D: 15.1% is work as trailing SL of buy or sell trade if hit then we have to book profit
.If price goes below 2nd D 22.5% to 24.5% range then early traders can make fresh reversals trade after breaking 1st D 15.1% safe traders can reversal trade after breaking Point D 22.5.4% to 24.5% range
Targets :
Target T1 : 36.1% to 38.3%
Target T3 : 49.1% to 52.5%
T3: 60.9% to 64.8% is our 3rd Target since this is reversal zone so must book profit if break then take fresh trade again
Target T4 : 76.4% to 79.7%
Next Targets are 100% , 127.2% ,141.4% and final Target 161.8%.
How to take reversal trade :
If price going upside/ downside then then buy or sell levels appear on Chart ( Automatically show when price reach any reversal zone of harmonic projection ).
Trailing SL:
After reach 1st Target trail SL to just above or below cost ( for example we are holding sell trade from 100 1st Target 110 hit then move trailing sl to 104-105 and move SL as price move upside or Downside)
Re- Entry :
For Re-entry in any pull back Point D ( 15.1% ) is used for re-entry then SL recent high or low Point SL ( 0% ) .
Blue Line is 1st support/ Resistance
Green line is 2nd support/ resistance
Red line is 3rd Support/ resistance
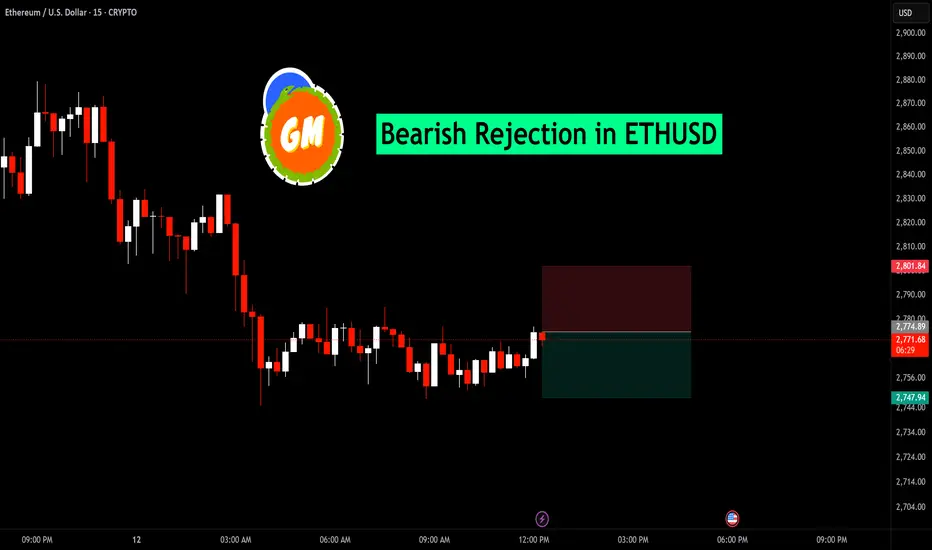
ETHUSD – Bearish Rejection Setup | 15-Min ChartEthereum faced rejection near the $2,775 resistance zone, indicating potential short-term weakness. After a period of sideways consolidation, the price failed to sustain above the key level and has started to show signs of bearish pressure.
Entry: $2,774.89
Target: $2,747.94
Stop Loss: $2,801.84
Risk-Reward Ratio: 1:1
This setup reflects a potential short opportunity as ETH forms a lower high and struggles to break above previous supply zones. A clean break below support may accelerate downside momentum.