EURAUDPrice action trading is a methodology in financial markets where traders make decisions based on the actual price movements of an asset over time, rather than relying heavily on technical indicators or fundamental analysis. It involves observing and interpreting patterns and trends in price charts to predict future price movements.
Trade ideas

EURAUD short TRADEEURAUD Short Trade Setup 🚀
🔹 Entry: 1.83565
🔹 Stop Loss: 1.85112
🔹 Target 3: 1.77161
📌 Analysis:
This trade setup is based on a descending trendline rejection near key resistance. The price is expected to respect the trendline and move downward toward our target. A strong confluence of resistance levels supports the bearish bias.
⚠️ Risk Management:
Always trade with proper risk-reward ratios and follow your strategy. Manage your lot size accordingly.
📊 Timeframe: 15 Min (EUR/AUD)
What are your thoughts on this setup? Drop your comments below! 👇 l

EURAUD MULTI TIME FRAME ANALYSISHello traders , here is the full multi time frame analysis for this pair, let me know in the comment section below if you have any questions , the entry will be taken only if all rules of the strategies will be satisfied. wait for more price action to develop before taking any position. I suggest you keep this pair on your watchlist and see if the rules of your strategy are satisfied.
🧠💡 Share your unique analysis, thoughts, and ideas in the comments section below. I'm excited to hear your perspective on this pair .
💭🔍 Don't hesitate to comment if you have any questions or queries regarding this analysis.

EurAud sell BearishValid condition ( it must retrace to the entry point first before taking out sell side liquidities marked by blue oval as equal lows )
Good risk reward
New york entry

EURAUD - IS THE DOWNTREND ABOUT TO KICK OFF?Symbol - EURAUD
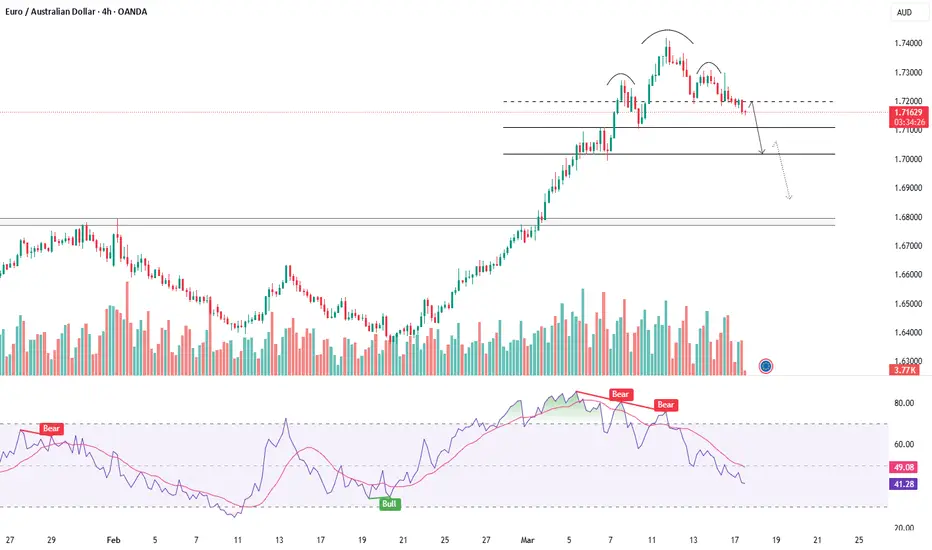
The EURAUD pair is currently testing a key resistance level on the weekly chart. A false breakout has occurred following a liquidity sweep, with no apparent continuation of the bullish trend. Additionally, the chart is displaying a familiar pin-bar reversal pattern.
After the price exited the consolidation range, which was capped by the 1.6787 resistance level, a distribution pattern began to form, targeting liquidity located just above the weekly resistance at 1.7196. This target has now been reached, and the price is consolidating beneath the base of the reversal structure, signaling the potential for further downward movement. There is a likelihood of either liquidation or a downward impulse toward the 1.7100 - 1.7000 zone. The forex market has exhibited a relatively calm demeanor since the week's opening, allowing technical factors to dominate market behavior until fundamental influences come into play.
Key resistance levels: 1.7196, 1.7304
Key support levels: 1.7107, 1.7016
Interest lies in the areas just below the local lows; however, from a technical standpoint, the market is primarily focused on liquidity beyond the 1.6787 level. Given that there are no significant barriers beneath 1.7016, a break of this support would likely open up a clear path towards the next liquidity zone.
EurAud Sell limit bearishLiquidities are stacking on the sell side as marked by two days
Equal highs taken out targetting sell side , good RR
Sell limit on the rectangle marked

EUR/AUD - Reversal Incoming?
📉 *Reversal Incoming?*
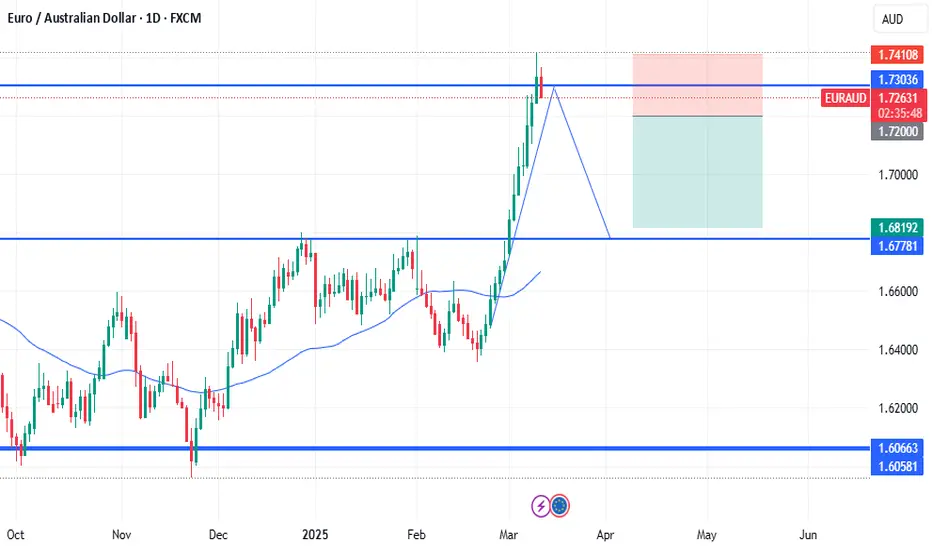
The EUR/AUD daily chart suggests a potential **bearish correction**, as price faces strong resistance after a sharp rally. Key insights:
🔹 **Resistance Zone**: The pair is struggling near **1.7330 - 1.7410**, a historically significant level.
🔹 **Rejection & Pullback**: A clear rejection could lead to a drop toward **1.6819 - 1.6780**, a previous demand area.
🔹 **Moving Average Factor**: The price is overextended from the 50-day MA, signaling a possible mean reversion.
🔹 **Risk-Reward Setup**: A short trade from the current level targeting **1.6800** offers an attractive risk-to-reward ratio.
💡 **Bearish Scenario**: If rejection is confirmed, EUR/AUD could slide to **1.6800** in the coming weeks.
⚠️ **Bullish Risk**: A breakout above **1.7410** may invalidate the short bias, leading to further gains.
📊 **Overall Sentiment: Bearish Reversal 🔻**
EURAUDFX:EURAUD
As you can see that EURAUD has created a Double top pattern and given a breakout in 15m Time frame so we can go for short side. Always go for pull back entries. So plan your trade accordingly...

Sell Trade - EUR/AUDPlace a Sell Trade on EUR/AUD :)
Check out my chart for the ideal sell entry, stop-loss placement, and target level (Blue line).
Remember --
Move SL to breakeven once the trade reaches 1:1.5 R.
Aim for a minimum reward of 1:2 R.
Don't risk more than 2.2% of your total margin.
Let's execute this trade smartly! 🚀

EURAUDThe EURAUD has shown a strong bearish pattern on the 4 hour chart. There is a small trading range indicating an exhausted market, with the resistance being broken.

EUR/AUD 4-Hour Chart AnalysisKey Observations:
1. Support Zone:
- The price is currently retesting a key support zone around 1.6540–1.6565, which previously acted as a demand zone.
2. Trendline Break:
- The uptrend has been invalidated with the break of the ascending trendline, suggesting a potential shift in momentum to neutral or bearish.
3. Key Levels:
- Resistance Above: Potential resistance can be seen near 1.6650–1.6700, in case of a bullish retracement.
- Support Below:
- 1.6359 (first support level).
- 1.6199 (major support).
- 1.6018 (long-term support zone).
4. Possible Price Movements:
- A bullish rebound from the current support zone or a bearish continuation if the price breaks below it.
---
Trading Scenarios:
1. Bullish Rebound:
- If the price holds above the 1.6540–1.6565 zone, it may attempt a recovery toward the previous highs.
- Entry: Above 1.6570
- Targets: 1.6650, 1.6700.
- Stop-Loss: Below 1.6530.
2. Bearish Breakdown:
- A decisive break below 1.6540 may open further downside toward the lower support levels.
- Entry: Below 1.6530.
- Targets: 1.6359, 1.6199, 1.6018.
- Stop-Loss: Above 1.6570.
---
- Wait for clear confirmation (e.g., a strong candle close) before entering a trade to avoid false breakouts.
- Use proper risk management with clearly defined stop-loss and take-profit levels.
---
**Disclaimer**:
This analysis is for informational purposes only and does not constitute financial advice. Trading involves substantial risk, and past performance is not indicative of future results. Always conduct your own research and consult a financial advisor before making investment decisions. Trade responsibly.

EUR-AUD | 4h | Swing Trading hello traders, i have prepared FX:EURAUD analysis for you. i have set my entry level, stop level and target level on the chart. all i ask from you is to support me with your likes. thank you to everyone who likes it.

EURAUD_H4As we said in the previous analysis, we reached the target 2 wave and it seems to fluctuate for the upper targets.

EUR AUD ANALYSIS Hello Traders,
Simply we got 1:8 RR
As I told you about EUR AUD pair market reacts from our level and gave us good rewards

EUR AUD ANALYSIS Hello Traders,
I shared this trade ideas on trading view. As you can see this trade is running good.
Follow me for more content related (Liquidity+SMC)

EUR AUD ANALYSIS Hello Traders,
As I gave you some level few hours ago market started falling from this level.
Follow me for daily trade ideas
See you guys 😊

EUR AUD ANALYSIS Hello Traders,
I am going to sell EUR AUD pair for short term.
Let's see what happens next

EURAUD TRADE IDEA // i'm looking for bearish in this trade euraud continue going down in daily timeframe and we can see there is a bearish channel in 1h timeframe and 4h timeframe and previous daily candle is hammer so we need to wait for breakout in bearish channel then we can sell

DOUBLE TOP PATTERN SHOWING ON EURAUD IN DALY TIMEFRAME EURAUD SHOWING A GOOD UP MOVE WITH 1:5 RISK REWARD
DUE TO THESE REASON
A.DOUBLE TOP PATTERN SHOWING ON EURAUD
its following a rectangle pattern that stocked the market
which preventing the market to move any one direction now it trying to break the strong resistant lable
B. after the break of this rectangle it will boost the market potential for break
C. also its resisting from a strong neckline the neckline also got weeker ald the price is ready to break in the outer region
all of these reason are indicating the same thing its ready for breakout BREAKOUT trading are follws good risk reward
please dont use more than one percentage of your capitalfollow risk reward and tradeing rules
that will help you to to become a bettertrader
thank you

EURAUD TRADE IDEA #EURAUD #EURUSD #GBPUSD we can see audusd is hedging to the up side so euraud may be go down and euraud 4hr trend is bearish so i look for bearish move

DOUBLE TOP EUR/AUDThe double top is a classic bearish reversal pattern. Picture it like this: the price peaks, falls back, peaks again at about the same level, and then declines. This pattern signals that the upward trend is likely over and a downtrend might be on the way.
Key aspects to look for:
Two Peaks: Price hits a high, drops, and then hits a similar high.
Support Level: The low point between the peaks forms a support level. A break below this level confirms the pattern.
Volume: Higher volume on the second peak and a decline confirms the bearish sentiment.

EUR/AUD ENTER after confirmation only do not rush the trade use proper stoploss
You
TRENDLINE BREAKOUT
Watching for trendline breakouts can be a thrilling part of trading. When the price breaks through a trendline, it can signal the start of a new trend or a significant move.
Here's what to look out for:
Volume Spike: A high volume can confirm the breakout.
Retest: Sometimes, the price comes back to test the broken trendline before continuing in the breakout direction. This retest can be a good entry point.
Other Indicators: Combine with other technical indicators like RSI or MACD for additional confirmation.

EURAUDI can see that the price can go to the lower swings in order to seek lqd.
You can plan on this perspective
OANDA:EURAUD
