EUR/USD Drops Sharply – Testing Key SupportOANDA:EURUSD has broken through a series of FVG zones from 1.1750 down to 1.1600, signaling dominant bearish control. The pair is now approaching a critical support zone around 1.1580–1.1600 — the last remaining FVG area that previously acted as a temporary bottom. This zone may trigger a short-term bounce or at least a consolidation phase.
The recent sell-off was driven by stronger-than-expected U.S. economic data (GDP, durable goods orders, PCE index) and reinforced expectations of a prolonged hawkish stance by the Fed. Meanwhile, the ECB has yet to deliver clear guidance on potential easing, leaving the euro vulnerable. The USD’s strength continues to apply downward pressure on EUR/USD with little resistance in sight.
EURUSD_SPT trade ideas

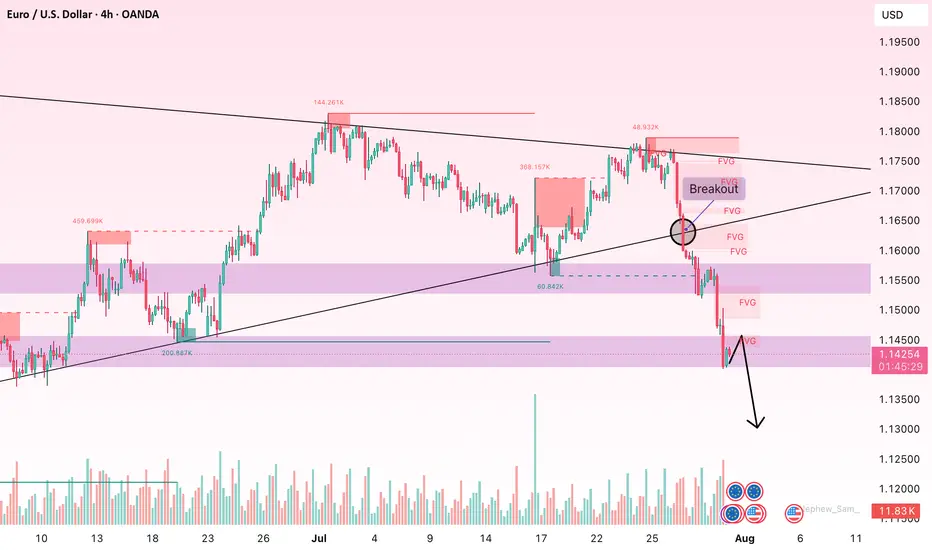
Downtrend Persists – Beware the Fake PullbackOn the 4H chart, EUR/USD remains under heavy selling pressure, with a clear downward trend and multiple Fair Value Gaps (FVGs) appearing as price slides from 1.1800 to the 1.1430 zone. The consistent formation of upper FVGs highlights an ongoing supply-demand imbalance, with sellers clearly dominating the market.
A minor bounce around the lowest FVG near 1.1420 may simply represent a technical pullback, testing a newly formed supply zone without indicating a trend reversal. The recent increase in volume during the last drop further confirms strong bearish momentum.
If EUR/USD retests the 1.1500–1.1550 area but fails to close a 4H candle above the upper FVGs, a continuation toward deeper levels such as 1.1350 or even 1.1200 remains likely.
EURUSD at risk of reversal: will sellers take control?Hello everyone! What are your thoughts on EURUSD?
Lately, the euro has been under pressure due to growing weakness in the Eurozone economy. The European Central Bank (ECB) has sent out more cautious signals in response to rising recession risks and cooling inflation. This increases the likelihood that the ECB may wrap up its tightening cycle earlier than the Fed – a shift that could weigh heavily on EURUSD.
From a technical standpoint, EURUSD recently hit a peak around 1.1766 after several attempts, and a CHOCH (Change of Character) reversal pattern may be forming. If the pair fails to reclaim the 1.1766 zone, a deeper downside scenario is likely to unfold.
As for me, I’m currently favoring short setups, especially around supply zones or after failed retests. Discipline and solid risk management remain my top priorities.
How about you? What’s your take on this pair?

EURUSDIn my previous post, I mentioned being in EUR/USD longs; however, I exited the position after the price action failed to align with my expectations. I anticipated a sweep of the recent low before a continuation to the upside.
Let’s now examine the EUR/USD on the 4H timeframe. As expected, the price took out the previous low, dropped into a key Demand Zone, and reacted with a strong bullish move. My targets remain the previous High, followed by the swing high marked by the red line. Let's wait and see what Monday brings.
With the DXY losing value, I expect the euro to appreciate—assuming no significant fundamental shifts occur. That said, if the price struggles to form a new high or a higher high (HH), I will reassess my bias accordingly.

EURUSD – Bullish momentum fades, signs of a reversal emergeEURUSD is approaching the key resistance zone at 1.1780, a level that has been rejected multiple times in the past. On the H4 chart, the pair remains firmly within a descending channel since early July, with several FVG zones stacked above—indicating growing selling pressure. The recent upside momentum is clearly weakening, raising the risk of a deeper pullback.
Market context:
– The US dollar continues to gain support from strong economic data, while the Eurozone lacks clear signs of recovery.
– Traders are holding their breath ahead of upcoming Eurozone inflation data and the US PCE report—events that could trigger significant moves.
Trade setup: If EURUSD fails to break above 1.1780, a drop toward the 1.1610 support zone becomes increasingly likely.

EUR/USD Trading Towards Previous Weekly High?Hello traders , here is the full multi time frame analysis for this pair, let me know in the comment section below if you have any questions , the entry will be taken only if all rules of the strategies will be satisfied. wait for more price action to develop before taking any position. I suggest you keep this pair on your watchlist and see if the rules of your strategy are satisfied.
🧠💡 Share your unique analysis, thoughts, and ideas in the comments section below. I'm excited to hear your perspective on this pair .
💭🔍 Don't hesitate to comment if you have any questions or queries regarding this analysis.

EURUSD: Bearish Breakdown in SightEURUSD is currently holding above the 1.173 support zone, but the bearish structure is becoming more evident. The downward trendline and nearby resistance have repeatedly rejected price rebounds.
If the support at 1.173 breaks, a sharp move toward the 1.168 target is likely — a key previous low.
Trend: Prefer SELL if a breakdown confirms – low risk, high potential.

EURUSD-Possible Reversal Forming After Extended DowntrendEURUSD has been in a strong downtrend, consistently respecting the short-term and long-term EMAs.
Recent Buy signals from SignalPro have appeared at the base, showing early signs of buyer interest.
The most recent Sell signal failed to continue the move lower — suggesting momentum may be fading.
🔍 Setup Structure:
Entry Zone: Watching for confirmation above 1.15510 (EMA breakout + structure shift)
Stop Loss: Below 1.15199 (beneath local swing low)
Target Area: 1.17224 — aligned with previous inefficiency and potential liquidity magnet
⚙️ SignalPro Insights:
Yellow caution zone (if it appears next) often precedes higher-probability directional changes.
Multiple signals have triggered near historical demand zones — aligning with possible institutional activity.
⚠️ This chart and analysis are for educational purposes only. Not financial advice. Past performance does not guarantee future results. Always conduct your own analysis and manage risk accordingly.

EUR/USD Under Pressure : Sell or Buy ? The EUR/USD pair remains under mild bearish pressure, hovering around the 1.1700 mark and extending its Thursday downtrend. Meanwhile, the US Dollar (USD) stays firm despite growing optimism over improving US-China relations. However, the ongoing tension between Trump and Powell continues to capture market attention.
In response to these developments, EUR/USD has stalled its previous rally. On the chart, the pair is forming a series of lower highs, moving within a narrowing wedge pattern. The 1.1600 level now emerges as the critical battleground between bulls and bears.
Do you think EUR/USD can successfully defend this support zone? Let us know your thoughts!

EURUSD: Will the monthly candle flip bullish or stay bearish?Hello traders , here is the full multi time frame analysis for this pair, let me know in the comment section below if you have any questions , the entry will be taken only if all rules of the strategies will be satisfied. wait for more price action to develop before taking any position. I suggest you keep this pair on your watchlist and see if the rules of your strategy are satisfied.
🧠💡 Share your unique analysis, thoughts, and ideas in the comments section below. I'm excited to hear your perspective on this pair .
💭🔍 Don't hesitate to comment if you have any questions or queries regarding this analysis.

EUR/USD: Bullish Structure Faces Final Boss at 1.1800After a swift rebound from early-July’s fair value gap (FVG), EUR/USD is now locking horns with the 1.1800 level – a psychological barrier that has twice denied upside momentum since June. The pair maintains a bullish market structure, with demand zones being consistently respected and previous FVGs efficiently filled.
But here’s the catch: 1.1800 has been a graveyard for breakout attempts, and bears have proven they’re not giving in without a fight. Traders now face a strategic conundrum: chase the breakout and risk slippage, or re-enter on a potential pullback toward the next FVG?
The next few sessions could define directional conviction for August. Stay agile – and let price lead.

EUR/USD: A Fragile Rebound Within a Broader Bearish TrapEUR/USD has managed to stage a slight recovery after plunging through the key 1.1680 support — a level that had held firm for two weeks. The pair is now hovering just above 1.1500, but the bounce appears shallow and unconvincing. Volume remains low, momentum indicators offer little confirmation, and the broader structure still points to a prevailing downtrend.
On the H2 chart, price has rebounded from the 1.1505 area — a minor support formed during July's short-term consolidation. Yet, the EMA slope remains strongly negative, and RSI is struggling below the neutral 50 mark after exiting oversold territory. The structure continues to display classic lower highs and lower lows, with the 1.1585–1.1600 zone emerging as a potential resistance area for bears to re-enter.
From a macro perspective, the U.S. dollar remains supported by expectations that the Fed will maintain a hawkish stance, fueled by solid GDP, durable goods, and PCE data. In contrast, the Eurozone struggles with signs of stagnation, with both services and manufacturing PMIs deteriorating — most notably in Germany. This policy divergence continues to favor the greenback.
Unless bulls manage to decisively reclaim the 1.1600 zone with strong follow-through buying, any rebound risks being nothing more than a dead cat bounce. The downside target remains near 1.1460 – 1.1440 in the near term.

EURUSD: Short-term rebound signals after sharp dropEURUSD has just reacted to a key demand zone and is showing signs of a technical rebound. A small double bottom pattern is forming on the 3H chart, indicating that buyers are starting to return. If the price holds above this recent low, the short-term bullish scenario could continue.
On the news front, the US JOLTS data came in lower than expected, reflecting a cooling labor market. This reduces the likelihood of further Fed tightening, creating room for the euro to recover slightly.
Strategy: Favor buying if price remains above the support zone, with a potential move to retest the upper FVG area before the market makes its next decision.

Lower Highs in Play – Reversal Risk IntensifiesEUR/USD is showing signs of weakness after failing to hold above the 1.1780 level. The market structure on the H4 timeframe is shifting toward a short-term downtrend, highlighted by a clear sequence of lower highs. The most recent rebound was rejected at an unfilled FVG zone, indicating that buying pressure is no longer strong enough to sustain the previous uptrend.
Currently, the pair is heading toward the ascending trendline near the 1.165x area. A breakdown below this zone would invalidate the medium-term bullish structure and open the door for a potential drop toward the 1.158x region — a key FVG support that also marked the bottom of the June retracement.
A series of bearish FVGs has emerged as price consistently fails to reclaim old resistance levels, reinforcing the idea of distribution in play. Sellers are now in control of the short-term direction, especially if the 1.172x zone fails to hold during any upcoming pullback.

EUR/USD May Fill the Gap Before Resuming Its TrendFollowing a steady recovery from the 1.1600 low in mid-July, OANDA:EURUSD has been carving out a short-term bullish structure, leaving multiple Fair Value Gaps (FVGs) behind. However, current price action around the 1.1750 level signals hesitation, as the pair repeatedly tests the resistance near 1.1780–1.1800, creating a new downside FVG in the process.
Technically, the presence of an unfilled FVG near 1.1720 suggests the market could temporarily pull back to close this gap before continuing its broader trend. Despite this, the pair remains within a consolidation range, awaiting new macroeconomic drivers—particularly Eurozone inflation data and potential Fed commentary later this month.
For now, traders should watch for a dip toward 1.1720 as a healthy technical correction rather than a trend reversal.

EURUSD: The Rally Was Just a Trap – Bears Are Ready to Strike!After a strong rebound toward the 1.18400 zone driven by short-term optimism, EURUSD is now facing a potential reversal as price stalls within multiple Fair Value Gap zones. The chart reveals weakening bullish momentum, with lower highs forming inside a key resistance area.
Fresh U.S. data: Jobless claims dropped more than expected, giving the USD a solid boost. Meanwhile, the ECB remains hesitant, showing little conviction as Eurozone inflation cools.
A bearish scenario is unfolding: price forms a flag pattern → breaks the ascending channel → targets 1.17300. A break below this level could send EURUSD toward 1.16500 or even lower.
Bulls, beware! This could be a bull trap — and the bears are gearing up for a counterattack.
SELL setup: Look for bearish reversal signals around 1.18300–1.18400. Stop-loss above the high, first target at 1.17300.

EUR/USD Extends Rally Toward 1.18 as Bulls Maintain MomentumThe euro continues its upside correction, pushing toward the psychological resistance at 1.1800, driven by sustained USD weakness and improving risk sentiment ahead of the ECB and Fed events this week.
Markets are positioning cautiously before key US economic data and Powell’s speech. The dollar remains under pressure amid declining yields and expectations the Fed may adopt a more dovish tone if growth shows further signs of moderation.
Technically, EUR/USD has broken above previous supply zones and is filling fair value gaps (FVGs) on its way up. Price is now testing the upper boundary of the FVG at 1.1780–1.1800. Several demand FVGs below (1.1700, 1.1650, 1.1600) are providing strong bullish structure support. Volume spikes on the recent breakout suggest institutional interest.
Key levels to watch:
Resistance: 1.1800, 1.1850
Support: 1.1720, 1.1650, 1.1600
The short-term bias remains bullish. A clean breakout above 1.1800 could open room toward 1.1850–1.1900. Failure to hold above 1.1750 may trigger a retest of lower FVG zones, but broader trend favors buyers.

EUR/USD Poised for Breakout as Compression BuildsOANDA:EURUSD is coiling tightly within a narrow range, with price action showing signs of reduced volatility and declining volume. On the H4 chart, Ichimoku cloud forms dynamic resistance around 1.1625–1.1645, while an unfilled Fair Value Gap indicates supply is present but weakening.
This compression suggests a strong breakout could be imminent. A confirmed move above 1.1650 would likely trigger bullish momentum toward the 1.1750 zone. Traders should prepare for volatility as the “calm before the storm” may soon give way.

EUR/USD Poised for a Rebound After Testing Liquidity PocketsThe EUR/USD pair has shown signs of reversal after dipping into low-volume territory near the bottom of the volume profile. The recent bullish candle breaking above the prior bearish FVG indicates returning buying interest. Price rejection at the Kumo boundary also suggests that selling pressure is fading.
Technically, Ichimoku cloud support remains intact, with a thin and flat structure that typically precedes consolidation or bounce setups. Notably, price has failed to form a new low, hinting that demand might be building from deeper liquidity zones.
As long as EUR/USD holds above 1.0880, a move towards 1.0945–1.0955 remains on the table. Traders should monitor how price reacts to this reclaim of structure – it could spark a broader retracement.

EUR/USD Nears Resistance – Breakout or Bull Trap?The EUR/USD is approaching the critical resistance zone at 1.1690–1.1705 following a steady recovery from the 1.1530 low. From a technical standpoint, buyers currently hold the upper hand as the pair pushes above the 2H Ichimoku cloud and begins filling the previous fair value gap.
Nonetheless, the bullish momentum remains fragile. The Tenkan and Kijun lines have yet to form a bullish crossover, and the Chikou Span still lingers within the price zone—indicating potential exhaustion. The 1.1700–1.1710 region, which previously acted as a major distribution top, could once again serve as a rejection point.
A short-term pullback to the 1.1640 support remains a plausible scenario before the next directional move unfolds. Only a firm close above 1.1710 would open the door to a broader rally toward the 1.1750–1.1780 zone.

EUR/USD breaks key trendline – Is a bearish reversal underway?At the start of the week, the EUR/USD pair has officially broken its months-long upward trendline, signaling a potential short-term bearish reversal.
As of now, EUR/USD is trading around 1.169, performing a retest of the broken trendline. If the pair closes below this key level, it may confirm the breakout and open the door for a deeper decline.
Do you agree with my view?


EURUSD technical outlook – Can bulls reclaim 1.1800?OANDA:EURUSD is moving within a clearly defined bullish channel, with price action consistently reacting accurately at both the upper and lower boundaries. This momentum suggests that buyers are in control, setting the stage for further upside.
The price recently broke above a key resistance zone and is now returning to retest this area, a familiar move before further upside if the trend is indeed solid. If this zone holds as support, the upside could continue to push towards the 1.18000 target, which makes sense based on this setup.
However, failure to hold this level could invalidate the bullish scenario and increase the likelihood of a deeper pullback.
Therefore, traders should closely observe the price reaction and look for clear confirmation before entering a trade. And as always, always trade with a clear strategy and strict risk management.

EUR/USD Elliott Wave Update –Classic Wave 5 Breakout Opportunity
This chart of the EUR/USD pair shows a well-structured Elliott Wave impulse pattern unfolding on the 4-hour timeframe. The price action is currently progressing in the final Wave (5) of the impulse cycle, which typically represents the last bullish leg before a larger correction begins.
Wave (1): The initial move up from the bottom (early May), showing a clean 5-wave internal structure.
Wave (2): A healthy retracement after Wave 1, forming a base for further upside.
Wave (3): The strongest and steepest rally, as expected in Elliott theory. It broke past previous highs and extended sharply.
Wave (4): A corrective phase that formed a falling wedge pattern — typically a bullish continuation pattern.
Wave (5): Currently in progress. The wedge has broken to the upside, confirming the potential start of Wave 5.
Target 1 (T1): 1.18306
Target 2 (T2): 1.19012
Stop Loss (SL): 1.16600
After a strong uptrend, the market went sideways in a wedge pattern (a typical wave 4 behavior). It has now broken out, signaling the start of the final wave 5 move. This is often a strong and sharp push. Since the breakout is clean and the Elliott wave count aligns well, this creates a favorable long opportunity.
