Nasdaq- Weekly - Looks over bought• On the weekly US 100 chart, the recent candle structure shows a clear loss of momentum near all-time highs. The shooting-star type candle near 26,000 indicates rejection from higher levels, meaning supply is emerging where demand earlier dominated.
• After this rejection, weekly price action has started forming lower highs and lower lows. This is typically the first technical signal that the market is shifting from trending to corrective mode, not a trend reversal but a pause or reset.
• The marked weekly support around 23,850 is crucial. If this zone fails to hold on a closing basis, historical price behaviour suggests a deeper move towards the rising long-term trendline, which mathematically aligns with a 15–20 percent correction from the top.
• In the previous similar setup during early 2025, US 100 corrected around 17–20 percent before resuming its broader uptrend. The structure, momentum loss and distance from the trendline then are very similar to what we see now.
• Weekly RSI has slipped below the 60 zone after staying elevated for a long period. In strong bull phases, RSI holds above 60; when it breaks below, markets usually enter a corrective or consolidation phase. RSI moving towards the 40–45 zone would be consistent with a healthy bull-market correction.
• Volume during the recent upside move has not expanded meaningfully, suggesting lack of aggressive fresh buying near highs. Corrections often begin quietly when strong hands distribute and weak hands are still optimistic.
• From a valuation angle, the Nasdaq 100 trailing P/E is currently around the mid-30s.
– 1-year perspective: valuations are higher than average, indicating mild over-valuation.
– 2-year perspective: P/E is still above its median, suggesting limited valuation comfort.
– 3-year perspective: valuations are slightly stretched but not extreme.
– 5-year perspective: current P/E is above long-term averages, but far below bubble-era extremes.
Overall, the index is not cheap, not in bubble territory either, but priced high enough that corrections tend to feel sharp.
• Combining price structure, momentum and valuation, a 15–20 percent correction looks technically reasonable and historically normal within a long-term uptrend.
• This observation is purely for learning and market understanding. There is no intention to spread fear or negativity in the community. Corrections are part of healthy markets and help reset excess optimism.
• Emotion management during such phases is critical. Avoid over-watching charts, reduce position size if volatility affects decision-making, stick to predefined risk rules, and remember that corrections are temporary phases, not permanent damage. Markets reward patience far more than panic.
What traders are saying

NAS100 – Range extension Play from discount area.🔍 Market Context
Nasdaq is currently reacting from a discount area with confluence from the 24700 support zone and the lower trendline support. Price has shown signs of holding this level, indicating a potential bullish pullback toward premium levels.
📘 Trade Idea (Long Bias)
Entry: 24700
Stop-Loss: 24550 (below structural support + trendline)
Take-Profit Targets:
TP1: 25000
TP2: 25175
This setup anticipates a reaction from the discount zone back toward equilibrium and previous supply levels.
📌 Notes
Confluence of discount pricing, trendline support, and horizontal support increases probability.
Structure remains bearish overall, so this is a counter-trend pullback long—manage risk accordingly.
⚠️ Disclaimer
For educational purposes only. Not financial advice. Follow for more ideas.

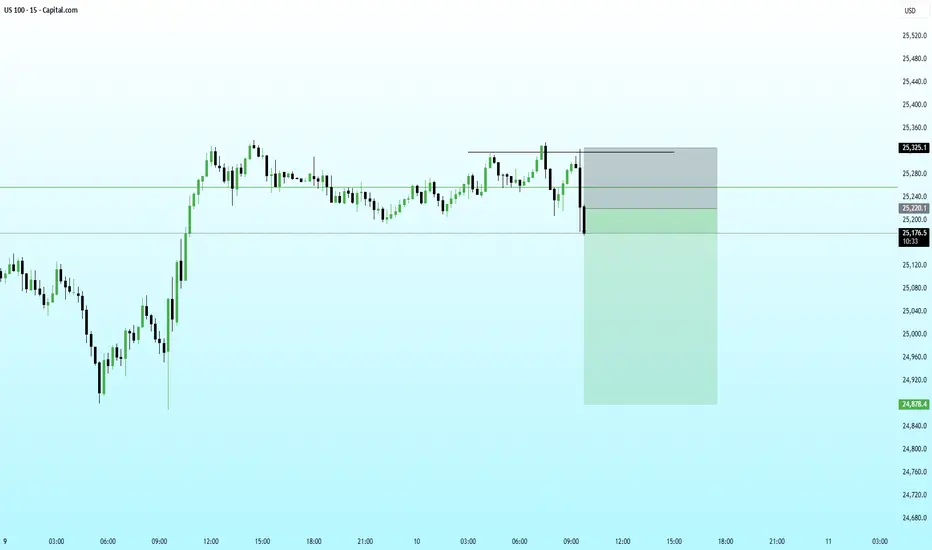
US100 | 15MNarrative Overview:
Following an aggressive sell-side liquidity raid, price delivered a reactive displacement from a higher-timeframe demand cluster, signaling the presence of institutional buy orders defending discount pricing. The rejection wick into the demand zone suggests a classic liquidity engineering event rather than genuine bearish continuation.
Market Structure:
The broader intraday flow remains rotational; however, the recent reaction establishes a potential short-term structure shift. The failure to achieve sustained acceptance below the demand zone implies seller exhaustion and the likelihood of a mean reversion toward premium.
Liquidity Map:
Sell-Side Liquidity: Resting below 25,250, now partially mitigated after the sweep.
Internal Liquidity: Compression above current price indicates stop accumulation from early longs.
Buy-Side Targets: 25,380 to 25,420 aligns with prior distribution and inefficient pricing.
Imbalance & Order Flow:
The impulsive bullish candle emerging from the zone created a micro fair value gap, reinforcing the probability of algorithmic repricing higher. When displacement originates from discount, it often signals smart money transitioning from accumulation to expansion.
Trade Logic:
The optimal execution model favors continuation toward premium, provided price maintains acceptance above the reclaimed demand.
Bullish Path:
A controlled retracement into the imbalance or the upper boundary of demand could offer refined entries targeting external liquidity. This would complete a discount-to-premium delivery cycle.
Risk Scenario:
A decisive break with displacement below the demand zone would invalidate the accumulation thesis and expose deeper sell-side liquidity, likely inviting bearish continuation.
Key Insight:
What appears to be a simple bounce is structurally more significant; institutions rarely defend a level without intent. Monitor how price behaves during pullbacks. Strong markets do not revisit deeply mitigated demand unless distribution is underway.

NASDAQ SHOWING A GOOD UP MOVE WITH 1:8 RISK REWARD NASDAQ SHOWING A GOOD UP MOVE WITH 1:8 RISK REWARD
DUE TO THESE REASON
A. its following a rectangle pattern that stocked the market
which preventing the market to move any one direction now it trying to break the strong resistant lable
B. after the break of this rectangle it will boost the market potential for break
C. also its resisting from a strong neckline the neckline also got weeker ald the price is ready to break in the outer region
all of these reason are indicating the same thing its ready for breakout BREAKOUT trading are follws good risk reward
please dont use more than one percentage of your capitalfollow risk reward and tradeing rules
that will help you to to become a bettertrader
thank you

US100 (Nasdaq) – Structure & BiasPrice is currently trading inside a well-defined consolidation range, capped by a major resistance zone near 25,850–25,900 and supported around 25,230–25,250, which has acted as a strong demand flip multiple times.
The recent price action shows:
A liquidity sweep to the downside, followed by a sharp bullish reaction, indicating smart money absorption.
Price reclaiming the mid-range level, suggesting buyers are regaining short-term control.
Compression near support, often a precursor to expansion.
The projected path indicates a minor pullback or sideways consolidation, followed by a bullish continuation toward the upper resistance band. Structure favors upside as long as price holds above the marked support zone.
Key Levels
Support: 25,230 – 25,250
Mid-range equilibrium: ~25,300
Target / Resistance: 25,850 – 25,900
Bias
🟢 Bullish continuation, provided price maintains above the demand zone.
A clean breakout above consolidation could trigger momentum-driven expansion toward the highs.

NAS-M15 BearishUS100 (Nasdaq) has just completed a **buyside liquidity sweep** above the prior intraday highs, followed immediately by **sharp rejection and bearish displacement**, signaling classic ICT-style distribution at premium.
The move above the highs was not acceptance but **engineered inducement**. Price briefly traded into premium to trigger breakout participation and stop orders before reallocating inventory aggressively to the downside. The lack of sustained continuation above the highs confirms **failed buyside delivery**.
Key orderflow observations:
• **Liquidity Event:** External buyside liquidity was efficiently taken above the range high, with no meaningful follow-through.
• **Displacement:** The impulsive bearish candle off the highs confirms institutional intent to reprice lower.
• **PD Array Context:** Rejection occurred at premium, aligning with prior intraday supply and equilibrium imbalance.
• **Narrative Shift:** Buyside objectives are now satisfied, increasing probability of a draw on sellside liquidity below.
From an ICT framework, this price action reflects **distribution after accumulation**, not trend continuation. The market is now poised to seek sellside liquidity resting beneath the recent range, with downside delivery favored as long as price remains below the swept highs.
**Execution Framework:**
Short-side bias remains valid on retracements into premium or any partial rebalancing of the bearish displacement.
**Invalidation:** Sustained acceptance above the swept highs would negate the bearish premise and imply higher buyside objectives.
Until proven otherwise, expect algorithmic delivery to favor **sellside liquidity below 25,000**, where inefficiencies and resting stops remain exposed.
This is not weakness.
This is **intent**.
US100 (Nasdaq) – Intraday Short Setup | Smart Money Concept 🔍 Market Context
Price is currently trading near a strong premium supply zone with multiple confluences:
Previous Liquidity Sweep
Bearish BOS + CHoCH
Descending Trendline Resistance
Premium pricing zone (OTE area)
This indicates institutional selling pressure and a high-probability short opportunity.
🧠 Technical Confluence
Liquidity grab above highs
Break of Structure (BOS) → Bearish
CHoCH confirming trend shift
Premium Supply Zone respected
Trendline acting as dynamic resistance
Entry from Discount → Premium retracement
🎯 Trade Plan
Bias: Short
Entry Zone: 25,300
Stop Loss: 25,458
Targets:
TP → 24,950
Risk : Reward: ~1 : 2+
📌 Execution Logic
Wait for:
Bearish confirmation candle
Rejection from supply + trendline
Lower timeframe CHoCH for sniper entry
No FOMO trades. Patience = Profit.
Disclaimer: Educational purpose only.

Nasdaq trade breakdown US Tech 100 (NASDAQ) – Intraday Bias & Supply Zone Reaction
Price has rallied into a key supply zone near the day high, where selling pressure is expected.
Overall higher-timeframe bias remains bearish (Daily & H4), while H1 shows a short-term bullish retracement into supply.
📌 Key Observations
Strong rejection zone marked as supply
Price reacting near Day High
Bearish structure intact on Daily & H4
Lower-timeframe bullish move seen as a pullback
📉 Trade Expectation
Look for rejection / consolidation inside supply
Possible lower-high formation
Continuation move expected to the downside after confirmation
⚠️ Wait for price action confirmation before entry.
Risk management is essential.

Trump Is More Volatile Than the MarketsIf you truly want to understand the stock market today, study Trump first.
If you understand Trump, you’ll start understanding everything else in the markets.
Why this is the BEST time to learn markets?
This phase forces you to understand how markets really work, not just charts:
Geopolitics (US–China, Russia, Middle East, Taiwan)
Tariffs & trade wars (pricing power, supply chains)
AI war & capex cycles (winners vs obsolete models)
Inflation vs deflation tug-of-war
Interest rates & rate-cut expectations
Currency wars (USD strength, EM pressure, capital flows)
Energy & commodities (oil, metals, food inflation)
Fiscal deficits & government debt
Liquidity cycles (QE, QT, risk-on vs risk-off)
Corporate earnings vs valuations
Buybacks vs real investment
Market psychology (fear, greed, narratives)
Policy uncertainty & sudden reversals
Global capital rotation (US ↔ EM ↔ commodities)
This is not a normal market.
This is a learning laboratory.

US 100 - High time frame liquidity sweep + bullish reversal🔎 Description
US100 has tapped into a major demand zone after a sharp downside sweep, collecting liquidity below previous swing lows. Price has reacted strongly from the confluence of:
HTF ascending trendline support
4H demand block
Liquidity sweep + aggressive rejection wick
Fair value gap alignment
The structure suggests a potential bullish corrective leg as long as the demand zone holds.
📝 Trade Idea
Bias: Long (Counter-trend corrective move)
Entry: 25,163 (Reaction zone already tested)
Stop-Loss: Below liquidity sweep low – 24,880
Take-Profit Targets:
TP1: 25,472 (FVG + minor resistance)
TP2: 25,700 (Major supply zone)
TP3: 25,790 (HTF liquidity)**
Risk-to-Reward: ~1:2+
Disclaimer: For educational purpose

NAS100: Bearish Rejection at Local Supply – Target 24,900The NAS100 (US100) is showing signs of exhaustion after its recent attempt to recover from the late-January dip. We are observing a clear Lower High formation on the 4H timeframe, suggesting that the broader bearish momentum is resuming.


#US100📈 US100 Technical Outlook – Corrective Phase in Play
After completing its 5-wave impulsive structure, US100 has entered its corrective phase.
• The A wave began in October 2025 and concluded on 21 Nov 2025.
• The index then started rising in its B wave, retracing more than 61.8%, which signals the development of a flat correction.
🔹 Structure of the B Wave
• The A sub-wave unfolded in 5 smaller waves, indicating a zig-zag formation.
• Since A retraced less than 61.8%, the current rise is part of the C sub-wave.
• A parallel channel projection suggests the C wave could extend towards 26,800–27,000.
⏳ Timing Consideration
• The A sub-wave lasted 13 days.
• By proportion, the C wave could stretch up to 21 days, implying a potential 2-week bullish run.
⚠️ Risk Management
A prudent stop-loss around 25,000 is advisable while tracking this move.

#NAS100 Sell Trade Setup.Here’s an up-to-date NAS100/USD Sell trade outlook (technical + fundamental) to help you assess whether positioning for a Downside makes sense right now.
Thank You......

Nasdaq 100 soon to see life time High, Educational ContentNasdaq 100 buyside liquidity target, Nasdaq Looking to make Lifetime high

MAJOR INDEX OUTLOOK | NASDAQ (US100) Market Structure Update Global indices are currently approaching critical decision zones, and NASDAQ (US100) is showing a
notable shift in short-term market sentiment.
After a prolonged corrective phase, the H1 time frame now confirms a bullish structural transition —
price is forming Higher Highs and Higher Lows, indicating that buyers are gaining short-term control.
However, the index is now testing a major resistance zone near 26,000 — a psychological level combined
with historical supply pressure.
This is a decisive area.
Key Technical Levels
🔺 Major Resistance:
26,000 (Psychological Level)
26,150 (Recent Swing High)
🔻 Immediate Support:
25,750
🔻 Structural Support:
25,600
Scenario 1: Bullish Breakout Continuation
A strong H1 candle close above 26,050 could trigger continuation momentum.
Upside Targets:
➡️ 26,200
➡️ 26,350
A breakout followed by a clean retest of 26,000 as support would offer higher-probability confirmation.
Scenario 2: Bearish Rejection
If price fails to sustain above 26,000–26,050 and prints rejection wicks or bearish confirmation,
a corrective pullback may follow.
Downside Targets:
➡️ 25,750
➡️ 25,600
Lower-high confirmation on M15 would strengthen the rejection case.
Market Note
NASDAQ is highly volatile during impulsive phases. Entering directly into resistance without
confirmation increases risk exposure significantly.
Disciplined execution and controlled position sizing remain essential.
Current Bias: Short-Term Bullish (Caution at 26,000 Resistance)
The reaction around 26,000 will likely determine the next 150–300 point directional move.
#NASDAQ #US100 #IndexTrading #MarketStructure #ForexAnalysis #TechnicalAnalysis #MustProfitFX
Disclaimer: This content is for educational purposes only. Trading involves significant risk.

Update on NASDAQ BULLISH BIAS IDEA.This is how market respects the zone and levels.
I don't share signals and dreams , I share clarity and ideas for you to focus on.

NASDAQ bullish bias on HTF and ITFThe price is currently reacting to THE DAILY FAIR VALUE GAP , which is a good confluence for bullish and long clarity, as the dollar continues to freefall , we can consider the relative strength between the index and the currency to support our long idea.
The closest target would be the recents 4 hour highs.
Wait until 9:30 openin for any manipulation to frame our trade.
Invalidation :- closing below the (dfvg)

Nasdaqrisk to reward if good worth taking risk, looking at the geopolitical tension most likely to fall like water

US100 📌 Trade Idea
US100 has tapped into the discount zone and swept a weak low, reacting strongly from a higher-timeframe demand region. The price is consolidating inside a falling wedge, and each downside push is being aggressively rejected, showing exhaustion of sellers.
A clear CHoCH attempt is visible, and with multiple imbalances above along with a clean supply zone, the index is setting up for a corrective bullish move toward premium pricing.
🔍 Key Confluences
Weak Low Taken: Liquidity sweep below 25,000
Price in HTF Discount: Strong demand zone + imbalance
Falling Wedge Pattern: Typical reversal structure
Multiple Rejection Wicks: Buyers defending the same level repeatedly
FVG/Open Imbalance Above: Large inefficiency toward 25,300–25,450
EQ + Supply Zone: Clean target region where sellers previously initiated moves
📈 Long Setup
Entry Zone: 25,000 – 25,050
Stop Loss: Below discount zone → 24,840
Take Profit 1: 25,250 (first FVG fill)
Take Profit 2: 25,380 (mid-structure inefficiency)
Take Profit 3: 25,460–25,580 (major supply & EQ zone)
Risk-Reward: 1:2 to 1:3 depending on entry
Bias: Short-term bullish retracement inside a larger downtrend
Disclaimer: Educational Purpose Only

NAS100 buy setupThere is a good opportunity to go long in Nas100, if it gets LTF confirmation then it will be great, always keep your risk under control.

US100 LONG SETUP — “Major Liquidity Sweep Into Demand US100 has aggressively dropped into a major higher-timeframe demand zone, sweeping liquidity below previous lows and tapping into a strong bullish reaction block. This move also aligns perfectly with the rising trendline support from recent structure.
The sharp sell-off looks like a liquidity grab / stop-hunt, making this a high-probability long setup.
Description:
Price broke down impulsively and cleared all buy-side liquidity sitting below 25,350–25,300 levels. After the sweep, US100 has entered a clean demand zone highlighted in red, which was a strong origin of previous bullish expansion.
This is a classic smart-money setup:
✔ Liquidity sweep
✔ Entry in demand
✔ Trendline confluence
✔ Price in deep discount
A bullish reversal from here is highly likely if buyers defend this zone.
Trade Plan (Suggestive)
Entry Zone: 25,230 (inside the demand zone)
Stop Loss: Below demand zone at 25,080
TP1: 25,550
Risk–Reward: ~1:2

US100 – Rejection From Discoun Zone + Trendline TapBias: Bullish Reversal (Counter-Trend Move Toward Premium)
Strategy Basis: SMT / Premium–Discount / Liquidity Sweep
📖 Trade Idea Description
US100 has tapped into a higher-timeframe ascending trendline support after delivering a sharp sell-off. Price swept the recent sell-side liquidity, reacted from the discount zone, and instantly showed strong bullish displacement.
This rejection aligns perfectly with:
✔ Retest of previous demand zone
✔ Liquidity grab below equilibrium
✔ Rejection wick forming bullish orderflow
✔ Discount pricing inside the PD Array
✔ Premium to discount rebalancing setup
Price has now reclaimed structure and is respecting the trendline, indicating possible continuation higher toward the premium zone.
🟢 Long Setup
Entry: 25,152 (after trendline rejection)
Stop Loss: Below discount zone – 24986
Take Profit: 25,500 (mid-range liquidity
🎯 Trade Narrative
Market has entered a deep discount after taking out major liquidity. The violent wick gives a clue that smart money stepped in. As long as price sustains above the demand + trendline, we anticipate a bullish push toward the imbalance and premium area.
This setup remains valid as long as price holds above the trendline and discount block.
For Educational purpose only.
