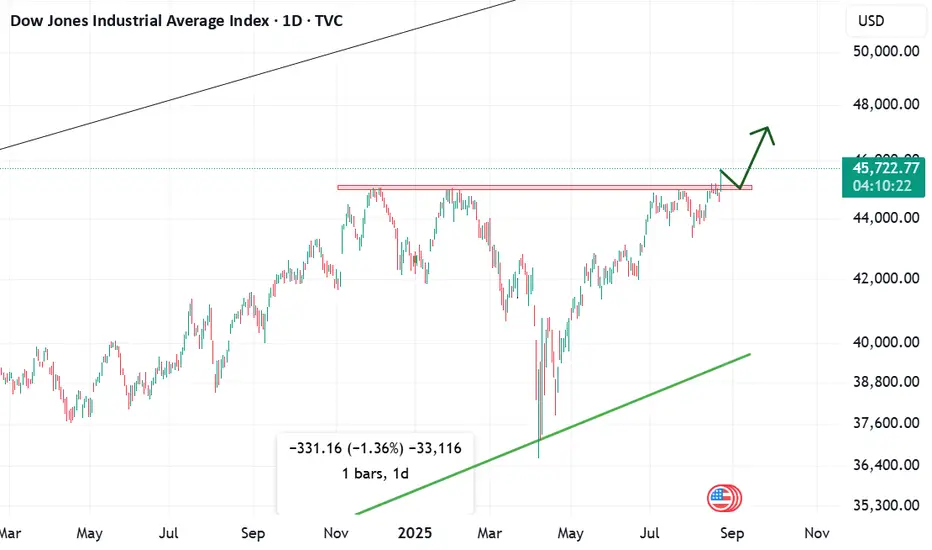
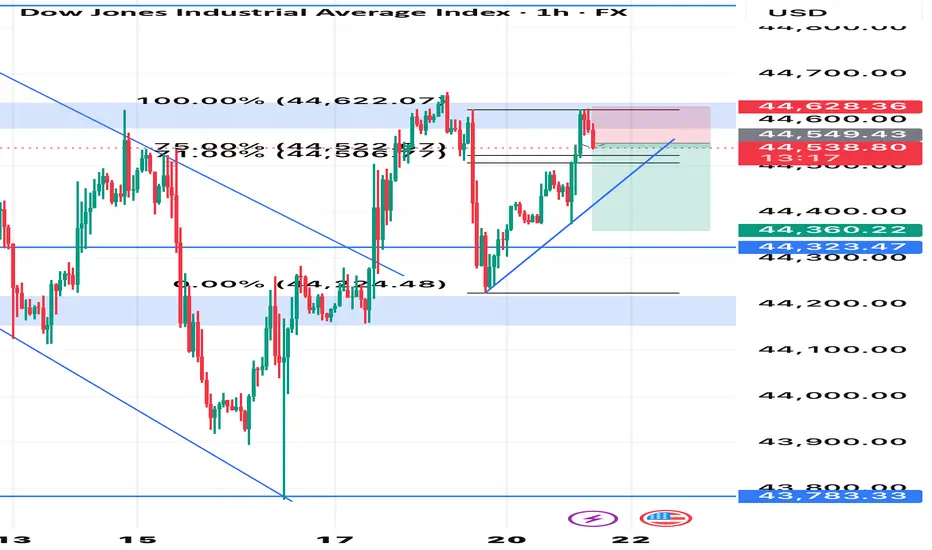
Chart Analysis - Dow Jones (Breaking Important Resistance)The US30 index has successfully broken through an important resistance level today, which is a key technical development. This breakout suggests the potential beginning of a strong bullish trend, provided the index is able to sustain itself above the red zone. If it continues to hold above this zone
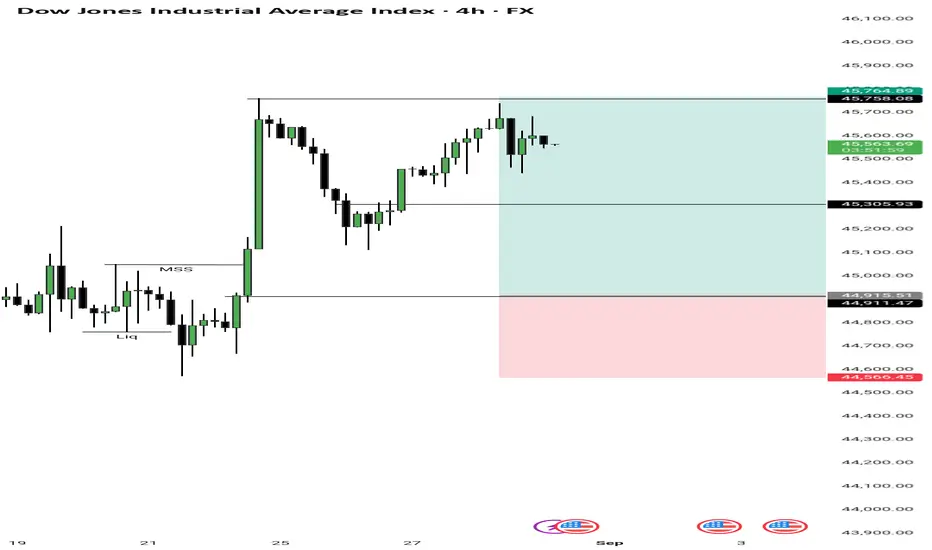
Dow Jones (DJI) – 4H Chart AnalysisMarket Structure:
Price grabbed liquidity (Liq) below recent lows.
A Market Structure Shift (MSS) occurred, confirming bullish intent.
Price rallied strongly after liquidity sweep, indicating smart money accumulation.
Entry Zone:
Entry placed near 45,305.93 (demand zone after MSS).
This align
DOW JONES AT BIG BREAKOUTInverted Head and Shoulders Pattern Breakdown on Dow Jones (DJIA)
Trend Overview:
The Dow Jones has been in a downtrend before the formation of the Inverted Head and Shoulders pattern. The price shows clear signs of reversal after several months of decline, indicating a potential bullish trend.
P

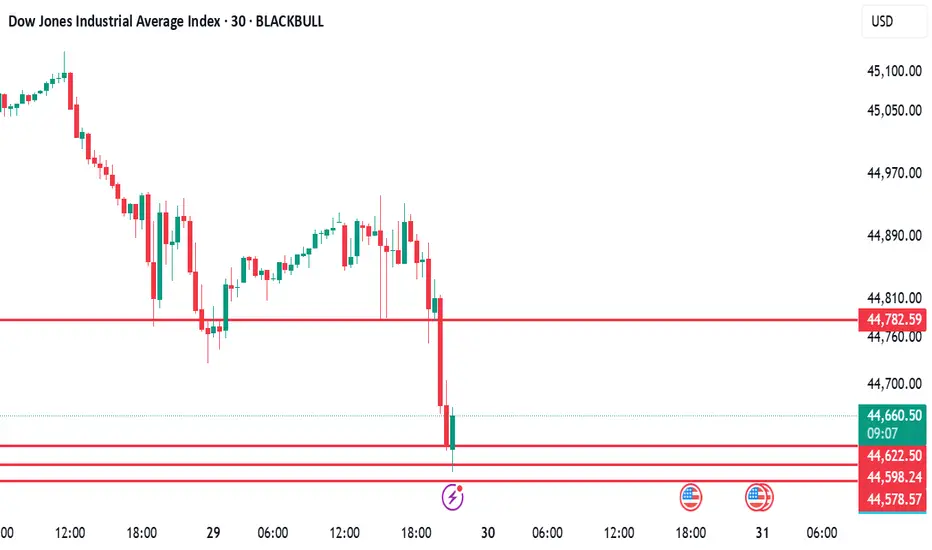
US30 Bullish ViewUS30 shows signs of strong bullish momentum, with buyers stepping in at lower levels. As long as the current support holds, we expect an upward move towards the target of 44,135 in the coming sessions
📈 Trend: Bullish
🎯 Target: 44,135
US30 Intraday View – Bullish MomentumUS30 is showing strong upward momentum and is expected to continue its bullish trend in the upcoming session. Based on current price action and technical indicators, I expect the index to move up towards the target of 44,753.
Resistance/Target: 44,753
Bias: Bullish
Timeframe: Intraday/till tomorrow
Potential sell side bias on US30Looking at a potential short position on US30, technicals confirming sell side trade while the day’s New York session move was bullish. Looking to enter shorts post confirmation.
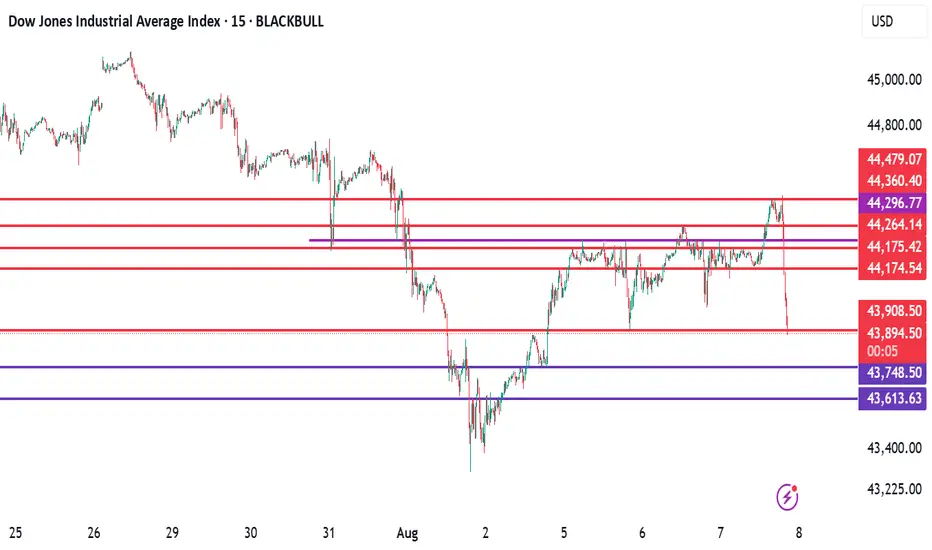
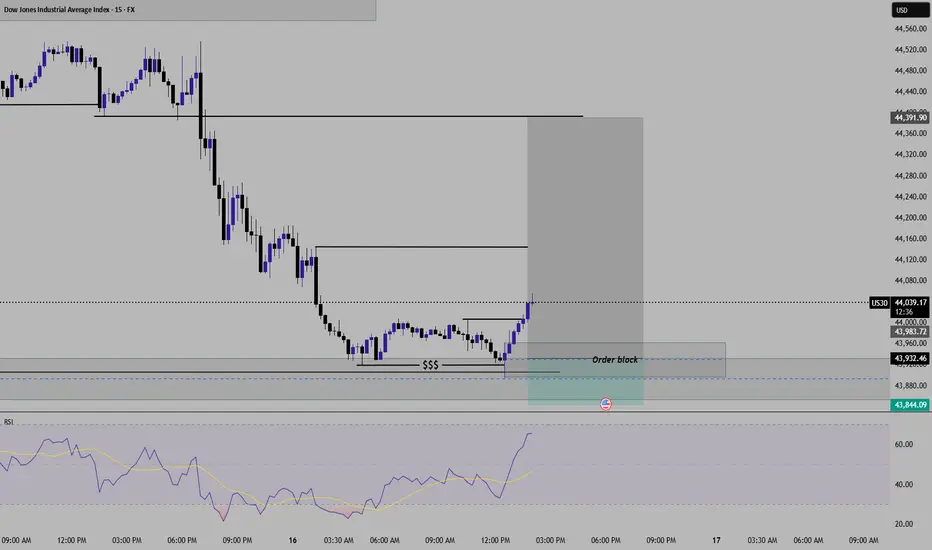
US30 Analysis for smaller time frameUS30 Buy setup With HTF Liquidity Grab Confirmation and lower time frame Entry module.
Buy @ 43925
Stop loss @43845
1st Target - @44140
2nd Target - 44390
(This publication is only for education purpose. consult your financial advisor before any investment)
US30 potential for the upsideLooking for US30 to push to the upside upon the retest of the recently created 4h/1h demand zone.Use proper risk management should you join me.

DOW JONES 30 on Weekly ATH Breakout ... Next 1 Year is BullishDOW JONES 30 on Weekly ATH Breakout ... Next 1 Year is going to be super Bullish.
All Good news will start flowing - Interests rate cuts / End of long ongoing Wars / Peace in World / GDP growth.
'Yahi samay hai, sahi samay hai...Bharat ka anmol samay hai': PM Modi recites thought-provoking poem on

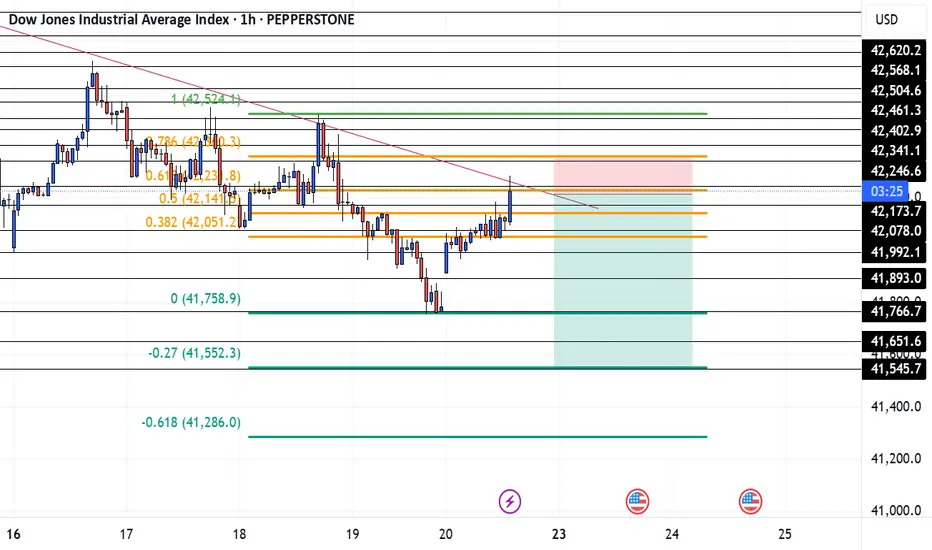
US30 JUNE 20Happy Friday, I see that price is around my key area, the top of the trendline and on my Fib extension. Everything about this trade is telling me to sell. But at the end of the day price does what she wants. So be careful and wait for a break and retest of the key level or trendline before you get i
See all ideas
Displays a symbol's price movements over previous years to identify recurring trends.
Frequently Asked Questions
Dow Jones Industrial Average Index reached its highest quote on Aug 22, 2025 — 45,763.0 USD. See more data on the Dow Jones Industrial Average Index chart.
The lowest ever quote of Dow Jones Industrial Average Index is 9,614.3 USD. It was reached on Jul 2, 2010. See more data on the Dow Jones Industrial Average Index chart.
Dow Jones Industrial Average Index is just a number that lets you track performance of the instruments comprising the index, so you can't invest in it directly. But you can buy Dow Jones Industrial Average Index futures or funds or invest in its components.