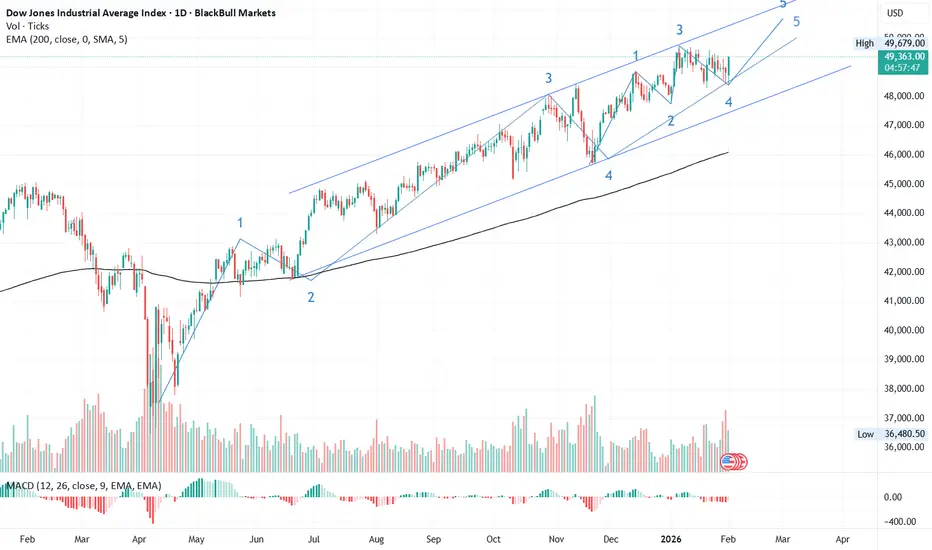
#DJI📊 DJI Technical Outlook – Entering the Final Leg of Its Impulsive Cycle
The Dow Jones Industrial Average (DJI) began a new impulsive cycle in April 2025, marking its 1st wave on 20 May 2025.
• The 2nd wave unfolded as a flat correction with a C-wave failure, ending at 41,835.
• The 3rd wave, the strongest of the cycle, surged to a high of 48,037.
• The 4th wave followed as an elongated flat with an extended C wave.
• Now, DJI has entered its 5th wave on the daily chart.
🔹 Breaking Down the 5th Wave
• The 1st sub-wave appears extended, as the 3rd sub-wave was shorter than the 1st.
• By Elliott Wave principles, the 5th sub-wave should be shorter than the 3rd.
• This structure suggests DJI will continue its bull run, targeting 50,000–50,300 in the near term.
⚠️ Risk Management
A logical stop-loss sits at the end of wave 4, around 48,379.
What traders are saying
DOW Jones looking for 3-5% correction in next 5-8 daysDOW Jones looking for 3-5% correction in next 5-8 days.
Dow Jones is looking to correct further & this may create panic in global markets too.
Be Cautious.

DowJones (DJI) IntraSwing Levels for 02nd-03rd Feb 2026 (2:30 amDowJones (DJI) IntraSwing Levels for 02nd-03rd Feb 2026 (2:30 am)
━━━━━━━━━₹₹₹₹₹₹₹₹₹₹₹₹━━━━━━━━
💥Level Interpretation / description:
L#1: If the candle crossed & stays above the “Buy Gen”, it is treated / considered as Bullish bias.
L#2: Possibility / Probability of REVERSAL near RLB#1 & UBTgt
L#3: If the candle stays above “Sell Gen” but below “Buy Gen”, it is treated / considered as Sidewise. Aggressive Traders can take Long position near “Sell Gen” either retesting or crossed from Below & vice-versa i.e. can take Short position near “Buy Gen” either retesting or crossed downward from Above.
L#4: If the candle crossed & stays below the “Sell Gen”, it is treated / considered a Bearish bias.
L#5: Possibility / Probability of REVERSAL near RLS#1 & USTgt
HZB (Buy side) & HZS (Sell side) => Hurdle Zone,
*** Specialty of “HZB#1, HZB#2 HZS#1 & HZS#2” is Sidewise (behaviour in Nature)
Rest Plotted and Mentioned on Chart
Color code Used:
Green =. Positive bias.
Red =. Negative bias.
RED in Between Green means Trend Finder / Momentum Change
/ CYCLE Change and Vice Versa.
Notice One thing: HOW LEVELS are Working.
Use any Momentum Indicator / Oscillator or as you "USED to" to Take entry.
━━━━━━━━━━━━━━━━━━━━━━━━━━━━━━━━━━━━━━━━━━━
⚠️ DISCLAIMER:
The information, views, and ideas shared here are purely for educational and informational purposes only. They are not intended as investment advice or a recommendation to buy, sell, or hold any financial instruments. I am not a SEBI-registered financial adviser.
Trading and investing in the stock market involves risk, and you should do your own research and analysis. You are solely responsible for any decisions made based on this research.
"As HARD EARNED MONEY IS YOUR's, So DECISION SHOULD HAVE TO BE YOUR's".
━━━━━━━━━━━━━━━━━━━━━━━━━━━━━━━━━
❇️ Follow notification about periodical View
💥 Do Comment for Stock WEEKLY Level Analysis.🚀
📊 Do you agree with this view?
✈️ HIT THE PLANE ICON if this technical observation resonates with you. It will Motivate me.
━━━━━━━━━━━━━━━━━━━━━━━━━━━━━━━━━
💡 If You LOOKING any CHART & want for Level and ANALYZE?
Share your desired stock names in the comments below! I will try to analyze the chart Levels, patterns and share my technical view (so far my Knowledge).
If Viewers think It can identify meaningful setups. Looking forward to hearing from all of you — let's keep this discussion going and help each other make better trading decisions.

Will History Repeat Itself? A Warning from the Dow-Gold RatioRecently, the newly nominated candidate for the Fed chair, Kevin Warsh, talked about an upcoming global economic & financial shift, and it was shocking to hear from him because people at position like his never say such stuff unless it's already underway.
He said "we're entering a new economic system & it happens every 40-45 years" & called it "our Reagan moment" *
The DJI/ Gold ratio is mirroring the words of the next Fed chair
Note: search for "Kevin Warsh Reagan moment" on YouTube to listen to his full interview
----------------------------------------------------------------------------------------------
The ratio has already breached the symmetrical triangle on the bearish side
And entered the pivotal zone (marked red zone)
This level has been witnessed only 4 times in the entire history:
- 1929-30: The Great Economic Depression,
- 1973: oil crisis, & the collapse of the Bretton Woods system,
- 2008: Global Financial Crisis,
- 2026: something's cooking behind the curtains.
1980s: The ratio made bottoms => the election of Ronald Reagan as 40th president of USA: A major shift in US economy
1929-1973 = 44 years
1980-2025 = 45 years
-------------------------------------------------------------------------------------------
The DJI/Gold ratio chart suggests the market may be on the verge of a significant capital rotation event and a potential future economic downturn.
A high ratio indicates that stocks are expensive and overvalued compared to gold
Considering the technical levels and fundamental scenario, the ratio is expected to fall further...........
For this to happen:
- The Dow Jones needs to crash while gold prices remain constant (i.e., levels above 4000-4500 could be the new normal; lower gold prices will keep the ratio on higher levels)
- A falling Dow-to-Gold ratio indicates that gold is expected to outperform stocks, which usually happens during periods of market weakness, economic instability, or recession.

DowJones (DJI) IntraSwing Levels for 30th-31st Jan 2026 (2:30 amDowJones (DJI) IntraSwing Levels for 30th-31st Jan 2026 (2:30 am)
━━━━━━━━━₹₹₹₹₹₹₹₹₹₹₹₹━━━━━━━━
💥Level Interpretation / description:
L#1: If the candle crossed & stays above the “Buy Gen”, it is treated / considered as Bullish bias.
L#2: Possibility / Probability of REVERSAL near RLB#1 & UBTgt
L#3: If the candle stays above “Sell Gen” but below “Buy Gen”, it is treated / considered as Sidewise. Aggressive Traders can take Long position near “Sell Gen” either retesting or crossed from Below & vice-versa i.e. can take Short position near “Buy Gen” either retesting or crossed downward from Above.
L#4: If the candle crossed & stays below the “Sell Gen”, it is treated / considered a Bearish bias.
L#5: Possibility / Probability of REVERSAL near RLS#1 & USTgt
HZB (Buy side) & HZS (Sell side) => Hurdle Zone,
*** Specialty of “HZB#1, HZB#2 HZS#1 & HZS#2” is Sidewise (behaviour in Nature)
Rest Plotted and Mentioned on Chart
Color code Used:
Green =. Positive bias.
Red =. Negative bias.
RED in Between Green means Trend Finder / Momentum Change
/ CYCLE Change and Vice Versa.
Notice One thing: HOW LEVELS are Working.
Use any Momentum Indicator / Oscillator or as you "USED to" to Take entry.
━━━━━━━━━━━━━━━━━━━━━━━━━━━━━━━━━━━━━━━━━━━
⚠️ DISCLAIMER:
The information, views, and ideas shared here are purely for educational and informational purposes only. They are not intended as investment advice or a recommendation to buy, sell, or hold any financial instruments. I am not a SEBI-registered financial adviser.
Trading and investing in the stock market involves risk, and you should do your own research and analysis. You are solely responsible for any decisions made based on this research.
"As HARD EARNED MONEY IS YOUR's, So DECISION SHOULD HAVE TO BE YOUR's".
━━━━━━━━━━━━━━━━━━━━━━━━━━━━━━━━━
❇️ Follow notification about periodical View
💥 Do Comment for Stock WEEKLY Level Analysis.🚀
📊 Do you agree with this view?
✈️ HIT THE PLANE ICON if this technical observation resonates with you. It will Motivate me.
━━━━━━━━━━━━━━━━━━━━━━━━━━━━━━━━━
💡 If You LOOKING any CHART & want for Level and ANALYZE?
Share your desired stock names in the comments below! I will try to analyze the chart Levels, patterns and share my technical view (so far my Knowledge).
If Viewers think It can identify meaningful setups. Looking forward to hearing from all of you — let's keep this discussion going and help each other make better trading decisions.

US30 buy setupThere is only one zone near US30 from where it can be bought, you can take a good trade by taking confirmation in LTF timeframe.

DowJones (DJI) IntraSwing Levels for 15th-16th Jan 2026 (2:30 amDowJones (DJI) IntraSwing Levels for 15th-16th Jan 2026 (2:30 am)
👇🏼Screen shot of Todays (15th Jan 2026 as of now) 5 min TF Chart Formation
💥Level Interpretation / description:
L#1: If the candle crossed & stays above the “Buy Gen”, it is treated / considered as Bullish bias.
L#2: Possibility / Probability of REVERSAL near RLB#1 & UBTgt
L#3: If the candle stays above “Sell Gen” but below “Buy Gen”, it is treated / considered as Sidewise. Aggressive Traders can take Long position near “Sell Gen” either retesting or crossed from Below & vice-versa i.e. can take Short position near “Buy Gen” either retesting or crossed downward from Above.
L#4: If the candle crossed & stays below the “Sell Gen”, it is treated / considered a Bearish bias.
L#5: Possibility / Probability of REVERSAL near RLS#1 & USTgt
HZB (Buy side) & HZS (Sell side) => Hurdle Zone,
*** Specialty of “HZB#1, HZB#2 HZS#1 & HZS#2” is Sidewise (behaviour in Nature)
Rest Plotted and Mentioned on Chart
Color code Used:
Green =. Positive bias.
Red =. Negative bias.
RED in Between Green means Trend Finder / Momentum Change
/ CYCLE Change and Vice Versa.
Notice One thing: HOW LEVELS are Working.
Use any Momentum Indicator / Oscillator or as you "USED to" to Take entry.
━━━━━━━━━━━━━━━━━━━━━━━━━━━━━━━━━━━━━━━━━━━
⚠️ DISCLAIMER:
The information, views, and ideas shared here are purely for educational and informational purposes only. They are not intended as investment advice or a recommendation to buy, sell, or hold any financial instruments. I am not a SEBI-registered financial adviser.
Trading and investing in the stock market involves risk, and you should do your own research and analysis. You are solely responsible for any decisions made based on this research.
"As HARD EARNED MONEY IS YOUR's, So DECISION SHOULD HAVE TO BE YOUR's".
━━━━━━━━━━━━━━━━━━━━━━━━━━━━━━━━━
❇️ Follow notification about periodical View
💥 Do Comment for Stock WEEKLY Level Analysis.🚀
📊 Do you agree with this view?
✈️ HIT THE PLANE ICON if this technical observation resonates with you. It will Motivate me.

US30 showing bullish signsIndex is holding well near a key support zone.
As long as support holds, upside towards 49,282 looks possible

DowJones (DJI) IntraSwing Levels for 14th-15th Jan 2026 (2:30 am💥Level Interpretation / description:
L#1: If the candle crossed & stays above the “Buy Gen”, it is treated / considered as Bullish bias.
L#2: Possibility / Probability of REVERSAL near RLB#1 & UBTgt
L#3: If the candle stays above “Sell Gen” but below “Buy Gen”, it is treated / considered as Sidewise. Aggressive Traders can take Long position near “Sell Gen” either retesting or crossed from Below & vice-versa i.e. can take Short position near “Buy Gen” either retesting or crossed downward from Above.
L#4: If the candle crossed & stays below the “Sell Gen”, it is treated / considered a Bearish bias.
L#5: Possibility / Probability of REVERSAL near RLS#1 & USTgt
HZB (Buy side) & HZS (Sell side) => Hurdle Zone,
*** Specialty of “HZB#1, HZB#2 HZS#1 & HZS#2” is Sidewise (behaviour in Nature)
Rest Plotted and Mentioned on Chart
Color code Used:
Green =. Positive bias.
Red =. Negative bias.
RED in Between Green means Trend Finder / Momentum Change
/ CYCLE Change and Vice Versa.
Notice One thing: HOW LEVELS are Working.
Use any Momentum Indicator / Oscillator or as you "USED to" to Take entry.
━━━━━━━━━━━━━━━━━━━━━━━━━━━━━━━━━━━━━━━━━━━
⚠️ DISCLAIMER:
The information, views, and ideas shared here are purely for educational and informational purposes only. They are not intended as investment advice or a recommendation to buy, sell, or hold any financial instruments. I am not a SEBI-registered financial adviser.
Trading and investing in the stock market involves risk, and you should do your own research and analysis. You are solely responsible for any decisions made based on this research.
"As HARD EARNED MONEY IS YOUR's, So DECISION SHOULD HAVE TO BE YOUR's".
━━━━━━━━━━━━━━━━━━━━━━━━━━━━━━━━━
❇️ Follow notification about periodical View
💥 Do Comment for Stock WEEKLY Level Analysis.🚀
📊 Do you agree with this view?
✈️ HIT THE PLANE ICON if this technical observation resonates with you. It will Motivate me.

DowJones (DJI) IntraSwing Levels: 13th-14th Jan 2026 (2:30 am)DowJones (DJI) IntraSwing Levels: 13th-14th Jan 2026 (2:30 am)
Screen shot of first 15 min in 5 min TF
💥Level Interpretation / description:
L#1: If the candle crossed & stays above the “Buy Gen”, it is treated / considered as Bullish bias.
L#2: Possibility / Probability of REVERSAL near RLB#1 & UBTgt
L#3: If the candle stays above “Sell Gen” but below “Buy Gen”, it is treated / considered as Sidewise. Aggressive Traders can take Long position near “Sell Gen” either retesting or crossed from Below & vice-versa i.e. can take Short position near “Buy Gen” either retesting or crossed downward from Above.
L#4: If the candle crossed & stays below the “Sell Gen”, it is treated / considered a Bearish bias.
L#5: Possibility / Probability of REVERSAL near RLS#1 & USTgt
HZB (Buy side) & HZS (Sell side) => Hurdle Zone,
*** Specialty of “HZB#1, HZB#2 HZS#1 & HZS#2” is Sidewise (behaviour in Nature)
Rest Plotted and Mentioned on Chart
Color code Used:
Green =. Positive bias.
Red =. Negative bias.
RED in Between Green means Trend Finder / Momentum Change
/ CYCLE Change and Vice Versa.
Notice One thing: HOW LEVELS are Working.
Use any Momentum Indicator / Oscillator or as you "USED to" to Take entry.
━━━━━━━━━━━━━━━━━━━━━━━━━━━━━━━━━━━━━━━━━━━
⚠️ DISCLAIMER:
The information, views, and ideas shared here are purely for educational and informational purposes only. They are not intended as investment advice or a recommendation to buy, sell, or hold any financial instruments. I am not a SEBI-registered financial adviser.
Trading and investing in the stock market involves risk, and you should do your own research and analysis. You are solely responsible for any decisions made based on this research.
"As HARD EARNED MONEY IS YOUR's, So DECISION SHOULD HAVE TO BE YOUR's".
━━━━━━━━━━━━━━━━━━━━━━━━━━━━━━━━━
❇️ Follow notification about periodical View
💥 Do Comment for Stock WEEKLY Level Analysis.🚀
📊 Do you agree with this view?
✈️ HIT THE PLANE ICON if this technical observation resonates with you. It will Motivate me.

DowJones (DJI) IntraSwing Levels for 12th-13th Jan '26 (2:30 am)DowJones (DJI) IntraSwing Levels for 12th-13th Jan 2026 (2:30 am)
👇🏼Screen shot of Todays (12th Jan 2026 till now) movement
💥Level Interpretation / description:
L#1: If the candle crossed & stays above the “Buy Gen”, it is treated / considered as Bullish bias.
L#2: Possibility / Probability of REVERSAL near RLB#1 & UBTgt
L#3: If the candle stays above “Sell Gen” but below “Buy Gen”, it is treated / considered as Sidewise. Aggressive Traders can take Long position near “Sell Gen” either retesting or crossed from Below & vice-versa i.e. can take Short position near “Buy Gen” either retesting or crossed downward from Above.
L#4: If the candle crossed & stays below the “Sell Gen”, it is treated / considered a Bearish bias.
L#5: Possibility / Probability of REVERSAL near RLS#1 & USTgt
HZB (Buy side) & HZS (Sell side) => Hurdle Zone,
*** Specialty of “HZB#1, HZB#2 HZS#1 & HZS#2” is Sidewise (behaviour in Nature)
Rest Plotted and Mentioned on Chart
Color code Used:
Green =. Positive bias.
Red =. Negative bias.
RED in Between Green means Trend Finder / Momentum Change
/ CYCLE Change and Vice Versa.
Notice One thing: HOW LEVELS are Working.
Use any Momentum Indicator / Oscillator or as you "USED to" to Take entry.
━━━━━━━━━━━━━━━━━━━━━━━━━━━━━━━━━━━━━━━━━━━
⚠️ DISCLAIMER:
The information, views, and ideas shared here are purely for educational and informational purposes only. They are not intended as investment advice or a recommendation to buy, sell, or hold any financial instruments. I am not a SEBI-registered financial adviser.
Trading and investing in the stock market involves risk, and you should do your own research and analysis. You are solely responsible for any decisions made based on this research.
"As HARD EARNED MONEY IS YOUR's, So DECISION SHOULD HAVE TO BE YOUR's".
━━━━━━━━━━━━━━━━━━━━━━━━━━━━━━━━━
❇️ Follow notification about periodical View
💥 Do Comment for Stock WEEKLY Level Analysis.🚀
📊 Do you agree with this view?
✈️ HIT THE PLANE ICON if this technical observation resonates with you. It will Motivate me.

DowJones (DJI) IntraSwing Levels for 08th-09th Jan 2026 (2:30 amDowJones (DJI) IntraSwing Levels for 08th-09th Jan 2026 (2:30 am)
👇🏼Screen shot of Todays DJI FUTURE=>Dow Jones FUT(8th Jan 2026 Till now) trade
💥Level Interpretation / description:
L#1: If the candle crossed & stays above the “Buy Gen”, it is treated / considered as Bullish bias.
L#2: Possibility / Probability of REVERSAL near RLB#1 & UBTgt
L#3: If the candle stays above “Sell Gen” but below “Buy Gen”, it is treated / considered as Sidewise. Aggressive Traders can take Long position near “Sell Gen” either retesting or crossed from Below & vice-versa i.e. can take Short position near “Buy Gen” either retesting or crossed downward from Above.
L#4: If the candle crossed & stays below the “Sell Gen”, it is treated / considered a Bearish bias.
L#5: Possibility / Probability of REVERSAL near RLS#1 & USTgt
HZB (Buy side) & HZS (Sell side) => Hurdle Zone,
*** Specialty of “HZB#1, HZB#2 HZS#1 & HZS#2” is Sidewise (behaviour in Nature)
Rest Plotted and Mentioned on Chart
Color code Used:
Green =. Positive bias.
Red =. Negative bias.
RED in Between Green means Trend Finder / Momentum Change
/ CYCLE Change and Vice Versa.
Notice One thing: HOW LEVELS are Working.
Use any Momentum Indicator / Oscillator or as you "USED to" to Take entry.
⚠️ DISCLAIMER:
The information, views, and ideas shared here are purely for educational and informational purposes only. They are not intended as investment advice or a recommendation to buy, sell, or hold any financial instruments. I am not a SEBI-registered financial adviser.
Trading and investing in the stock market involves risk, and you should do your own research and analysis. You are solely responsible for any decisions made based on this research.
"As HARD EARNED MONEY IS YOUR's, So DECISION SHOULD HAVE TO BE YOUR's".
Do comment if Helpful .
Do Comment for In depth Analysis.
❇️ Follow notification about periodical View
💥 Do Comment for Stock WEEKLY Level Analysis.🚀
In depth Analysis will be added later (If time Permits)
________________^^^^^^^^^^^^^^^^_________________
💥Level Interpretation / description:
L#1: If the candle crossed & stays above the “Buy Gen”, it is treated / considered as Bullish bias.
L#2: Possibility / Probability of REVERSAL near RLB#1 & UBTgt
L#3: If the candle stays above “Sell Gen” but below “Buy Gen”, it is treated / considered as Sidewise. Aggressive Traders can take Long position near “Sell Gen” either retesting or crossed from Below & vice-versa i.e. can take Short position near “Buy Gen” either retesting or crossed downward from Above.
L#4: If the candle crossed & stays below the “Sell Gen”, it is treated / considered a Bearish bias.
L#5: Possibility / Probability of REVERSAL near RLS#1 & USTgt
HZB (Buy side) & HZS (Sell side) => Hurdle Zone,
*** Specialty of “HZB#1, HZB#2 HZS#1 & HZS#2” is Sidewise (behaviour in Nature)
Rest Plotted and Mentioned on Chart
Color code Used:
Green =. Positive bias.
Red =. Negative bias.
RED in Between Green means Trend Finder / Momentum Change
/ CYCLE Change and Vice Versa.
Notice One thing: HOW LEVELS are Working.
Use any Momentum Indicator / Oscillator or as you "USED to" to Take entry.
━━━━━━━━━━━━━━━━━━━━━━━━━━━━━━━━━━━━━━━━━━━
⚠️ DISCLAIMER:
The information, views, and ideas shared here are purely for educational and informational purposes only. They are not intended as investment advice or a recommendation to buy, sell, or hold any financial instruments. I am not a SEBI-registered financial adviser.
Trading and investing in the stock market involves risk, and you should do your own research and analysis. You are solely responsible for any decisions made based on this research.
"As HARD EARNED MONEY IS YOUR's, So DECISION SHOULD HAVE TO BE YOUR's".
━━━━━━━━━━━━━━━━━━━━━━━━━━━━━━━━━
❇️ Follow notification about periodical View
💥 Do Comment for Stock WEEKLY Level Analysis.🚀
📊 Do you agree with this view?
✈️ HIT THE PLANE ICON if this technical observation resonates with you. It will Motivate me.
━━━━━━━━━━━━━━━━━━━━━━━━━━━━━━━━━
💡 If You LOOKING any CHART, You want me to ANALYZE?
Share your desired stock names in the comments below! I will try to analyze the chart patterns and share my technical view (so far my Knowledge).
If Viewers think It can identify meaningful setups. Looking forward to hearing from all of you — let's keep this discussion going and help each other make better trading decisions.

owJones (DJI) IntraSwing Levels for 07th-08th Jan 2026 (2:30 am)DowJones (DJI) IntraSwing Levels for 07th-08th Jan 2026 (2:30 am)
💥Level Interpretation / description:
L#1: If the candle crossed & stays above the “Buy Gen”, it is treated / considered as Bullish bias.
L#2: Possibility / Probability of REVERSAL near RLB#1 & UBTgt
L#3: If the candle stays above “Sell Gen” but below “Buy Gen”, it is treated / considered as Sidewise. Aggressive Traders can take Long position near “Sell Gen” either retesting or crossed from Below & vice-versa i.e. can take Short position near “Buy Gen” either retesting or crossed downward from Above.
L#4: If the candle crossed & stays below the “Sell Gen”, it is treated / considered a Bearish bias.
L#5: Possibility / Probability of REVERSAL near RLS#1 & USTgt
HZB (Buy side) & HZS (Sell side) => Hurdle Zone,
*** Specialty of “HZB#1, HZB#2 HZS#1 & HZS#2” is Sidewise (behaviour in Nature)
Rest Plotted and Mentioned on Chart
Color code Used:
Green =. Positive bias.
Red =. Negative bias.
RED in Between Green means Trend Finder / Momentum Change
/ CYCLE Change and Vice Versa.
Notice One thing: HOW LEVELS are Working.
Use any Momentum Indicator / Oscillator or as you "USED to" to Take entry.
━━━━━━━━━━━━━━━━━━━━━━━━━━━━━━━━━━━━━━━━━━━
⚠️ DISCLAIMER:
The information, views, and ideas shared here are purely for educational and informational purposes only. They are not intended as investment advice or a recommendation to buy, sell, or hold any financial instruments. I am not a SEBI-registered financial adviser.
Trading and investing in the stock market involves risk, and you should do your own research and analysis. You are solely responsible for any decisions made based on this research.
"As HARD EARNED MONEY IS YOUR's, So DECISION SHOULD HAVE TO BE YOUR's".
━━━━━━━━━━━━━━━━━━━━━━━━━━━━━━━━━
❇️ Follow notification about periodical View
💥 Do Comment for Stock WEEKLY Level Analysis.🚀
📊 Do you agree with this view?
✈️ HIT THE PLANE ICON if this technical observation resonates with you. It will Motivate me.
━━━━━━━━━━━━━━━━━━━━━━━━━━━━━━━━━
💡 If You LOOKING any CHART, You want me to ANALYZE?
Share your desired stock names in the comments below! I will try to analyze the chart patterns and share my technical view (so far my Knowledge).
If Viewers think It can identify meaningful setups. Looking forward to hearing from all of you — let's keep this discussion going and help each other make better trading decisions.

DowJones (DJI) IntraSwing Levels for 06th-07th Jan 2026 (2:30 amDowJones (DJI) IntraSwing Levels for 06th-07th Jan 2026 (2:30 am)
👇🏼Screen shot of "DJI Future Levels for 06th - 07 th Jan 2026 (2.30 am)" - Till now
💥Level Interpretation / description:
L#1: If the candle crossed & stays above the “Buy Gen”, it is treated / considered as Bullish bias.
L#2: Possibility / Probability of REVERSAL near RLB#1 & UBTgt
L#3: If the candle stays above “Sell Gen” but below “Buy Gen”, it is treated / considered as Sidewise. Aggressive Traders can take Long position near “Sell Gen” either retesting or crossed from Below & vice-versa i.e. can take Short position near “Buy Gen” either retesting or crossed downward from Above.
L#4: If the candle crossed & stays below the “Sell Gen”, it is treated / considered a Bearish bias.
L#5: Possibility / Probability of REVERSAL near RLS#1 & USTgt
HZB (Buy side) & HZS (Sell side) => Hurdle Zone,
*** Specialty of “HZB#1, HZB#2 HZS#1 & HZS#2” is Sidewise (behaviour in Nature)
Rest Plotted and Mentioned on Chart
Color code Used:
Green =. Positive bias.
Red =. Negative bias.
RED in Between Green means Trend Finder / Momentum Change
/ CYCLE Change and Vice Versa.
Notice One thing: HOW LEVELS are Working.
Use any Momentum Indicator / Oscillator or as you "USED to" to Take entry.
⚠️ DISCLAIMER:
The information, views, and ideas shared here are purely for educational and informational purposes only. They are not intended as investment advice or a recommendation to buy, sell, or hold any financial instruments. I am not a SEBI-registered financial adviser.
Trading and investing in the stock market involves risk, and you should do your own research and analysis. You are solely responsible for any decisions made based on this research.
"As HARD EARNED MONEY IS YOUR's, So DECISION SHOULD HAVE TO BE YOUR's".
Do comment if Helpful .
Do Comment for In depth Analysis.
❇️ Follow notification about periodical View
💥 Do Comment for Stock WEEKLY Level Analysis.🚀

DowJones (DJI) IntraSwing Levels for 05th-06th Jan 2026 (2:30 amDowJones (DJI) IntraSwing Levels for 05th-06th Jan 2026 (2:30 am)
👉🏽 Useful to Tally / Recognize for Next day NIFTY Fut Trade Plan & Market Movement.
👉🏽 Screen shot of "Dow Future (DJI) IntraSwing Levels for 05th-06th Jan 2026 (2:30 am)"
💥Level Interpretation / description:
L#1: If the candle crossed & stays above the “Buy Gen”, it is treated / considered as Bullish bias.
L#2: Possibility / Probability of REVERSAL near RLB#1 & UBTgt
L#3: If the candle stays above “Sell Gen” but below “Buy Gen”, it is treated / considered as Sidewise. Aggressive Traders can take Long position near “Sell Gen” either retesting or crossed from Below & vice-versa i.e. can take Short position near “Buy Gen” either retesting or crossed downward from Above.
L#4: If the candle crossed & stays below the “Sell Gen”, it is treated / considered a Bearish bias.
L#5: Possibility / Probability of REVERSAL near RLS#1 & USTgt
HZB (Buy side) & HZS (Sell side) => Hurdle Zone,
*** Specialty of “HZB#1, HZB#2 HZS#1 & HZS#2” is Sidewise (behaviour in Nature)
Rest Plotted and Mentioned on Chart
Color code Used:
Green =. Positive bias.
Red =. Negative bias.
RED in Between Green means Trend Finder / Momentum Change
/ CYCLE Change and Vice Versa.
Notice One thing: HOW LEVELS are Working.
Use any Momentum Indicator / Oscillator or as you "USED to" to Take entry.
⚠️ DISCLAIMER:
The information, views, and ideas shared here are purely for educational and informational purposes only. They are not intended as investment advice or a recommendation to buy, sell, or hold any financial instruments. I am not a SEBI-registered financial adviser.
Trading and investing in the stock market involves risk, and you should do your own research and analysis. You are solely responsible for any decisions made based on this research.
"As HARD EARNED MONEY IS YOUR's, So DECISION SHOULD HAVE TO BE YOUR's".
Do comment if Helpful .
Do Comment for In depth Analysis.
❇️ Follow notification about periodical View
💥 Do Comment for Stock WEEKLY Level Analysis.🚀

DJI LONG TERM VIEWDJI
SUPPORT 43000 ,40000 ,38000 ,up move possible
RESISTANCE 56000 ,59000 ,65000
invalidation 36000 below close or sustain
view is for education purpose only , we are not recommendation any trade or investment
Always do your own analysis

DowJones (DJI) IntraSwing Levels for 30th Dec - 31st Dec 2025DowJones (DJI) IntraSwing Levels for 30th Dec - 31st Dec 2025 (2:30 am)
💥Level Interpretation / description:
L#1: If the candle crossed & stays above the “Buy Gen”, it is treated / considered as Bullish bias.
L#2: Possibility / Probability of REVERSAL near RLB#1 & UBTgt
L#3: If the candle stays above “Sell Gen” but below “Buy Gen”, it is treated / considered as Sidewise. Aggressive Traders can take Long position near “Sell Gen” either retesting or crossed from Below & vice-versa i.e. can take Short position near “Buy Gen” either retesting or crossed downward from Above.
L#4: If the candle crossed & stays below the “Sell Gen”, it is treated / considered a Bearish bias.
L#5: Possibility / Probability of REVERSAL near RLS#1 & USTgt
HZB (Buy side) & HZS (Sell side) => Hurdle Zone,
*** Specialty of “HZB#1, HZB#2 HZS#1 & HZS#2” is Sidewise (behaviour in Nature)
Rest Plotted and Mentioned on Chart
Color code Used:
Green =. Positive bias.
Red =. Negative bias.
RED in Between Green means Trend Finder / Momentum Change
/ CYCLE Change and Vice Versa.
Notice One thing: HOW LEVELS are Working.
Use any Momentum Indicator / Oscillator or as you "USED to" to Take entry.
⚠️ DISCLAIMER:
The information, views, and ideas shared here are purely for educational and informational purposes only. They are not intended as investment advice or a recommendation to buy, sell, or hold any financial instruments. I am not a SEBI-registered financial adviser.
Trading and investing in the stock market involves risk, and you should do your own research and analysis. You are solely responsible for any decisions made based on this research.
"As HARD EARNED MONEY IS YOUR's, So DECISION SHOULD HAVE TO BE YOUR's".
Do comment if Helpful .
Do Comment for In depth Analysis.
❇️ Follow notification about periodical View


Retail Trading Profits: Reality, Drivers, Sustainable StrategiesIntroduction: Understanding Retail Trading Profits
Retail trading refers to individual investors buying and selling financial instruments such as stocks, derivatives, forex, commodities, and cryptocurrencies using personal capital. With the rise of digital trading platforms, low brokerage costs, and easy access to market data, retail participation has grown significantly, especially in emerging markets like India. However, while success stories often highlight quick gains, the reality of retail trading profits is complex, demanding discipline, knowledge, and risk management. This article explores how retail traders generate profits, the challenges they face, and the strategies that lead to sustainable success.
The Nature of Retail Trading Profits
Retail trading profits are the net gains earned after accounting for transaction costs, taxes, slippage, and losses. Unlike institutional traders, retail traders operate with limited capital, fewer information advantages, and higher emotional involvement. Profits in retail trading are usually non-linear, meaning periods of gains are often followed by drawdowns. Sustainable profitability depends less on occasional big wins and more on consistent execution over time.
Key Markets Where Retail Traders Seek Profits
Retail traders operate across multiple asset classes:
Equity Markets: Long-term investing, swing trading, and intraday trading in stocks.
Derivatives (F&O): Futures and options offer leverage but also increase risk.
Forex Markets: Highly liquid, 24-hour markets attractive for short-term traders.
Commodities: Gold, crude oil, and agricultural commodities provide diversification.
Cryptocurrencies: High volatility offers profit potential but carries significant risk.
Each market has a different risk-reward profile, and retail profits depend on choosing instruments aligned with one’s skill and risk tolerance.
Role of Knowledge and Skill in Profit Generation
Profitable retail trading is fundamentally skill-based. Traders who invest time in understanding technical analysis, price action, market structure, and basic macroeconomics are better positioned to make informed decisions. Over time, traders develop pattern recognition, execution discipline, and the ability to adapt to changing market conditions. Profits are rarely accidental; they are the outcome of preparation, testing, and experience.
Risk Management: The Foundation of Retail Trading Profits
Risk management is the most critical factor separating profitable traders from unprofitable ones. Retail traders who survive and grow typically follow strict rules such as:
Limiting risk per trade (often 1–2% of capital)
Using stop-loss orders consistently
Maintaining a favorable risk-to-reward ratio
Avoiding over-leverage and excessive position sizing
Even a profitable strategy can fail without proper risk control. Long-term retail trading profits are more about capital preservation than aggressive profit chasing.
Psychological Factors Influencing Profits
Trading psychology plays a decisive role in retail trading outcomes. Emotions like fear, greed, revenge trading, and overconfidence often lead to impulsive decisions. Many retail traders lose money not due to poor strategies but due to emotional reactions to wins and losses. Profitable traders cultivate discipline, patience, and emotional neutrality, treating trading as a business rather than a gambling activity.
Technology and Tools Enhancing Retail Profits
Modern technology has significantly improved the ability of retail traders to compete. Charting platforms, real-time data, algorithmic tools, screeners, and backtesting software allow traders to refine strategies and reduce guesswork. Access to educational content, market analytics, and automated alerts has made trading more data-driven, improving the probability of consistent profits when used responsibly.
Common Mistakes That Erode Retail Trading Profits
Many retail traders struggle due to avoidable mistakes, including:
Overtrading driven by excitement or boredom
Ignoring transaction costs and taxes
Following tips without independent analysis
Trading without a defined plan
Expecting quick and unrealistic returns
These mistakes gradually erode capital and confidence, making profitability difficult to achieve over time.
Consistency Over Big Wins: The Profitability Mindset
One of the most misunderstood aspects of retail trading profits is consistency. Professional retail traders focus on steady, repeatable returns rather than chasing jackpot trades. Small but consistent gains, compounded over time, lead to meaningful wealth creation. This mindset shifts the focus from short-term excitement to long-term sustainability.
Regulatory Environment and Its Impact on Profits
Regulatory frameworks influence retail trading profitability through margin rules, leverage limits, taxation, and compliance requirements. While regulations may restrict excessive risk-taking, they also protect retail traders from systemic risks and unethical practices. Understanding regulatory norms helps traders plan trades more efficiently and avoid unexpected financial burdens.
Long-Term Sustainability of Retail Trading Profits
Sustainable retail trading profits are achievable but require continuous learning and adaptation. Markets evolve due to economic cycles, policy changes, and technological advancements. Traders who regularly review performance, update strategies, and remain flexible are more likely to remain profitable across different market phases.
Conclusion: The Real Path to Retail Trading Profits
Retail trading profits are not a myth, but they are far from easy or guaranteed. They are the result of disciplined execution, sound risk management, emotional control, and continuous skill development. While many retail traders enter the market seeking fast money, only those who approach trading as a serious profession achieve long-term success. In essence, retail trading profits are earned not by predicting markets perfectly, but by managing uncertainty intelligently and consistently over time.

TRADE SETUP US 30 short positions can be taken near upper rectangle zone marked with red arrows and long can be tried near lower rectangle near green arrows with sl above or below marked zones

Us 30 fractal from 2020 us 30 see rise of 40percent then fall of 22 percent then again in 2022 we had seen 20 percent around correction and rise of 50/55 percent so for coming year there is still room it to rise about 56000-57000 then again it may hit correction phase

Dow Jones Ind. Weekly UpdatedDJI Indices in now going Wave 3 super cycle degree target 60,000 USD minor correction possible so enter 43,000 - 40,000 level is good for long entry

Dow Jones Crash - 2026 Analysis (Elliott Wave)DJI Indices crash possible up to minimum 50 to 61.8% starts on Feb - mar 2026 forming leading diagonal pattern 5th wave completed soon last up move around 1000 points only then stars correction so traders and investors go short don't try long at this time
