FBMKLSI MALAYSIAToday' Session we have witnessed, Where; In the early session market have started with negative trend due to global sell off has been seen from last 4 consecutive day, but at the end we have seen some pull back ;Technical point of view we can see mkt have formed Bearish candle pattern on daily chart but responded very well to our said support zone, have seen some recovery at the end of the session , Eventually mkt have close 1508, Therefore; we may see some positive trend in the mkt.
Going forward 1517-1521 will be acting as a resistance and 1500 -1494 will be acting as a Support .
Trade ideas
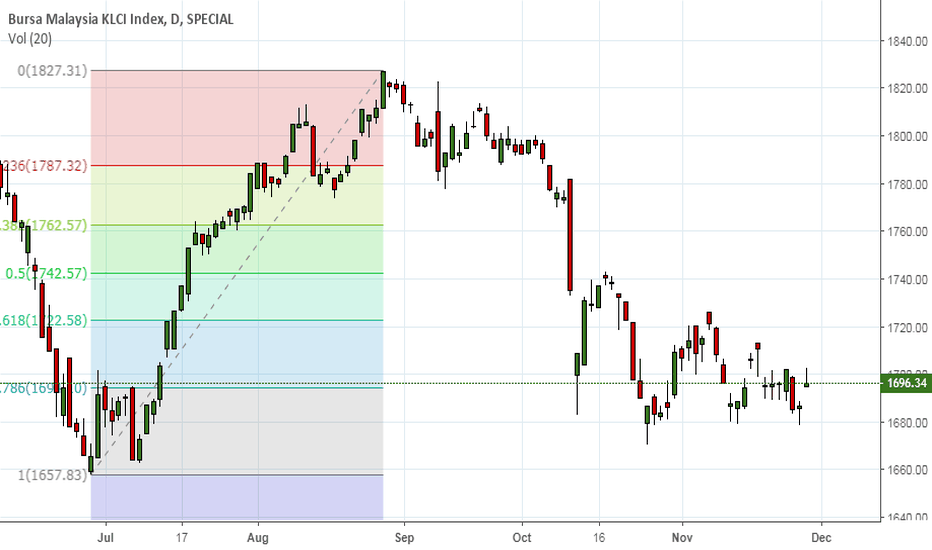
Bursa Malaysia Spot Index looks weakAs per last one month KLSE index trading in range of 1680-1720 just below 61.8% Fib retrenchment level of rise from July-18 to Aug-18.
If index trade below 1700 level then fall to 1670-1660 level.
Volume addition in selling suggest major delivery based selling happening.
FBMKLCI - not looking good guysAs salam dan salam sejahtera traders semua.
a gloomy gloomy week last week. sampaikan saya nak posting dalam trading view pun xde hati.
yang mana keep on cut loss for this week, saya ucapkan takziah. take it as a lesson.
x kena x tau kan?
okay how's the condition of our index looks like?
yang mana pakar chart pattern rasanya dah recognize pattern ni kan?
YUP a Head and Shoulder. bukan yang shampoo tu ye.
this a bearish head and shoulder setup yang saya perasaan di dalam weekly chart kita.
based on pattern it will keep on falling. perhatikan last candle tu, a big black solid marubozu. it is a strong supply.
Apa maksudnya? our market in a state of panic.
so what we should do?
Chill, exit positions dan g bercuti. simple
boleh lihat pada MACD yang kini berada pada negative region yang menunjukkan adanya sentimen jualan yang kuat di dalam market.
kalau nak trade juga, PLEASE KEEP IT SHORT!!!
see money take money.
Good Luck Guys!! saya akan sideline sampai market cantik semula
Halim Hamdan
klci wk20 180518 - short term bullishKLCI weekly chart shows the bullish trend is still in effect. short term price channel has formed with the index loosely trading within it. recently index has managed to close above the Bollinger Band mid band showing strength. Resistance area of 1910 for with a support at 1850 (or blue line "short term support"). If price unable to maintain above lower channel, next support price is seen to be at 1800, as the major psychological Support line.


