HWHG trade ideas

TATA STEEL LONGTatat Steel on weekly chart had started H & S pattern from Dec 2021. It has completed Left Shoulder and Head and is on way to complete Right Shoulder. During this process 108 has become important Pivotal line and 3 years it is trading is between 155 to 80 range. Near Right Shoulder range has reduced to 122 to 102 (from 50% to 20%). Today it had completed Red Inverted Triangle within Right shoulder Any break above Inverted triangle will take Tata Steel to 115 (which is neckline) where it will complete H & S pattern. Above neckline Resistance could come at 120 where price meets at uptrend support and resistance line.
Conclusion.
Range could expand from 20% to 50% (102 to 155)
Above 108 H & S completion process is verified and so price could reach 115 Rs. which is neckline. Above Neckline resistance could come at 120 as it is price meeting at uptrend support resistance line. If 120 is broken on upside with volume, then 155 should be on browser.
This is weekly chart and views are taken from dec 2021 onwards i.e., 3years, targets archivable is also for long term more than 1 year. It requires lot of patients to hold for long term. %0 percent profit can be earned in 2yrs time.

TATA STEEL LONG Tatat Steel on weekly chart had started H & S pattern from Dec 2021. It has completed Left Shoulder and Head and is on way to complete Right Shoulder. During this process 108 has become important Pivotal line and 3 years it is trading is between 155 to 80 range. Near Right Shoulder range has reduced to 122 to 102 (from 50% to 20%). Today it had completed Red Inverted Triangle within Right shoulder Any break above Inverted triangle will take Tata Steel to 115 (which is neckline) where it will complete H & S pattern. Above neckline Resistance could come at 120 where price meets at uptrend support and resistance line.
Conclusion.
Range could expand from 20% to 50% (102 to 155)
Above 108 H & S completion process is verified and so price could reach 115 Rs. which is neckline. Above Neckline resistance could come at 120 as it is price meeting at uptrend support resistance line. If 120 is broken on upside with volume, then 155 should be on browser.
This is weekly chart and views are taken from dec 2021 onwards i.e., 3years, targets archivable is also for long term more than 1 year. It requires lot of patients to hold for long term. %0 percent profit can be earned in 2yrs tine.

Tata Steel : Watchout for Double bottomNSE:TATASTEEL has made double bottom and is near the neckline. One can initiate long trade only after closing of breakout candle above the neckline. Keep a wa

TATASTEEL Watchout!Not a strong breakdown, Volumes are low and the candle pattern is not that strong- it might retrace and give a better move
However, it's important to note that stock market investments come with inherent risks, and predicting breakouts or price movements accurately is challenging. It's advisable to consult with a financial advisor or conduct further research to validate the analysis and make informed investment decisions.

TATA STEEL on Weekly Breakout good for INVESTMENTTATASTELL is about to breakout above 124-130 in coming months post which we can see WAVE 3 on Weekly Charts with impulsive movement & targets above 500+ in coming 2-3 Years
LTP - 107
SL - 80
Targets - 500+
Time frame - 2-3 Years
Breakout above 155 on monthly timeframe would be ideal time to go for Investment.
Happy Investment.

Tata Steel, BearishTata Steel looks bearish with present levels near its major support of 1075, and have
bounced to 1300 level in the past. But, if this support is breached, may see
lower level upto 930-920.

VIEW ON TATA STEELGood chart
Above its 100 day SMA
Target 113/115
Stop loss 109
I m just representing my views.
For educational purpose only.

i am predict traget and stoploss first traget 113.05 second traget 115.40 thrith traget 119.85 for intraday traget
and
second for swing trading
first traget 123.90
and second
final traget is 126.60
this is 100% work
pls follwing

TATA STEELTATA STEEL looking good for a short term swing , a good inverted head and shoulders pattern is formed and stock has broken out of the resistance of 108 levels , if sustains above , stock can move towards targets of 113/115 , with SL of 107

tata steel bullish movetata steel comming with positive sentiment and bullish signal with the chart pattern.further they publish expecting good profit quarter on the basis of steel sector demand.If it moves above 108.5 to 109 it gives minimum 10% return.for above 108.5 to 109 buy signal above signal.for sell below 100.For long time investment it is also good stock in the sector to hold. HAVE A SAFE TRADE

Huge Bullish move.This analysis is based on Price Action and Breakout of support and resistance.
Disclaimer: This is for educational purpose. Not a financial advice.

TATA STEEL : BUY NOW AT SUPPORT LEVEL TO HOLDTata Steel Limited is an India-based steel manufacturing company. The Company is engaged in the business of steel making, including raw material and finishing operations.
The stock CMP : 106.30 is currently reversed from downtrend and retested support @ 103.20. There are two formations, one is parallel channel and the second is Symmetrical Triangle Pattern. The stock is at support in both patterns. Appropriate time to enter the trade with least Stop Loss @ 103.50 or 102.25 for targets as 111.20 , 118.90 , 124.40 and 133.10
The positive trend in Nifty Metal , is favoring the trade and Once , 50 EMA crosses over 200 EMA, we may see sharp rise in the price.
This analysis is completely for education purpose, please trade only after your own analysis and at your own risk.
Best of luck !!


tata Steel SpotI have been warning each one of you about the METAL SPACE for atleast 4-6 months now... DO NOT dabble in this space if you do not know how to read the waves on each and every time frame.....Stay Away for Now..... Let it all play out@ above/below. And remember just because my heading says LONG/SHORT.... does not mean it will happen tomorrow.... U have to know the wave structure and act accordingly

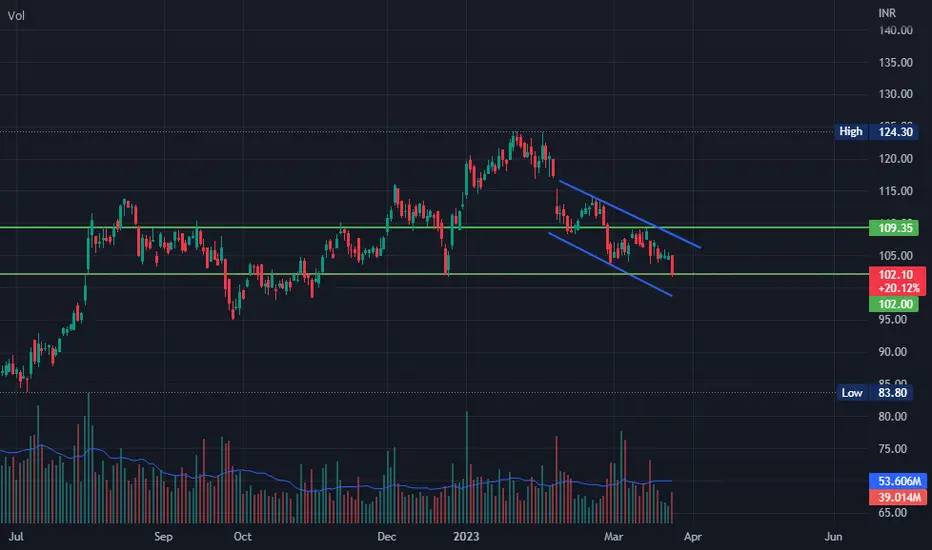
Tata Steel has broken out of the long downward sloping trendlingTata Steel has broken out of the long downward sloping trendling and can resume its upward move in the coming weeks and months on the back of fall in the dollar index. A short term trade can be taken from current price 107.95 for a target of 118/120+, keep stop loss at 98. Please accumulate more if you get 103-107 levels.
Please follow a strict stop loss.
For option lover i also have a trade:-
option buying:- buy tatasteel apr 105ce @4.30
keep a stop loss at 1.5 and go for target 8/10/12+
option writing:-
sell tatasteel apr 115pe @7.45
and hedge with 105pe @1.10
keep a stop loss at 15 for this trade.
Please follow a strict stop loss.
If anyone likes my work please like, follow and comment.
Thankyou

TATASTEEL UP MOVETATASTEEL last up move ,
forming 5th of 5th wave
this is an analysis not a trade advice, trade with due diligence

SHORT TATA STEELSHORT TATA STEEL LTD
CMP - Rs. 107
Target - 1: Rs. 85
Target - 2: Rs. 72
.
Bearish Flag BO on the weekly chart
.
Maximum Returns - 33%
.
This is just a view, please trade at your own risk.
.
Follow me for more!

TATASTEEL weekly chartTATASTEEL has already broken the support trend line and now final support is 99 if break this level possible target is 85

ALMIGHTY LONG OR SHORTHello friends I am sharing the Daily time frame chart of Tata Steel that is looking trading on very well placed horizontal support and stock is trying to make a new rising support trendline after breaking the old one and trading below from that sold support you can say it is standing on crucial spot and waiting for the next move for a directional trade in it by us so I try to prepare two trade ideas sharing below.
🎁🎁This is how we did work like home work after school classes it is easy to identify our tradeable levels in running markets without any hassle or trouble so always study more than trade.
IDEA 1💡- Long if break and close above the rising support trendline because it is acting as resistance now on daily candle basis for the target of 115 stop loss must be a closing below on this trendline.
IDEA 2💡- Short if break and close below the horizontal support trendline for the target of 95 stop loss must be a closing above on this trendline.
SECTOR INDEX ALSO LOOKING WELL PLACED ON SUPPORT 📊📈
📣📣📣📣NOTE-: This is not and trade or investment advice. This idea is meant for learning only. Invest your capital at your own risk
𝐑𝐞𝐠𝐚𝐫𝐝𝐬-: 𝐀𝐦𝐢𝐭 𝐑𝐚𝐣𝐚𝐧

TATASTEEL near supportTATASTEEL near major support
For long (long term buyers) : can accumulate at this level.
For short (only for Futures & Option Traders) : can take short position, if price closes below 101 on daily timeframe, SL @ 103.75, TGT1 : 98.80, TGT2 : 95.80.
Please choose next month expiry for positional trades.
Note : It's your hard earned money always trade with SL, I'm just sharing my analysis

Tata Steel Triangle Pattern Breakdown! Symmetrical Triangle Pattern Formed On daily Chart With Weak Buy's And Shallowing RSI Indicating Further Weakness Upcoming Sessions. Sell ~ 108, With Stop ~ 102. Target ~ 94.50, Expected Target March Expiry.

On supportNSE:TATASTEEL
on crucial support level
this price has been tested many times and maybe act as a bullish divergence if the next two days it closes in green
Another lower's Low pattern can see on the chart and the closing price close at near crucial support if the support breaks then we may see the lower levels