Technical Market ExplodeUnderstanding Sudden Surges in Financial Markets.
Financial markets are complex ecosystems where prices fluctuate constantly due to a mix of economic indicators, investor sentiment, geopolitical events, and technical factors. While many price movements are gradual, markets sometimes experience sudden, sharp movements—a phenomenon often referred to as a technical market explosion. Understanding the causes, mechanics, and implications of these explosive moves is essential for traders, investors, and market analysts alike.
1. Defining a Technical Market Explode
A technical market explode refers to a rapid and significant price movement in a financial instrument, typically driven by technical factors rather than immediate fundamental changes. Unlike fundamental-driven trends, which evolve over time due to earnings, macroeconomic data, or corporate developments, technical explosions are largely triggered by patterns, signals, and market structure dynamics.
Key characteristics include:
High volatility: Prices move sharply in a short period.
Volume spikes: Trading volumes increase significantly as traders react to technical triggers.
Breakout behavior: Prices often breach critical support or resistance levels.
Short-term irrationality: The move may exceed what fundamentals justify temporarily.
Such moves can occur across markets—stocks, commodities, forex, cryptocurrencies, and derivatives.
2. The Technical Drivers Behind Market Explosions
Technical market explosions are rooted in price patterns, trader psychology, and algorithmic responses. Several factors often converge to trigger explosive moves:
a. Support and Resistance Breakouts
In technical analysis, support represents a price level where buying interest is strong enough to prevent further declines, while resistance is where selling pressure halts upward movement. When prices decisively break these levels:
Stop-loss cascades occur as protective orders are triggered, amplifying the move.
Momentum trading accelerates the trend as traders pile in on the breakout.
Example: A stock trading consistently at ₹500 may suddenly jump to ₹550 when resistance is breached, causing a surge in both price and trading volume.
b. Technical Chart Patterns
Chart patterns are visual representations of market psychology. Explosive movements often emerge from:
Triangles (ascending, descending, symmetrical): Breakouts from these formations often lead to strong directional moves.
Flags and pennants: Typically continuation patterns, these suggest a brief consolidation before a rapid movement in the prevailing trend.
Double tops and bottoms: Reversals indicated by these patterns can trigger sudden price acceleration once confirmation occurs.
c. Moving Average Crossovers
Moving averages smooth out price data to identify trends. Certain crossovers are considered powerful technical signals:
Golden cross: Short-term moving average crosses above a long-term average, signaling bullish momentum.
Death cross: The reverse, signaling bearish momentum.
These crossovers often trigger algorithmic and retail trading strategies, leading to sudden volume spikes.
d. Momentum and Oscillator Signals
Indicators such as Relative Strength Index (RSI), MACD (Moving Average Convergence Divergence), and stochastic oscillators gauge overbought or oversold conditions:
When multiple indicators align (e.g., RSI breaks above 70 while MACD gives a bullish crossover), traders perceive high probability setups, fueling explosive buying or selling.
Divergence between price and indicators can also anticipate sudden reversals.
e. Algorithmic and High-Frequency Trading (HFT)
Modern markets are heavily influenced by automated trading systems:
Algorithms detect patterns, volume anomalies, and news triggers faster than humans.
When thresholds are met, HFT programs execute thousands of trades within milliseconds, magnifying price movements.
A minor technical signal can snowball into a massive market explode due to algorithmic chain reactions.
3. Psychological Factors Amplifying Explosive Moves
Market psychology plays a critical role. Technical explosions are often fueled by collective human behavior:
Fear and greed cycles: Sudden breakouts trigger fear of missing out (FOMO) or panic selling.
Herding behavior: Traders often mimic successful peers, amplifying momentum.
Overreaction to technical signals: Even a small pattern confirmation can lead to exaggerated price moves as sentiment overtakes logic.
This explains why technical explosions may appear irrational relative to underlying fundamentals.
4. Common Triggers of Technical Market Explosions
While technical factors set the stage, specific triggers often initiate explosive moves:
a. News and Events Alignment
Even technically driven markets can be sparked by news:
Earnings surprises
Regulatory announcements
Macro data releases
Geopolitical events
When a technical setup coincides with news, the market explode is amplified.
b. Liquidity Gaps
Thinly traded instruments are prone to sharp price changes:
A small order can move the price dramatically.
Gaps in trading (e.g., overnight or weekend) may create sudden explosive price jumps at market open.
c. Derivatives Expiry and Hedging Activity
Futures and options expirations can intensify technical moves:
Large open interest positions lead to aggressive buying or selling near strike prices.
Margin calls and portfolio hedging can accelerate price shifts.
d. Global Market Correlations
Markets today are interconnected:
A sudden move in the US stock market, crude oil, or forex can trigger spillover effects.
Technical setups in one market may be triggered by movement in another correlated asset.
5. Measuring and Managing Technical Explosions
Traders and analysts use tools to measure and navigate explosive moves:
a. Volatility Metrics
Average True Range (ATR): Quantifies price volatility, helping anticipate potential explosive ranges.
Bollinger Bands: Highlight price deviations; moves outside bands often precede rapid corrections or continuation.
b. Risk Management Techniques
Use stop-loss orders to protect against sudden reversals.
Maintain position sizing discipline to avoid excessive exposure during high-volatility periods.
Diversify across instruments to mitigate correlated market shocks.
c. Sentiment and Volume Analysis
Spike in trading volume validates breakout strength.
Unusually high volume with minor price movement may signal accumulation before an explosive move.
6. Case Studies of Technical Market Explosions
Examining historical instances provides practical insights:
Tesla (TSLA) stock in 2020: Repeated breakouts above key resistance levels, amplified by retail trading and algorithmic strategies, resulted in multiple explosive rallies.
Bitcoin surges in 2017 and 2020: Price exploded beyond technical patterns such as triangles and Fibonacci retracement levels, fueled by momentum trading, social media hype, and retail FOMO.
Nifty 50 intraday moves in India: Sudden breakouts above pivot levels often trigger intraday explosive trading, amplified by derivatives and algorithmic programs.
These examples illustrate how technical setups, combined with psychology, volume, and external triggers, create rapid price acceleration.
7. Implications for Traders and Investors
Understanding technical market explosions offers both opportunities and risks:
Profit potential: Traders exploiting breakouts, momentum signals, and trend confirmations can capture substantial gains.
Risk of whipsaws: False breakouts (“fakeouts”) can trap traders, leading to sudden losses.
Long-term perspective: Investors should distinguish between short-term technical moves and sustainable fundamental trends.
Algorithmic competition: Manual traders must compete with faster, automated systems, increasing complexity and execution risk.
8. Strategies to Navigate Technical Explosions
To harness opportunities and mitigate risks:
Confirm breakouts: Look for volume confirmation and multiple technical indicators.
Set entry and exit rules: Predetermine stop-loss and profit targets.
Trade in small increments: Avoid oversized positions that could result in catastrophic losses during volatile spikes.
Monitor correlated markets: Awareness of global triggers and sector-specific events can enhance decision-making.
Combine technical with fundamentals: Even technically driven explosions eventually interact with fundamental realities; balance both perspectives.
9. Conclusion
A technical market explode represents one of the most dynamic and challenging aspects of modern financial markets. Triggered by a mix of price patterns, indicators, algorithmic activity, and human psychology, these sudden movements offer both opportunities and risks. While they can appear unpredictable, careful analysis of support and resistance, chart patterns, momentum indicators, volume, and market correlations can help traders anticipate and navigate explosive price moves.
In an era dominated by algorithmic trading and real-time information, technical market explosions are increasingly frequent. For those who master the technical nuances, risk management, and psychological awareness required, these moments provide a fertile ground for substantial gains. However, neglecting these factors can transform an opportunity into a costly mistake.
Ultimately, technical market explosions remind traders and investors that markets are not merely mathematical constructs—they are reflections of human behavior, collective sentiment, and the interplay between knowledge, perception, and action.
Trade ideas
News Impact on Trading Decisions1. Introduction to News-Based Trading
News-based trading, often referred to as event-driven trading, is a strategy where market participants react to new information to anticipate and profit from price movements. News can include economic releases, corporate announcements, geopolitical developments, central bank communications, or even unexpected global events such as natural disasters or pandemics. The rationale behind news trading is simple: markets tend to adjust quickly when new information alters the perceived value of an asset.
Traders often categorize news into two main types: scheduled news and unscheduled news.
Scheduled News: These are events known in advance, such as central bank interest rate decisions, quarterly earnings reports, employment data, inflation figures, and GDP releases. Since the timing and nature of these releases are anticipated, traders can prepare strategies in advance, such as setting stop-loss levels, entry points, or hedging positions.
Unscheduled News: These are unexpected events that can have immediate and dramatic market consequences. Examples include political upheavals, terrorist attacks, regulatory announcements, or sudden corporate scandals. Because these events are unanticipated, they often trigger rapid market reactions and higher volatility.
2. The Psychological and Behavioral Impact of News
Market reactions to news are not always purely rational. Behavioral finance suggests that human psychology, including emotions like fear, greed, and overconfidence, heavily influences trading decisions. News can amplify these psychological responses in several ways:
Fear and Panic: Negative news, such as economic recessions or corporate scandals, often triggers panic selling. Traders may exit positions quickly to limit losses, causing sharp downward price movements.
Greed and Optimism: Positive news, such as strong earnings or favorable government policies, can create FOMO (Fear of Missing Out), prompting traders to buy aggressively. This can push prices above their intrinsic value in the short term.
Herd Behavior: Traders often mimic the actions of others during major news events. If influential market players act decisively on news, others tend to follow, amplifying the market reaction.
Understanding these psychological responses allows traders to anticipate short-term price movements and manage their positions more effectively.
3. Types of News and Their Market Impact
News can influence trading decisions differently depending on its type and significance:
a) Economic News
Economic indicators such as inflation, unemployment rates, consumer confidence, and industrial production affect traders’ perception of a country’s economic health. For example, higher-than-expected inflation might trigger fears of interest rate hikes, causing bond prices to fall and the local currency to strengthen. Traders often use economic calendars to track such announcements and position themselves accordingly.
b) Corporate News
Corporate announcements, including earnings reports, dividend declarations, mergers and acquisitions, or management changes, directly impact individual stocks. A company reporting higher-than-expected profits may see its stock rise, while a profit warning could lead to rapid sell-offs. Institutional traders often analyze these reports in detail, considering not only the headline numbers but also guidance and forward-looking statements.
c) Political and Geopolitical News
Elections, government policy changes, trade negotiations, and conflicts can influence market sentiment. For instance, news of favorable trade agreements may boost market optimism, while geopolitical tensions may increase risk aversion, benefiting safe-haven assets like gold or government bonds.
d) Market Rumors and Speculative News
Even unverified news can influence markets, especially in the short term. Social media and financial news portals often disseminate rumors that create temporary price swings. Traders using algorithmic systems may react within milliseconds, leading to sudden spikes or drops.
4. News Trading Strategies
Traders adopt various strategies to capitalize on news events. These strategies range from reactive to proactive, depending on the trader’s risk appetite and time horizon.
a) Event-Driven Trading
Event-driven traders specifically target scheduled or unscheduled events that are likely to create significant market volatility. For example, a trader may position themselves ahead of a central bank meeting, expecting a certain interest rate outcome.
b) Momentum Trading
News often initiates momentum trends. Traders may follow the initial price movement triggered by news, entering positions in the direction of the trend. The idea is to ride the wave of market sentiment until signs of reversal appear.
c) Contrarian Trading
Contrarian traders take positions opposite to the initial market reaction to news. They may believe that markets overreact to certain news, creating opportunities to profit from price corrections.
d) Algorithmic and High-Frequency Trading
Modern trading relies heavily on technology to react to news at lightning speed. Algorithms scan news feeds, social media, and economic releases to execute trades in milliseconds. High-frequency traders capitalize on the brief windows of price inefficiencies caused by news.
5. Challenges of Trading Based on News
While news trading can be profitable, it comes with significant challenges:
Market Volatility: News events often create rapid price fluctuations, increasing the risk of slippage and triggering stop-loss orders.
Information Overload: Traders face an overwhelming amount of news daily. Distinguishing between material and trivial news is critical.
Unpredictable Reactions: Market responses are not always intuitive. Positive news may lead to selling if investors had anticipated even better outcomes, and vice versa. This phenomenon is often referred to as “buy the rumor, sell the news.”
Time Sensitivity: News impact is usually short-lived. Traders must act quickly to capitalize on opportunities, which requires constant monitoring and decision-making.
Manipulation Risks: Some market participants may attempt to manipulate prices through false or misleading news, making it essential for traders to verify information before acting.
6. Case Studies Illustrating News Impact
a) Economic Announcements
For example, in 2023, when the U.S. Federal Reserve unexpectedly signaled a pause in interest rate hikes, the stock market surged, while bond yields fell. Traders who anticipated or quickly reacted to this news profited from the immediate price movements.
b) Corporate Earnings
Apple Inc.’s quarterly earnings often move not only its stock but also the broader technology sector. A higher-than-expected revenue report can create a ripple effect across indices, influencing related stocks and ETFs.
c) Geopolitical Events
During the Russia-Ukraine conflict, oil and gas prices surged due to supply concerns. Traders who positioned themselves correctly benefited from rapid price appreciation, while those unprepared faced substantial losses.
7. Tools and Techniques for News-Based Trading
Successful news trading relies on timely and reliable information. Traders use a combination of tools:
News Feeds: Services like Bloomberg, Reuters, and Dow Jones provide real-time news updates.
Economic Calendars: Platforms like Forex Factory list scheduled economic releases, allowing traders to prepare.
Social Media Monitoring: Twitter, Reddit, and financial forums often disseminate early information, which some traders use for short-term positioning.
Sentiment Analysis Tools: Algorithms and AI-driven tools analyze market sentiment from news articles, social media, and press releases to gauge potential market reactions.
Trading Platforms: Advanced platforms allow for instant order execution, essential for capitalizing on news-driven price moves.
8. Risk Management in News Trading
Given the volatility associated with news, risk management is crucial. Traders use several techniques:
Stop-Loss Orders: Automatically exit positions when prices reach a predefined level to limit losses.
Position Sizing: Adjusting the size of trades to reduce exposure during high-volatility events.
Hedging: Using options, futures, or other derivatives to offset potential losses.
Diversification: Avoid concentrating on a single asset or market to spread risk.
9. The Future of News Impact on Trading
As technology evolves, the impact of news on trading will continue to grow. Artificial intelligence, machine learning, and natural language processing allow traders to parse news faster and more accurately than ever before. Algorithmic trading systems that respond in milliseconds are likely to dominate, making timely access to verified news an even more critical factor. Additionally, social media platforms are becoming increasingly influential, amplifying the speed and reach of news-driven market reactions.
However, human judgment will remain vital. Understanding context, market psychology, and the nuances of geopolitical and corporate developments can give traders an edge that pure automation may not fully replicate.
10. Conclusion
News is a powerful force in financial markets, shaping investor behavior, influencing asset prices, and creating both opportunities and risks for traders. Understanding the types of news, market psychology, and appropriate trading strategies is essential for capitalizing on information-driven price movements. While technology and algorithms provide speed and efficiency, successful news trading requires careful analysis, risk management, and a nuanced understanding of market dynamics.
Ultimately, traders who can effectively interpret news and act decisively are better positioned to navigate the ever-changing landscape of financial markets. Whether trading equities, currencies, commodities, or derivatives, recognizing the profound impact of news is a cornerstone of informed and strategic trading.
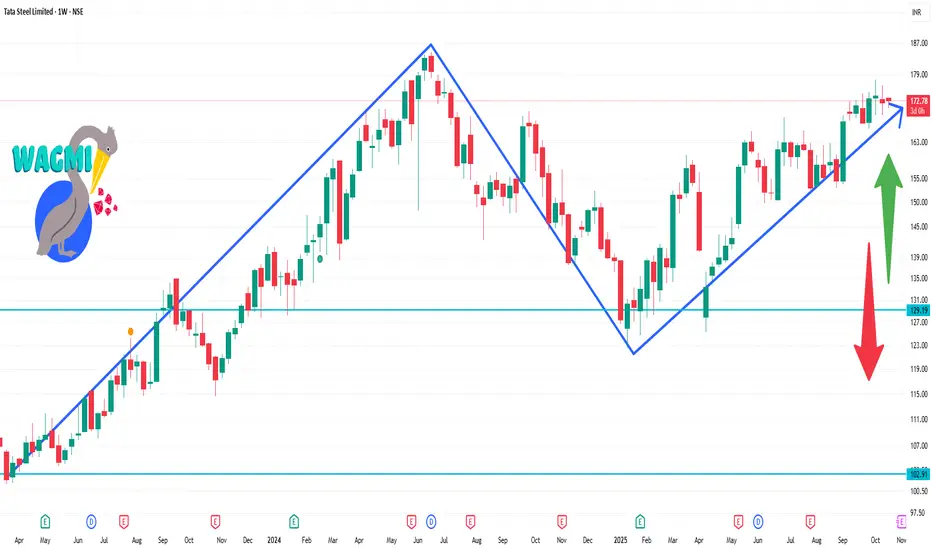
TATASTEEL 1 WEEK Time Frame ✅ Current Technical Picture
The stock is trading around ₹172.
On the weekly time-frame, one source flags a “Strong Buy”.
On the short term (1-week/moving averages/oscillators), other sources show caution:
One platform shows the 1-week summary as “Bearish” (moving averages & oscillators) for the week-frame.
Support levels are mentioned around ₹167-169 and further around ~₹157 in case of deeper pull-back.
Resistance or recent highs near the ~₹173-175 zone.
🎯 Key Levels to Watch (1-week horizon)
Support:
First support around ~ ₹167-169. (If price dips)
A deeper support/accumulated volume zone near ~ ₹157-160 if weakness extends.
Resistance / Ceiling:
Near term resistance ~ ₹172-175. Price recently around that level.
If bullish momentum builds, breakout above ~₹175 could open further upside (but stronger risk).
The Rise of the Indian Stock MarketIntroduction
The Indian stock market has undergone a phenomenal transformation over the past three decades, evolving from a largely unregulated and paper-based trading system into one of the most dynamic and technologically advanced financial markets in the world. Once perceived as volatile and opaque, India’s equity market has now become a pillar of the nation’s economic growth, attracting both domestic and global investors. This rise is not just a reflection of corporate profitability or market capitalization—it symbolizes India’s journey toward financial maturity, economic resilience, and global competitiveness.
The rise of the Indian stock market is a story shaped by reforms, innovation, globalization, and a growing culture of financial participation. From the establishment of modern stock exchanges like the NSE to the adoption of cutting-edge technology and the inclusion of millions of retail investors, India’s capital market has become a robust ecosystem that supports entrepreneurship, infrastructure, and economic expansion.
Historical Evolution of the Indian Stock Market
The origins of the Indian stock market can be traced back to the Bombay Stock Exchange (BSE), established in 1875, making it one of the oldest stock exchanges in Asia. However, for much of its early history, the market was dominated by a small group of brokers and traders, with limited transparency and accessibility. The real transformation began in the 1990s, when India embarked on a series of economic liberalization reforms.
The 1991 economic reforms, spearheaded by then Finance Minister Dr. Manmohan Singh, marked a turning point. India opened its economy to global competition, reduced trade barriers, and modernized financial systems. These reforms created the foundation for a modern capital market structure.
In 1992, the establishment of the Securities and Exchange Board of India (SEBI) as the market regulator played a crucial role in enforcing transparency, protecting investors, and curbing malpractices. The same year saw the Harshad Mehta scam, which exposed systemic weaknesses but also accelerated regulatory modernization. The subsequent launch of the National Stock Exchange (NSE) in 1994 brought technological innovation and electronic trading, replacing the traditional open outcry system.
Technological Advancements and Market Modernization
Technology has been the single most important driver of efficiency in the Indian stock market. The introduction of electronic trading systems by NSE revolutionized how securities were bought and sold. It eliminated the physical share certificates and enabled dematerialization, making trading faster, safer, and more transparent.
The establishment of National Securities Depository Limited (NSDL) in 1996 and Central Depository Services Limited (CDSL) in 1999 allowed investors to hold securities in electronic form. This move significantly reduced the risks of forgery, delays, and settlement failures.
With the advent of online trading platforms, mobile applications, and discount brokers, the stock market became more accessible to retail investors. Platforms like Zerodha, Groww, and Upstox have democratized participation by allowing individuals to trade at minimal cost with just a smartphone. The rise of algorithmic trading and high-frequency trading (HFT) further enhanced liquidity and market depth.
Today, the Indian stock market operates on a T+1 settlement cycle, one of the fastest globally, showcasing its efficiency and readiness for the digital age.
Growth in Market Capitalization and Global Standing
The Indian equity market has grown exponentially in terms of market capitalization. As of 2025, India’s total market capitalization exceeds USD 5 trillion, making it the fifth-largest stock market in the world, surpassing major economies like the UK and France.
Indices such as the Nifty 50 and Sensex have delivered substantial long-term returns, reflecting strong corporate performance and economic growth. The Sensex, which stood at around 1,000 points in 1990, has now crossed 80,000 points, symbolizing the massive wealth creation potential of the Indian market.
India’s rise has also been fueled by inclusion in global investment indices such as the MSCI Emerging Markets Index, which has drawn billions in Foreign Institutional Investor (FII) inflows. Despite global volatility, India’s market remains one of the most resilient, backed by a strong domestic investor base.
The Role of Domestic Investors
One of the most defining features of the Indian stock market’s rise has been the growing participation of domestic investors. Traditionally, Indian households preferred gold, real estate, and fixed deposits as investment avenues. However, over the last decade, a financial literacy wave and increased access to digital investment platforms have encouraged millions to invest in equities and mutual funds.
The number of Demat accounts in India has surged from around 2 crore in 2014 to over 15 crore by 2025. Systematic Investment Plans (SIPs) have become a cultural phenomenon, with monthly inflows surpassing ₹20,000 crore in 2025. This consistent domestic participation provides a stable base of liquidity and reduces dependency on foreign capital.
The rise of retail investors has also changed market dynamics. Retail participation now accounts for over 40% of total trading volume, bringing diversification and depth to the equity market. This broad-based engagement makes the Indian market less vulnerable to foreign outflows during global shocks.
Policy Reforms and Regulatory Strength
The rise of India’s stock market is inseparable from the country’s robust regulatory framework. SEBI, as the watchdog of capital markets, has implemented reforms to ensure transparency, fairness, and investor protection. Key policy initiatives include:
Implementation of Disclosure Norms: Companies are required to disclose financial and operational details regularly to ensure transparency.
Corporate Governance Reforms: The introduction of independent directors, audit committees, and stricter compliance mechanisms has improved trust in listed companies.
Market Surveillance: Advanced monitoring systems detect suspicious trading patterns and insider trading.
Investor Education Programs: SEBI conducts workshops and campaigns to promote financial literacy.
Ease of Listing: The introduction of the SME Platform and Innovators Growth Platform (IGP) enables startups and small enterprises to raise capital efficiently.
Additionally, tax incentives, liberalization of FDI norms, and the establishment of the GIFT City (Gujarat International Finance Tec-City) as an international financial hub have strengthened India’s global appeal.
Integration with Global Markets
India’s integration with global capital markets has been a vital catalyst for its stock market growth. The liberalization of foreign investment norms in the early 1990s allowed Foreign Institutional Investors (FIIs) and Foreign Portfolio Investors (FPIs) to participate actively in Indian equities. Today, FIIs hold a significant share in top Indian companies, contributing to liquidity and global visibility.
Global financial institutions like Goldman Sachs, BlackRock, and Vanguard have a major presence in India. The introduction of GIFT Nifty, an international version of Nifty trading in USD at GIFT City, has further strengthened India’s connection with global investors, allowing round-the-clock trading linked to global time zones.
This global integration not only brings foreign capital but also instills best practices in governance, risk management, and compliance.
Sectoral Growth and Corporate Expansion
The Indian stock market’s rise has been powered by the growth of multiple sectors. The IT sector, led by companies like Infosys, TCS, and Wipro, established India as a global technology hub. The banking and financial services sector has seen massive expansion, driven by private banks and NBFCs. The pharmaceutical, automobile, and energy sectors have also played crucial roles.
The emergence of new-age companies in e-commerce, fintech, and renewable energy—such as Zomato, Paytm, and Adani Green Energy—has diversified the market landscape. India’s start-up ecosystem, now the world’s third-largest, increasingly taps equity markets for funding, reflecting the market’s role in supporting innovation and entrepreneurship.
Impact of Macroeconomic Factors
India’s sustained GDP growth, demographic dividend, and policy stability have all contributed to the stock market’s rise. The country’s young population, rising middle-class consumption, and growing digital economy fuel long-term corporate earnings growth. Additionally, fiscal measures like Goods and Services Tax (GST) and Production Linked Incentive (PLI) schemes have boosted formalization and manufacturing competitiveness.
Even during global crises such as the COVID-19 pandemic, India’s markets rebounded sharply due to monetary support from the Reserve Bank of India (RBI), government stimulus, and strong retail investor confidence. This resilience highlights India’s growing independence from external shocks.
Challenges and Risks Ahead
Despite its remarkable progress, the Indian stock market faces several challenges:
Market Volatility: Global economic uncertainties and geopolitical tensions can trigger sharp fluctuations.
Corporate Governance Issues: While regulations have improved, lapses in governance occasionally erode investor trust.
Valuation Concerns: At times, high valuations raise concerns of speculative bubbles.
Dependence on Policy Support: Excessive reliance on government incentives could distort market efficiency.
Financial Literacy Gap: A significant section of the population still lacks understanding of market risks and diversification.
Addressing these issues is essential to sustain long-term growth and stability.
The Road Ahead
The future of the Indian stock market looks promising. With projections indicating that India could become the third-largest economy by 2030, the equity market is poised to expand further. The government’s continued focus on infrastructure development, digital transformation, and manufacturing growth under initiatives like Make in India will provide significant momentum.
Emerging trends such as sustainable investing (ESG), AI-driven trading analytics, and financial inclusion will define the next phase of growth. Moreover, the deepening of bond markets, REITs, and InvITs will diversify India’s capital market landscape.
If reforms continue and investor education expands, the Indian stock market could well emerge as a global powerhouse, rivaling mature markets in the U.S. and Europe.
Conclusion
The rise of the Indian stock market is a testament to the country’s economic resilience, policy vision, and technological innovation. From a fragmented system in the 1980s to a digital-first, globally integrated marketplace in 2025, India’s equity market has come a long way. It has empowered investors, funded industries, and contributed significantly to national growth.
As India stands on the cusp of becoming a global economic leader, its stock market will continue to play a crucial role—not only as a barometer of economic health but as a driver of wealth creation and innovation. The journey of the Indian stock market is far from over; it is entering a new phase of maturity, global relevance, and inclusiveness that promises a bright financial future for millions of investors and the nation as a whole.
Understanding Equity Market Structure in IndiaIntroduction
The equity market, often called the stock market, serves as the backbone of a country’s financial ecosystem. In India, it represents the vibrant and ever-evolving marketplace where companies raise capital and investors participate in wealth creation. Understanding the equity market structure in India is essential for anyone involved in trading, investing, or policymaking. It provides insight into how the market operates, who its participants are, how securities are traded, and how regulation ensures transparency and fairness.
India’s equity market has come a long way—from physical trading floors in the 1980s to a fully electronic, globally integrated system today. The structure comprises various layers, institutions, and participants, each performing specific roles to ensure the efficient functioning of the capital market.
1. Evolution of the Indian Equity Market
The Indian stock market has a rich history dating back to the 19th century when the Bombay Stock Exchange (BSE) was established in 1875. Initially, trading was informal, conducted under banyan trees in Mumbai by a group of brokers. However, with the liberalization of the Indian economy in 1991, the market witnessed modernization and rapid growth.
The introduction of the National Stock Exchange (NSE) in 1992 brought electronic trading, transparency, and efficiency. The Securities and Exchange Board of India (SEBI), formed in 1988 and granted statutory powers in 1992, became the principal regulator ensuring investor protection and market discipline. Today, India boasts one of the most advanced and liquid equity markets among emerging economies.
2. Structure of the Indian Equity Market
The Indian equity market operates through a two-tier structure:
Primary Market – where companies issue new shares to raise capital.
Secondary Market – where existing shares are traded among investors.
Let’s explore each in detail.
(a) The Primary Market
The primary market facilitates capital formation. Companies issue securities for the first time through Initial Public Offerings (IPOs), Follow-on Public Offers (FPOs), or Rights Issues. Investors purchase shares directly from the issuing company, and the proceeds are used for business expansion, debt repayment, or diversification.
Key participants include:
Issuing companies
Merchant bankers
Underwriters
Registrars
Investors
Regulation of the primary market is handled by SEBI, which ensures full disclosure of financial information, proper valuation, and transparent allotment processes. The IPO process in India involves book-building, anchor investors, and electronic bidding through platforms like ASBA (Application Supported by Blocked Amount).
(b) The Secondary Market
Once shares are listed on exchanges, they become tradable in the secondary market. Here, investors buy and sell shares through brokers on recognized exchanges such as NSE and BSE. The secondary market ensures liquidity and continuous price discovery.
Trades occur electronically through order-matching systems, with prices determined by demand and supply. This digital infrastructure has enhanced speed, accuracy, and transparency.
3. Major Stock Exchanges in India
India’s equity trading primarily occurs on two major exchanges:
(a) Bombay Stock Exchange (BSE)
Founded in 1875, BSE is Asia’s oldest exchange and one of the fastest in the world. Its benchmark index, SENSEX, tracks the performance of 30 top companies representing key sectors of the Indian economy. The BSE provides a wide range of products including equities, mutual funds, derivatives, and debt instruments.
(b) National Stock Exchange (NSE)
Established in 1992, NSE revolutionized Indian trading by introducing a fully automated, screen-based trading system. Its benchmark index, NIFTY 50, reflects the performance of the top 50 companies listed on the exchange. NSE is the largest exchange in India by trading volume and market capitalization.
Other regional exchanges such as Calcutta Stock Exchange (CSE) and Metropolitan Stock Exchange (MSE) exist but play a minor role compared to NSE and BSE.
4. Key Participants in the Indian Equity Market
The structure of the equity market is defined by the roles of various participants who ensure smooth operations.
(a) Investors
Investors are the backbone of the equity market and include:
Retail investors – individuals investing small amounts.
High Net-Worth Individuals (HNIs) – individuals with significant investable wealth.
Institutional investors – such as Mutual Funds, Pension Funds, Insurance Companies, and Foreign Portfolio Investors (FPIs).
(b) Brokers and Sub-brokers
Brokers are SEBI-registered members of exchanges who facilitate trading on behalf of clients. Sub-brokers operate under registered brokers to provide localized access to investors.
(c) Market Makers and Dealers
Market makers ensure liquidity by providing continuous buy and sell quotes. Dealers, on the other hand, trade securities on their own account.
(d) Depositories and Depository Participants (DPs)
India has two main depositories:
NSDL (National Securities Depository Limited)
CDSL (Central Depository Services Limited)
These institutions hold securities in dematerialized (Demat) form and facilitate the electronic transfer of ownership. DPs act as intermediaries between investors and depositories.
(e) Clearing Corporations
Entities like the National Securities Clearing Corporation Limited (NSCCL) and Indian Clearing Corporation Limited (ICCL) manage trade settlement, ensuring that funds and securities are exchanged efficiently and securely.
(f) Regulators
The Securities and Exchange Board of India (SEBI) regulates the equity market, ensuring transparency, investor protection, and compliance. The Reserve Bank of India (RBI) and Ministry of Finance also play supportive regulatory roles.
5. Trading Mechanism and Settlement Process
The Indian equity market uses an order-driven, automated trading system where buyers and sellers place orders through brokers using trading terminals.
Steps in the Trading Process:
Placing the order – The investor instructs the broker to buy or sell shares.
Order matching – The exchange’s electronic system matches buy and sell orders based on price and time priority.
Trade confirmation – Once matched, the trade is confirmed and recorded.
Clearing and settlement – Managed by clearing corporations.
India follows a T+1 settlement cycle (trade plus one business day).
Shares are credited to the buyer’s Demat account, and funds are transferred to the seller’s account.
This efficient system ensures minimal counterparty risk and prompt settlement.
6. Market Segments within the Equity Market
The equity market in India can be divided into various segments:
(a) Cash Market
Here, stocks are bought and sold for immediate delivery. The buyer gains ownership immediately after settlement.
(b) Derivatives Market
This includes trading in Futures and Options (F&O) contracts, where traders speculate on price movements or hedge risk. The derivative market in India has grown exponentially, making NSE one of the largest F&O exchanges globally.
(c) Institutional Trading Platforms (ITPs)
These allow unlisted companies, particularly startups, to raise capital and trade shares among institutional investors before going for a full IPO.
7. Indices and Market Benchmarks
Indices serve as barometers for market performance. The two most tracked indices are:
BSE SENSEX – tracks 30 large, financially sound companies.
NSE NIFTY 50 – represents 50 top companies across sectors.
Other sectoral and thematic indices include:
NIFTY Bank, NIFTY IT, NIFTY FMCG, etc.
These help investors gauge performance in specific industries.
8. Regulatory Framework
(a) Role of SEBI
SEBI’s mission is to protect investors, regulate intermediaries, and promote market development. Its major functions include:
Ensuring fair practices in IPOs and secondary market trading.
Monitoring insider trading and market manipulation.
Registering and supervising intermediaries like brokers, merchant bankers, and portfolio managers.
Implementing investor grievance mechanisms.
(b) Other Regulatory Bodies
RBI regulates capital inflows and outflows.
Ministry of Corporate Affairs (MCA) oversees corporate governance.
Stock Exchanges enforce listing obligations and compliance norms.
9. Technological Advancements and Digitalization
Technology has transformed the Indian equity market, making it more accessible and efficient.
Key innovations include:
Online trading platforms like Zerodha, Groww, and Upstox democratized investing for retail participants.
Algorithmic trading and High-Frequency Trading (HFT) increased liquidity and efficiency.
Mobile-based trading enabled real-time market participation.
Blockchain and AI tools are emerging for risk analysis and settlement processes.
The transition to a T+1 settlement cycle and the potential move toward instant settlement (T+0) further demonstrate India’s leadership in market modernization.
10. Foreign Participation and Global Integration
India’s equity market attracts global investors due to its growth potential, regulatory transparency, and robust infrastructure. Foreign Portfolio Investors (FPIs) play a key role, bringing in capital and global best practices.
FPIs invest in listed equities and debt instruments, regulated by SEBI.
Foreign Direct Investment (FDI), on the other hand, involves long-term investments in companies.
Global indices such as MSCI and FTSE include Indian equities, enhancing international visibility and liquidity.
11. Challenges in the Indian Equity Market
Despite its progress, the Indian equity market faces challenges such as:
Market volatility due to global economic uncertainty.
Low financial literacy among retail investors.
Corporate governance issues in some listed firms.
Regulatory complexity for foreign investors.
High concentration of trading in a few large-cap stocks.
Efforts by SEBI, stock exchanges, and financial institutions aim to address these challenges through education, transparency, and inclusive market policies.
12. Future Outlook of the Indian Equity Market
The future of India’s equity market looks promising. Several trends indicate robust growth potential:
Increased retail participation fueled by digital access and financial awareness.
Integration with global markets through international listings and GIFT City initiatives.
Expansion of derivative and SME platforms enhancing depth and liquidity.
Sustainable and ESG investing gaining traction among institutional investors.
AI-driven analytics reshaping trading strategies and investment decisions.
With India projected to become the world’s third-largest economy, its equity market will play a pivotal role in channeling capital to productive sectors and driving economic growth.
Conclusion
The Indian equity market is a dynamic and well-regulated system that has evolved into a cornerstone of the country’s financial stability and economic expansion. Its structure—comprising the primary and secondary markets, diverse participants, robust exchanges, and stringent regulatory oversight—ensures efficient capital allocation, investor protection, and continuous innovation.
From the traditional trading floors of the Bombay Stock Exchange to the algorithm-driven platforms of the modern era, India’s equity market reflects a journey of progress, resilience, and transformation. As digitalization, globalization, and financial inclusion continue to advance, the market’s structure will further strengthen, making it a global benchmark for transparency and growth in emerging economies.

TATASTEELI’m Lenin, a trader specializing in zone-based supply & demand strategies across forex, stocks, and commodities. My focus is precision entries, disciplined risk management, and consistent intraday setups.

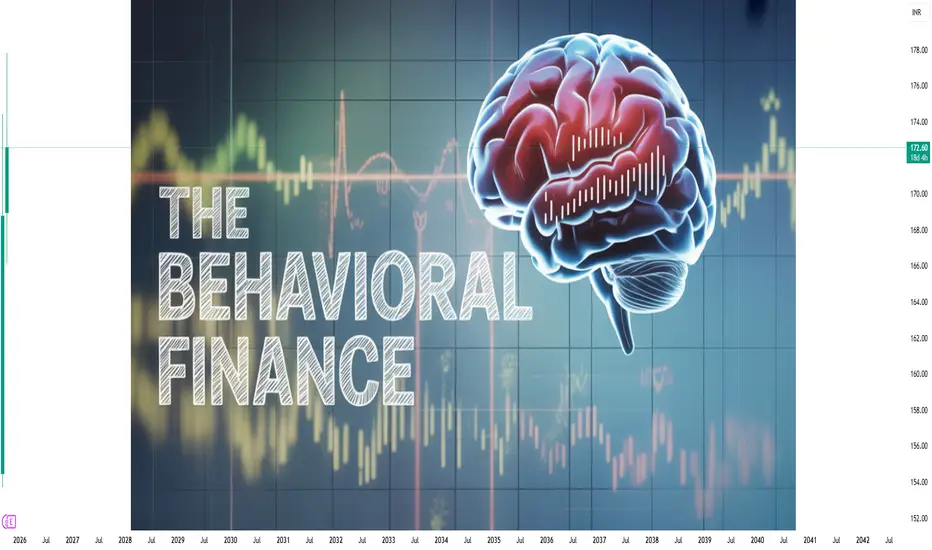
Behavioral Finance and Trader Psychology:Introduction
The traditional models of finance and economics often assume that individuals are rational decision-makers, consistently acting in their best interests to maximize utility. However, real-world financial behavior frequently deviates from these assumptions. Behavioral finance and trader psychology delve into the psychological influences and biases that affect financial decision-making, challenging the notion of rational actors in the market.
Behavioral Finance: An Overview
Definition and Emergence
Behavioral finance is a subfield of behavioral economics that examines how psychological factors influence financial behaviors and market outcomes. It emerged in the late 1970s as a response to the Efficient Market Hypothesis (EMH), which posits that asset prices reflect all available information and thus always trade at their fair value. Behavioral finance contends that cognitive biases and emotional factors lead to market anomalies and inefficiencies.
Key Concepts in Behavioral Finance
Cognitive Biases: These are systematic patterns of deviation from norm or rationality in judgment, whereby inferences about other people and situations may be drawn in an illogical fashion. Common cognitive biases include:
Confirmation Bias: The tendency to search for, interpret, favor, and recall information in a way that confirms one's preexisting beliefs or hypotheses.
Anchoring Bias: The reliance on the first piece of information encountered (the "anchor") when making decisions.
Overconfidence Bias: The tendency to overestimate one's own abilities, knowledge, or control over events.
Availability Bias: The tendency to overestimate the likelihood of events based on their availability in memory.
Emotional Biases: These biases arise from emotions and feelings that influence decision-making. Examples include:
Loss Aversion: The tendency to prefer avoiding losses rather than acquiring equivalent gains; it's better to not lose $5 than to find $5.
Regret Aversion: The reluctance to make decisions due to the fear of making a wrong choice and the potential for future regret.
Herd Behavior: The tendency to mimic the actions (rational or irrational) of a larger group, often leading to asset bubbles or crashes.
Market Implications
Behavioral finance explains various market phenomena that traditional theories struggle with, such as asset bubbles, market crashes, and anomalies like the January effect or momentum. It suggests that markets are not always efficient and that prices can deviate from their intrinsic values due to collective psychological factors.
Trader Psychology: The Emotional Landscape of Trading
Definition and Importance
Trader psychology refers to the emotional and mental state of a trader, which significantly impacts their trading decisions and performance. Understanding trader psychology is crucial because emotions like fear, greed, and hope can lead to impulsive decisions, overtrading, or holding onto losing positions longer than rational analysis would suggest.
Common Psychological Challenges
Fear and Greed: These are the two primary emotions that drive market behavior. Fear can lead to panic selling during downturns, while greed can result in chasing after high-risk, high-reward opportunities during bull markets.
Overtrading: Driven by the desire to make profits or recover losses, traders may engage in excessive trading, leading to higher transaction costs and potential losses.
Loss Aversion: Traders may hold onto losing positions longer than advisable, hoping the market will turn in their favor, due to the psychological pain associated with realizing a loss.
Confirmation Bias: Traders may seek information that confirms their existing beliefs about a trade, ignoring contradictory evidence, which can lead to poor decision-making.
Strategies for Managing Trader Psychology
Developing a Trading Plan: Having a clear plan with defined entry and exit points can help mitigate emotional decision-making.
Risk Management: Setting stop-loss orders and position sizes can prevent significant losses and reduce emotional stress.
Mindfulness and Emotional Awareness: Practicing mindfulness can help traders recognize emotional reactions and prevent them from influencing trading decisions.
Continuous Learning: Educating oneself about psychological biases and their impact on trading can lead to more rational decision-making.
Integrating Behavioral Finance and Trader Psychology
The integration of behavioral finance and trader psychology offers a comprehensive understanding of financial decision-making. While behavioral finance provides a framework for understanding how biases and emotions affect market outcomes, trader psychology focuses on the individual trader's mental and emotional state. Together, they highlight the importance of psychological factors in financial markets and the need for strategies to mitigate their negative effects.
Conclusion
Behavioral finance and trader psychology underscore the complexity of financial markets and the significant role of human behavior in shaping market outcomes. By acknowledging and understanding the psychological factors that influence decision-making, investors and traders can develop strategies to make more informed and rational financial decisions. This holistic approach not only enhances individual performance but also contributes to the overall efficiency and stability of financial markets.
TATA STEEL Tata Steel has been facing resistance near 159 level.
It gave BO and also re-tested it. Today we can see there is good volume, there is probability of an upside move.
Keep eyes on it.
✅ If you like my analysis, please follow me here as a token of appreciation :)
in.tradingview.com/u/SatpalS/
📌 For learning and educational purposes only, not a recommendation. Please consult your financial advisor before investing.

Momentum Trading Secrets: Unlocking the Market’s Hidden Energy1. The Science of Momentum
Momentum trading is rooted in behavioral finance and market psychology. It leverages the tendency of investors to underreact or overreact to new information, creating sustained price moves. The basic scientific principle can be summarized as:
“Assets that have performed well recently are likely to continue performing well in the near future, and vice versa.”
Key aspects include:
Trend Identification: Momentum traders look for assets with strong directional movement.
Rate of Change (ROC): Calculating how fast an asset’s price is changing helps determine momentum strength.
Volume Confirmation: High trading volume validates the sustainability of a trend.
Behavioral Patterns: Fear and greed amplify trends, making momentum strategies more predictable.
2. Tools and Indicators in Momentum Trading
Momentum traders rely heavily on technical indicators to gauge the strength of a move. Some of the most effective tools include:
Relative Strength Index (RSI): Measures overbought or oversold conditions to anticipate potential trend continuations or reversals.
Moving Average Convergence Divergence (MACD): Helps identify trend direction and momentum shifts.
Stochastic Oscillator: Useful for spotting trend reversals or continuation signals in volatile markets.
Volume Weighted Average Price (VWAP): Indicates the average price weighted by volume, often used by institutional traders to confirm momentum.
Rate of Change (ROC): Measures the percentage change in price over a specific period, signaling momentum strength.
The secret lies in combining indicators rather than relying on one. For example, using RSI for trend strength and MACD for entry timing often produces higher-probability trades.
3. Secrets to Identifying True Momentum
Not all price movements represent genuine momentum. The following secrets help distinguish real trends from false signals:
Look Beyond the Noise: Small price fluctuations are often misleading. True momentum comes with consistent directional moves and high volume.
Time Frame Alignment: Momentum should be confirmed across multiple time frames. A short-term uptrend in a long-term downtrend can be risky.
Sector and Market Context: Stocks often move in sync with sectors. Identifying sector momentum can increase trade success.
Catalyst Awareness: Earnings reports, news events, and macroeconomic data often trigger strong momentum moves.
Volume Patterns: Sudden spikes in volume often precede sharp moves, indicating institutional participation.
4. Entry and Exit Strategies
Mastering momentum trading requires precise timing. Secrets in execution include:
Breakout Trading: Enter trades when price breaks key resistance or support levels with high momentum.
Pullback Entries: Waiting for minor retracements during a trend allows for safer entries at lower risk levels.
Trailing Stop Losses: Using dynamic stops that follow the trend ensures profits are locked in while letting winners run.
Scaling Positions: Incrementally increasing positions as momentum strengthens reduces risk exposure.
The critical secret: never fight the trend. Momentum trading is about riding the wave, not predicting reversals.
5. Risk Management Secrets
Momentum trading can be extremely profitable but also highly risky if not managed properly. Successful traders use:
Position Sizing: Limiting exposure to a small percentage of the trading account prevents catastrophic losses.
Stop Loss Discipline: Predefined exit points are crucial, as momentum can reverse quickly.
Diversification: Trading across multiple assets or sectors spreads risk while capturing diverse momentum opportunities.
Volatility Assessment: Understanding the volatility of the instrument ensures proper risk-reward alignment.
The secret is balancing aggressive profit potential with controlled risk, turning a volatile strategy into a sustainable one.
6. Psychological Edge in Momentum Trading
Momentum trading is as much about mindset as strategy. The key psychological secrets include:
Emotion Control: Fear and greed can destroy momentum trades. Sticking to rules and systems is vital.
Patience and Discipline: Waiting for the right setup rather than chasing price is a hallmark of successful traders.
Adaptability: Market conditions change. Momentum traders must adjust strategies to new trends, not rely on past performance.
Confidence vs. Overconfidence: Understanding the difference ensures consistent execution without reckless risk-taking.
7. Advanced Momentum Trading Techniques
Seasoned traders often leverage advanced techniques to amplify profits:
Sector Rotation Strategy: Moving capital into sectors showing strongest momentum while exiting weak sectors.
Pairs Trading with Momentum: Trading correlated assets by buying the stronger momentum asset and shorting the weaker.
Algorithmic Momentum Strategies: Using quantitative models to scan multiple instruments and automatically execute trades.
Options for Momentum Leverage: Using call and put options to magnify returns while managing capital efficiently.
These techniques reveal the “hidden secrets” of institutional-level momentum trading, making it more than just buying high and selling higher.
8. Common Mistakes to Avoid
Even experienced traders stumble when ignoring momentum trading rules. Common pitfalls include:
Chasing Trends Too Late: Entering after most of the move is over reduces profit potential.
Ignoring Volume: Low-volume momentum often reverses unexpectedly.
Over-Leveraging: Excessive leverage can wipe out accounts during sudden reversals.
Neglecting Market Context: Ignoring broader market trends can lead to false signals.
Awareness of these mistakes is a secret weapon in protecting both capital and confidence.
9. Case Studies of Momentum Trading Success
Momentum trading has produced legendary gains for traders who mastered its secrets. For instance:
Tech Stock Surges: Riding early momentum in high-growth tech companies during earnings announcements.
Commodity Moves: Capturing sharp momentum in oil or gold during geopolitical events.
Cryptocurrency Trends: Exploiting rapid price swings with disciplined momentum strategies.
These examples highlight that momentum trading is applicable across markets and time frames, provided the rules are followed.
10. The Future of Momentum Trading
With advancements in technology, momentum trading is evolving:
AI and Machine Learning: Algorithms can detect momentum patterns faster than human traders.
Social Sentiment Analysis: Platforms now measure crowd psychology and predict momentum based on social chatter.
High-Frequency Trading (HFT): Institutional traders use speed and algorithms to exploit tiny momentum shifts.
Traders who understand these trends and adapt their strategies will maintain a competitive edge in the future markets.
Conclusion
Momentum trading is an art backed by science. Its secrets lie not just in indicators or charts, but in understanding market psychology, managing risk, and executing trades with discipline. By mastering trend identification, entry and exit timing, and psychological control, traders can transform momentum strategies into consistent profit engines.
While momentum trading can seem risky, applying these secrets systematically turns volatility into opportunity. In today’s fast-moving markets, momentum trading remains one of the most powerful tools for traders willing to combine technical skill with strategic insight.
Part 4 Institutional TradingThe Structure of an Option Contract
Every option contract has certain key components:
Underlying asset – The stock, index, or commodity the option is based on.
Strike price – The agreed-upon price at which the asset can be bought or sold.
Expiration date – The last date when the option can be exercised.
Premium – The cost paid by the buyer to the seller.
Lot size – The standardized quantity of the underlying represented by one option contract.
Example:
If you buy a Nifty 20,000 Call Option at ₹200 premium, one lot size is 50.
Total cost = ₹200 × 50 = ₹10,000.
You gain if Nifty moves above 20,200 (strike + premium).

Part 2 Master Candle Stick Pattern1. Option Writing – Risks and Rewards
Option writing (selling) is when traders collect premium by selling calls or puts.
Advantage: Time decay works in your favor.
Risk: Unlimited (naked call writing is extremely risky).
Best Use: Done with hedges, spreads, or adequate margin.
2. Options vs. Futures
While both are derivatives, they differ:
Futures: Obligation to buy/sell at a future date.
Options: Right but not obligation.
Risk/Reward: Futures = unlimited risk/reward. Options = asymmetric risk/reward.
Use Case: Futures for directional moves, options for hedging or volatility plays.
3. Option Trading Psychology
Option trading is not just numbers—it’s also psychology.
Fear of missing out (FOMO) leads traders to buy expensive options in high IV.
Greed causes holding onto losing trades too long.
Discipline is key in cutting losses quickly and following position sizing rules.
4. Risk Management in Option Trading
Without proper risk management, options can blow up accounts. Key principles:
Never risk more than 1–2% of capital per trade.
Avoid naked option selling without hedge.
Use stop-loss orders or mental stop levels.
Diversify across strategies.
5. Option Trading in India – NSE Context
In India, options on Nifty 50, Bank Nifty, FinNifty, and individual stocks dominate volumes.
Weekly Expiries: Bank Nifty & Nifty weekly expiries have huge liquidity.
Retail Participation: Has grown massively due to low margin requirements.
Risks: SEBI has warned about high losses in retail options trading.
6. Real-World Applications of Options
Options are not just speculation tools—they serve critical functions:
Hedging portfolios of mutual funds, FIIs, DIIs.
Insurance companies use options to balance risks.
Commodity traders hedge against price swings.
Global corporations hedge forex exposures.
7. Conclusion – The Power and Danger of Options
Options are double-edged swords. They allow traders to:
Leverage capital effectively.
Hedge risks in uncertain markets.
Create income through systematic strategies.
But they also carry dangers:
Time decay eats away value.
Over-leveraging leads to account blow-ups.
Misjudging volatility can destroy trades.
Thus, option trading should be approached with education, discipline, and respect for risk. A beginner should start small, learn spreads, and focus on risk control rather than chasing quick profits.

How to plot Gann fan in any stock chartsA Gann Fan is a technical analysis tool developed by W.D. Gann in the early 20th century. It consists of a series of diagonal lines (called Gann angles) emanating from a significant high or low point on a price chart. These lines represent different ratios of price movement to time (e.g., 1x1 for a 45-degree angle, where price changes by 1 unit per 1 unit of time). The tool helps identify potential support and resistance levels, trend strength, and reversal points by assuming markets move in geometric and cyclical patterns.
Common angles include:
1x8 (shallow, ~82.5°)
1x4 (~75°)
1x3 (~71.25°)
1x2 (~63.75°)
1x1 (45° – the key "trendline")
2x1 (~26.25°)
3x1 (~18.75°)
4x1 (~15°)
8x1 (steep, ~7.5°)
In an uptrend, prices above the 1x1 line are bullish; below it, bearish. The fan is most effective on linear-scaled charts where time and price units are equidistant.

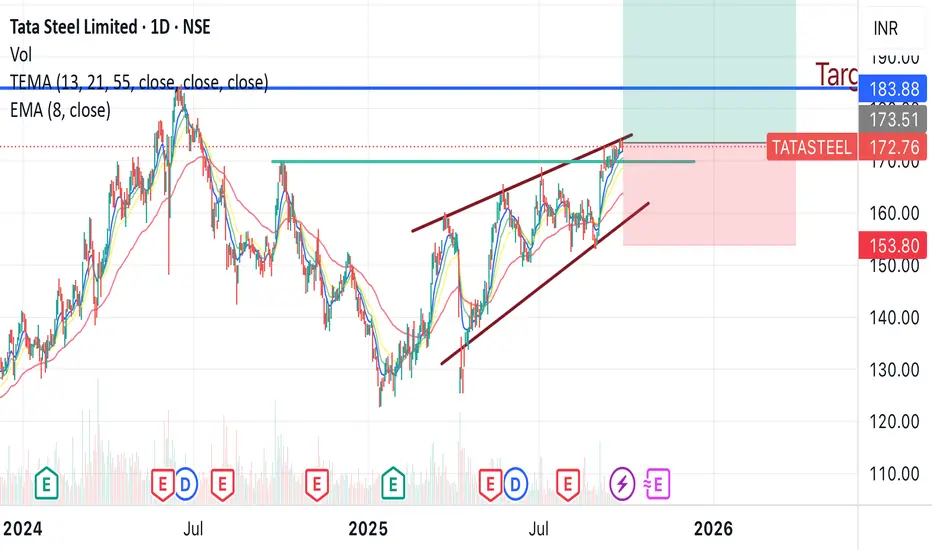
Tata Steel trend line and 1 year resistance breakout Tata steel is gonna give a breakout soon, as it has been in a continuous up trend, reaching 1 year resistance and broken it, it can give from 10-20 % profit from here in short term .
Buy around - 172- 173
Target - 207
Duration - 2-3 months
tata steel weekly charttata steel on weekly timeframe has made head and shoulder pattern, the same can be traded for target of smaller shoulder at price around 180-182 and then for head target for price around 213-215

Tata SteelTata Steel in the verge of the breakout. Can go long. If it breaks the channel on the upside. and commodity is cycle business it needs other global market support.
Wait for breakout or breakdown.
This is for educational purposes

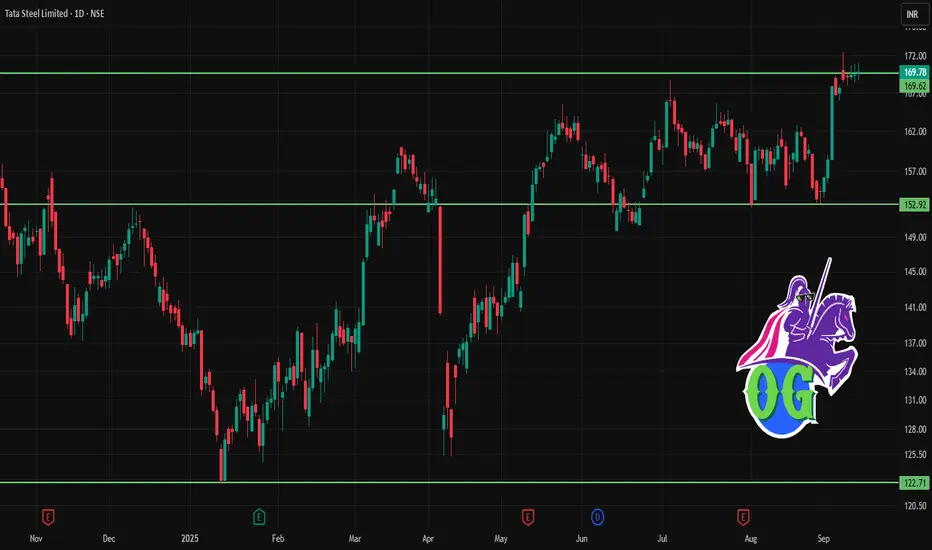
TataSteel trade ideaTataSteel (158 ) - According to chart pattern is moving to 153 where it is expected to reverse and move towards 168.

SME IPOs: The Next Frontier for Retail Investors1. Understanding SME IPOs
1.1 What is an SME?
Small and Medium Enterprises (SMEs) are companies that are smaller in scale compared to large-cap corporations. They typically have:
Lower turnover compared to large enterprises
Limited market capitalization
Focused operations, often in niche sectors
High growth potential
SMEs are generally agile, innovative, and capable of rapid growth. Unlike large corporations, they are not yet household names but often have a promising trajectory.
1.2 What is an SME IPO?
An SME IPO is the process by which a small or medium enterprise offers its shares to the public to raise capital. Unlike traditional IPOs of large companies, SME IPOs are often listed on dedicated SME platforms of stock exchanges, such as:
BSE SME Platform (Bombay Stock Exchange)
NSE Emerge (National Stock Exchange)
These platforms are specially designed to support smaller businesses with less stringent compliance requirements compared to mainboard listings.
1.3 Why SMEs Go Public
SMEs turn to public markets for several reasons:
Raising Growth Capital – Funding for expansion, R&D, marketing, or new product launches.
Brand Visibility – Being listed improves credibility and public recognition.
Liquidity for Promoters – Founders and early investors can partially exit.
Institutional Interest – Once public, SMEs can attract institutional investors and venture capital.
2. Importance of SME IPOs for Retail Investors
2.1 Early Investment in Growth Companies
One of the most compelling reasons for retail investors to consider SME IPOs is the opportunity to invest in companies at an early growth stage. Unlike large-cap companies where growth is incremental, SMEs have the potential to deliver exponential returns if they scale successfully.
2.2 Portfolio Diversification
Adding SME IPOs to an investment portfolio can provide diversification benefits. SME stocks often operate in niche sectors that are not represented by mainstream indices. For instance, an SME could be innovating in renewable energy, fintech solutions, or specialty manufacturing—areas that might be underrepresented in large-cap investments.
2.3 Higher Potential Returns
While riskier, SME IPOs can sometimes offer higher upside potential than large-cap stocks. Investors who identify high-potential SMEs before they become mainstream can benefit from significant capital appreciation.
2.4 Access to Innovative Sectors
SMEs are often at the forefront of innovation. Investing in SME IPOs allows retail investors to participate in disruptive business models and emerging technologies that might later dominate the market.
3. Regulatory Framework for SME IPOs
The Securities and Exchange Board of India (SEBI) has established specific rules to govern SME IPOs:
3.1 Eligibility Criteria
To list on SME platforms, companies must meet criteria such as:
Minimum net worth requirement
Minimum post-issue capital
Operational history (typically at least 3 years)
3.2 Disclosure Requirements
SME IPOs require simplified disclosure documents called Draft Red Herring Prospectus (DRHP) or Offer Documents. While the compliance requirements are less stringent than mainboard IPOs, companies must disclose:
Business model and operations
Financial statements
Risk factors
Future growth plans
3.3 Trading and Liquidity
SME shares are tradable on their respective SME platforms. However, liquidity may be limited compared to mainstream stocks, as the number of buyers and sellers can be smaller. Investors must understand this aspect before investing.
4. Advantages of Investing in SME IPOs
4.1 Early Growth Advantage
Investors gain the first-mover advantage by entering the company at an early stage, potentially benefiting from rapid expansion.
4.2 Diversification into Untapped Markets
SMEs often operate in untapped or niche markets, providing unique exposure not available in large-cap stocks.
4.3 Support for National Economy
Investing in SMEs supports domestic entrepreneurship and job creation, contributing to economic growth.
4.4 Tax Benefits (in some cases)
Certain SME investments may qualify for capital gains tax exemptions under specific government schemes, depending on jurisdiction.
5. Risks of Investing in SME IPOs
While SME IPOs are attractive, they carry higher risks:
5.1 Limited Track Record
SMEs may have limited operational history, making it harder to assess long-term sustainability.
5.2 Market Liquidity Risk
SME shares often have lower liquidity. Selling large quantities may be difficult without affecting the price.
5.3 Volatility
Due to smaller market capitalization and limited investor base, SME shares can be highly volatile.
5.4 Business Risk
SMEs may face challenges like financial constraints, market competition, or dependency on a few clients, which can affect performance.
6. How Retail Investors Can Approach SME IPOs
6.1 Research and Due Diligence
Investors must carefully analyze:
Company financials (revenue, profit margins, debt levels)
Industry trends and growth potential
Management experience and track record
Competitive advantages
6.2 Understanding the Valuation
Unlike large-cap IPOs, SME IPOs may not have extensive analyst coverage. Investors must evaluate whether the offered price reflects the company’s growth potential.
6.3 Assessing Liquidity and Exit Strategy
Before investing, investors should plan:
How long they intend to hold
Possible exit routes if the stock is illiquid
6.4 Diversification
Given the risk profile, SME IPOs should be part of a diversified portfolio, not the entire portfolio. Allocating a small portion to SME investments balances potential high returns with risk management.
Conclusion
SME IPOs represent a new frontier for retail investors seeking higher returns, portfolio diversification, and participation in emerging business stories. While the risks are higher compared to large-cap investments, careful research, due diligence, and strategic planning can mitigate these risks.
Retail investors willing to embrace these opportunities can:
Access high-growth companies at an early stage
Diversify into innovative and niche sectors
Support entrepreneurship and national economic growth
By balancing risk and reward, SME IPOs can become a powerful addition to a retail investor’s portfolio, offering the chance to participate in the growth stories of tomorrow.

TATASTEEL | Sell Setup | 15 Sep 2025 – 09:20 IST TATASTEEL | Sell Setup | 15 Sep 2025 – 09:20 IST
Buy Zone: 171.18 – 170.87
Sell Zone: 168.83 – 168.40
Scenario : Sell
Entry: 168.75
Stop Loss: 171.05
Targets:
TP1 → 157.50
TP2 → 153.05
Analysis:
From Sell Zone (168.83 – 168.40) creates possibilities for a sell move.
Stay alert on updates here.
⚠️ Disclaimer: This idea is shared for educational purposes only and should not be considered financial advice. Please do your own analysis before making trading decisions.

TATASTEEL 1D Time frameCurrent Price & Trend
Current Level: ₹169
Trend: Neutral to slightly bullish → stock is consolidating near support.
Momentum: Price is holding above strong support, but resistance is close.
RSI: Around 55 → neutral, leaning positive.
MACD: Flat to mildly bullish.
Moving Averages: Price is hovering around 20-day average; still above 50-day average → medium-term strength intact.
Sub Brokers in India1. Introduction
The Indian stock market has witnessed remarkable growth in the last two decades, driven by rising investor participation, technological advancements, regulatory reforms, and growing awareness of financial instruments. With millions of new investors opening demat accounts every year, the need for intermediaries who can help bridge the gap between stock exchanges, brokers, and retail clients has become stronger.
While full-service brokers and discount brokers have taken center stage, another critical segment—sub brokers—continues to play a vital role in expanding the reach of capital markets, particularly in semi-urban and rural areas. Sub brokers serve as connectors between brokers and investors, making financial markets more inclusive and accessible.
This essay provides a comprehensive description of sub brokers in India trading, exploring their role, responsibilities, evolution, regulatory framework, benefits, challenges, and future prospects.
2. Who is a Sub Broker?
Definition
A sub broker is an intermediary who is not a direct trading member of stock exchanges like NSE (National Stock Exchange) or BSE (Bombay Stock Exchange) but acts on behalf of a registered stockbroker to assist investors in trading and investing activities.
They essentially work as franchise partners or authorized representatives of larger brokers, helping clients open demat accounts, execute trades, and access investment products.
Key Features
They are agents of main brokers but deal directly with clients.
They help with trading in equities, derivatives, commodities, mutual funds, IPOs, and other products.
They earn a commission on the brokerage generated by their clients.
Sub brokers are particularly active in tier-2 and tier-3 cities, expanding the market penetration of stockbrokers.
3. Evolution of Sub Brokers in India
The sub-broker concept has evolved significantly over time:
1990s – Early Expansion
With economic liberalization, stock market participation began to rise.
Sub brokers emerged as local representatives for brokers, connecting investors to exchanges.
2000s – Rapid Growth
Technological platforms (like ODIN) allowed sub brokers to service clients better.
Franchisee models gained traction, with brokers like Sharekhan, Angel Broking, and India Infoline expanding aggressively through sub brokers.
2010s – SEBI Regulations Tighten
SEBI increased oversight to curb malpractices.
Online brokers emerged, reducing dependency on physical sub brokers.
2020s – Digital Era & Decline in Traditional Sub Brokers
Discount brokers like Zerodha, Upstox, and Groww disrupted the industry with low brokerage and direct online platforms.
Many sub brokers shifted to becoming Authorized Persons (APs) under SEBI regulations.
4. Regulatory Framework
Sub brokers in India are governed by SEBI (Securities and Exchange Board of India) and stock exchanges like NSE, BSE, and MCX.
Key Regulations
Registration Requirement
Sub brokers had to register with SEBI earlier.
Post-2018, SEBI discontinued fresh sub broker registrations, and all were migrated to the Authorized Person (AP) model.
Authorized Person (AP) Model
Sub brokers now operate as APs under a stockbroker’s license.
APs need approval from the stock exchanges (not SEBI directly).
Eligibility Criteria
Minimum age: 18 years.
Must be a citizen of India.
Educational qualification: Preferably 12th pass.
Clean financial background (no defaults or fraud cases).
Compliance & Code of Conduct
Sub brokers must follow KYC (Know Your Customer) norms.
They cannot misrepresent investment opportunities.
They must act in clients’ best interests.
5. Roles and Responsibilities of Sub Brokers
Sub brokers perform multiple critical roles in India’s trading ecosystem:
1. Client Acquisition
Introduce new clients to the stock market.
Build trust and long-term relationships with investors.
2. Account Opening Support
Assist clients in opening demat and trading accounts.
Help with documentation, KYC compliance, and onboarding.
3. Trade Execution
Place buy and sell orders on behalf of clients through the broker’s platform.
Guide clients about different market segments (equity, derivatives, commodities).
4. Advisory Services
Provide insights on stocks, IPOs, and mutual funds.
Educate investors about risks and opportunities.
Although they are not registered advisors, many sub brokers act as informal guides.
5. Local Market Expansion
Brokers leverage sub brokers to penetrate smaller towns.
Sub brokers act as brand ambassadors for the broker in their region.
6. Customer Support
Resolve client issues regarding trading platforms, fund transfers, and settlements.
Offer personalized service that online-only brokers often lack.
6. Business Model of Sub Brokers
The sub-broker model is essentially a revenue-sharing partnership between the stockbroker and the sub broker.
Revenue Generation
Sub brokers earn commissions on brokerage fees charged to clients.
Typical sharing ratio: 60:40 or 70:30, where sub brokers keep 60–70% of the brokerage revenue.
Cost Structure
Initial franchise fees to the broker (₹50,000 – ₹3,00,000 depending on brand).
Infrastructure setup (office, computers, internet, staff).
Ongoing operational costs.
Example
If a client generates brokerage of ₹10,000 in a month:
Sub broker share (70%) = ₹7,000
Broker share (30%) = ₹3,000
7. Advantages of Being a Sub Broker
Low Entry Barrier – Compared to becoming a full-fledged broker, the cost and compliance burden is lower.
Established Brand Support – Sub brokers leverage the brand, technology, and research of large brokers.
High Earning Potential – With a good client base, sub brokers can earn substantial monthly income.
Flexibility – Can operate in chosen geographical regions.
Growing Market – Rising financial literacy ensures continued demand for intermediaries.
8. Challenges Faced by Sub Brokers
Competition from Discount Brokers
Low-cost platforms like Zerodha and Groww reduce reliance on intermediaries.
Regulatory Shifts
Migration from sub broker to AP model created uncertainty.
Technology Upgradation
Need to continuously invest in digital platforms and stay updated.
Client Expectations
Investors expect real-time service and accurate advice.
Misguiding clients can lead to loss of reputation.
Margin Pressure
With declining brokerage rates, earning potential is squeezed.
Famous Brokers and Sub Broker Networks in India
Some leading brokerage houses with large sub broker/authorized person networks include:
Angel One (Angel Broking) – One of the largest franchise networks.
Sharekhan – Known for its strong sub broker model.
ICICI Direct – Leverages bank branches and APs.
Motilal Oswal – Strong research-backed franchise business.
IIFL Securities – Popular in tier-2 and tier-3 towns.
Conclusion
Sub brokers in India have been the backbone of stock market penetration for decades. From being local representatives of big brokers in the 1990s to evolving as Authorized Persons in today’s digital era, they continue to play a vital role in democratizing market access.
While competition from discount brokers and regulatory changes have reshaped their landscape, sub brokers who embrace technology, diversify into multiple financial products, and focus on personalized advisory will thrive in the future.
The Indian capital market is still in its growth phase, and sub brokers will remain a bridge between financial institutions and retail investors, particularly in untapped regions.
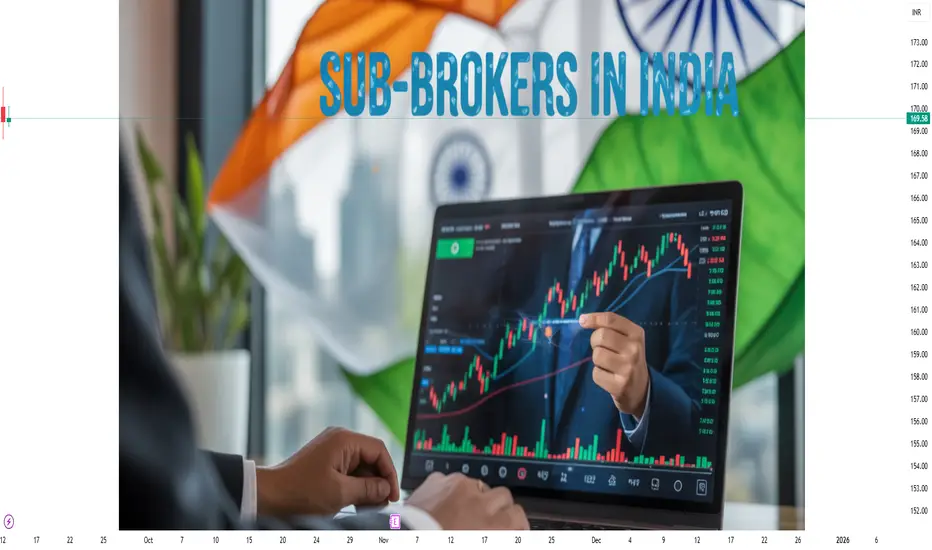
TATASTEEL 4H 📊 Current Snapshot
Current Price: ₹169.43
Day’s Range: ₹168.46 – ₹170.90
Previous Close: ₹169.43
Opening Price (4H): ₹169.35
📈 Trend & Indicators
Trend: Neutral to mildly bullish; trading near 50-hour and 200-hour moving averages.
RSI (14): Neutral zone.
MACD: Positive → indicating mild bullish momentum.
Moving Averages: Short-term averages indicate neutral to slightly bullish outlook.
🔮 Outlook
Bullish Scenario: Break above ₹170.90 with strong volume could target ₹172.50.
Bearish Scenario: Drop below ₹168.50 may lead to further decline toward ₹167.99.
Neutral Scenario: Consolidation between ₹168.50 – ₹170.90; breakout needed for directional move.
📌 Key Factors to Watch
Economic Indicators: Interest rates, inflation, and RBI policy updates.
Sector Performance: Trends in the metals and mining sectors.
Global Cues: Global market trends, US indices, crude oil, and currency movements.
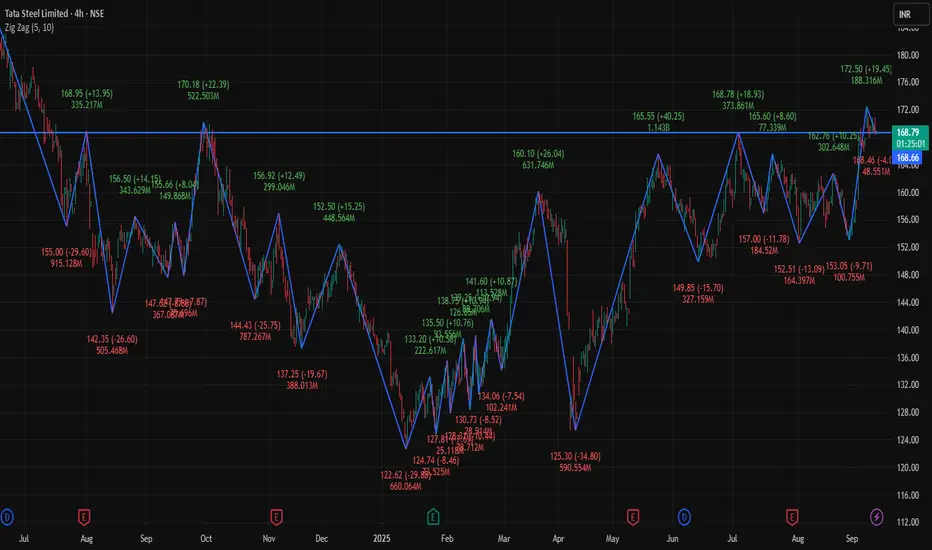
Small Account Challenge1. Introduction to the Small Account Challenge
The world of trading often fascinates people because of the possibility of turning small sums of money into significant wealth. But in reality, most aspiring traders don’t begin with huge capital. They usually start with a small account—sometimes $100, $500, or $1,000. That’s where the concept of the Small Account Challenge comes in.
The Small Account Challenge is a structured attempt to grow a limited trading account into something much larger by following disciplined strategies, strict risk management, and consistency. It’s not just about making money—it’s about proving that with knowledge and discipline, even small amounts of capital can generate meaningful results.
The challenge is extremely popular on platforms like YouTube, Twitter (X), and Instagram, where traders showcase their journey from “$500 to $5,000” or “$1,000 to $10,000.” While some of these are genuine and inspiring, others are exaggerated or misleading. The reality lies somewhere in the middle: growing a small account is possible, but it requires patience, risk control, and realistic expectations.
For beginners, the small account challenge is appealing because:
It lowers the financial barrier to entry.
It provides a structured learning curve.
It forces traders to master risk management.
It builds trading discipline early on.
In short, the challenge is about mindset and strategy as much as it is about profit.
2. The Psychology Behind the Challenge
When trading with a small account, psychology plays a massive role. Unlike institutional traders with deep pockets, small-account traders face unique pressures.
2.1 The Motivation
Many traders start the challenge because they want financial independence, to prove their skill, or simply to test their strategies without risking too much. The thrill of seeing a $500 account grow to $1,000 is powerful motivation.
2.2 Emotional Control
The smaller the account, the higher the temptation to “double up” quickly. Unfortunately, that often leads to over-leverage and account blow-ups. To succeed, traders need to control emotions like greed, fear, and revenge trading.
2.3 Patience & Discipline
The hardest part of growing a small account isn’t making money—it’s sticking to small, consistent gains. Many traders expect 100% returns overnight, but the reality is more like 2–5% gains per week (still huge compared to banks).
A disciplined trader understands:
Consistency beats luck.
Risk management is survival.
Patience compounds growth.
3. Risk Management for Small Accounts
This is the foundation of the Small Account Challenge. Without proper risk management, no strategy will work long-term.
3.1 Position Sizing
With a small account, risking too much on one trade can wipe you out. The rule of thumb is risk only 1–2% of the account per trade.
For example, in a $500 account:
Risk per trade = $5–$10.
If stop-loss is $0.50 per share, you can only trade 10–20 shares.
3.2 Stop-Loss Discipline
Small accounts can’t afford deep losses. A strict stop-loss ensures that even a string of losing trades doesn’t kill the account.
3.3 Surviving Losing Streaks
Even the best traders face losing streaks. Risk management ensures survival during bad phases so you can capitalize during good ones.
A trader with a $500 account risking $50 per trade may survive only 10 bad trades. A trader risking $5 can survive 100 trades. Survival is everything.
4. Strategies for Small Account Challenges
Different traders use different approaches. Let’s explore the most common ones:
4.1 Scalping & Day Trading
Definition: Quick trades aiming for small profits.
Why it works: Small accounts benefit from fast turnover. A few cents of movement can yield decent percentage returns.
Risk: Requires speed, discipline, and often leverage.
4.2 Swing Trading
Definition: Holding trades for days or weeks.
Why it works: Less stressful than scalping, suitable for those with jobs.
Risk: Requires patience and larger stop-losses.
4.3 Options Trading
Definition: Trading contracts based on stock price movement.
Why it works: Provides leverage, allowing small accounts to control large positions.
Risk: Options can expire worthless quickly. Requires advanced knowledge.
4.4 Futures and Forex
Definition: Trading global currencies or commodity futures.
Why it works: High leverage, 24-hour markets, low capital required.
Risk: Leverage cuts both ways; easy to blow up accounts.
4.5 Copy-Trading / Social Trading
Definition: Copying professional traders’ trades via platforms.
Why it works: Beginners learn while following experienced traders.
Risk: Success depends on who you follow.
5. Compounding & Growth
The magic of the small account challenge lies in compounding.
5.1 The Power of Reinvestment
Instead of withdrawing profits, traders reinvest them. Even small percentage gains grow exponentially.
Example:
Start: $500
Gain 5% weekly → $25 first week
After 52 weeks → Over $6,000 (if compounded).
5.2 Realistic Expectations
Social media may glamorize turning $500 into $100,000 in months, but that’s rare. A disciplined trader focuses on sustainable growth, like doubling or tripling the account in a year.
6. Tools & Platforms for Small Accounts
6.1 Brokers
Robinhood, Webull, Zerodha, Upstox → popular for commission-free trades.
Interactive Brokers → advanced tools, good for scaling later.
6.2 Journaling Tools
Keeping a trading journal is crucial. Tools like TraderSync or Edgewonk help track win rates, risk-reward ratios, and mistakes.
6.3 Charting Platforms
TradingView → easy charts and social features.
Thinkorswim → great for U.S. traders.
MetaTrader 4/5 → standard for forex.
Conclusion
The Small Account Challenge isn’t just about money—it’s about discipline, patience, and skill-building. While social media may glorify turning $100 into $100,000 overnight, the real value of the challenge lies in learning how to manage risk, control emotions, and grow steadily.
A trader who can manage a $500 account with discipline can later manage $50,000 or even $500,000. The challenge is like training for a marathon—you build endurance, habits, and consistency that last for a lifetime.
In the end, success in the Small Account Challenge is less about how much money you make and more about the trader you become through the journey.
Part 1 Ride The Big Moves Introduction to Option Trading
Option trading is a segment of the financial market that allows investors to buy and sell options—financial contracts that grant the right, but not the obligation, to buy or sell an underlying asset at a predetermined price before or on a specified date. Unlike stocks or commodities where ownership is transferred, options are derivatives, meaning their value derives from an underlying asset such as equities, indices, commodities, or currencies.
Options are widely used for hedging, speculation, and income generation. Traders use options to manage risk, enhance returns, and capitalize on market volatility. Global financial markets, including India’s NSE and BSE, have witnessed exponential growth in options trading due to their flexibility and strategic possibilities.
Types of Options
Options are primarily classified into two types: Call Options and Put Options.
Call Options
A call option gives the buyer the right to purchase the underlying asset at a specified price, called the strike price, before or on the option's expiration date. Investors buy calls if they anticipate the price of the underlying asset will rise.
Example: Suppose a stock is trading at ₹100, and an investor buys a call option with a strike price of ₹110. If the stock rises to ₹120, the investor can exercise the option, buy at ₹110, and sell at ₹120, gaining ₹10 minus the premium paid.
Put Options
A put option gives the buyer the right to sell the underlying asset at a specified strike price within a certain timeframe. Investors buy puts if they expect the price of the underlying asset to fall.
Example: A stock trades at ₹150. An investor buys a put option with a strike price of ₹140. If the stock drops to ₹130, the investor can sell it at ₹140, securing a ₹10 profit minus the premium.
