Tata steal short (short term)it looks short term short position Resistance would be 172. sl will be 174 if continues down 160 to 150
Trade ideas

Part 1 Support and ResistanceThe Role of Options in Financial Markets
Options exist because they provide flexibility and risk management tools. Their role includes:
Hedging: Protecting portfolios from adverse price movements (insurance against loss).
Speculation: Betting on price direction with limited capital.
Leverage: Controlling large positions with small investment.
Income Generation: Selling options to earn premium income.
Arbitrage: Exploiting price differences between markets or instruments.
Why Traders Use Options
Options serve different purposes:
Investors: Hedge portfolios (e.g., protective puts).
Traders: Speculate on price moves (buying calls/puts).
Institutions: Manage risk exposure across assets.
Market Makers: Provide liquidity and earn spreads.
Psychology of an Options Trader
Trading is not just numbers, it’s emotions.
Fear and greed drive bad decisions.
Over-leverage leads to blowing up accounts.
Patience and discipline are more important than intelligence.
A successful trader has a trading plan, risk management, and psychological control.

Basics of Financial Markets1. What are Financial Markets?
A financial market is a marketplace where financial instruments are created, bought, and sold. Unlike physical markets where goods are exchanged, financial markets deal with monetary assets, securities, and derivatives.
Key Characteristics:
Medium of Exchange – Instead of physical goods, money, credit, or securities are exchanged.
Standardized Instruments – Financial contracts such as stocks or bonds are standardized and legally binding.
Liquidity – Markets allow participants to buy or sell instruments quickly without drastically affecting prices.
Transparency – Prices and information are accessible, which reduces uncertainty.
Regulation – Most markets are regulated to ensure fairness, prevent fraud, and protect investors.
2. Why Do Financial Markets Exist?
The need for financial markets arises because of the following:
Capital Allocation – They help direct savings to businesses and governments that need funds.
Price Discovery – Markets determine the fair value of financial instruments through supply and demand.
Liquidity Provision – Investors can easily enter or exit positions.
Risk Management – Derivative markets allow participants to hedge against risks like currency fluctuations, interest rates, or commodity prices.
Efficient Resource Use – They reduce transaction costs and make capital flow more efficient across the economy.
3. Types of Financial Markets
Financial markets are broadly classified into several categories:
(a) Capital Market
Capital markets deal with long-term securities such as stocks and bonds. They are subdivided into:
Primary Market – Where new securities are issued (e.g., IPOs).
Secondary Market – Where existing securities are traded among investors (e.g., stock exchanges).
(b) Money Market
This is the market for short-term funds, usually less than one year. Instruments include:
Treasury bills
Commercial paper
Certificates of deposit
Repurchase agreements
Money markets are crucial for liquidity management by banks, companies, and governments.
(c) Foreign Exchange Market (Forex)
The largest and most liquid market in the world, where currencies are traded. Daily turnover exceeds $7 trillion globally. Forex enables:
International trade settlement
Speculation
Hedging currency risks
(d) Derivatives Market
These markets trade instruments that derive their value from underlying assets like stocks, bonds, commodities, or indices. Key instruments include:
Futures
Options
Swaps
Forwards
(e) Commodity Market
These markets allow the trade of raw materials such as oil, gold, silver, coffee, wheat, and natural gas. They play a vital role in price discovery and hedging for producers and consumers.
(f) Insurance and Pension Markets
Though sometimes overlooked, insurance and pension funds form part of financial markets as they pool resources and invest in capital markets to provide long-term returns.
4. Major Participants in Financial Markets
(a) Individual Investors
Ordinary people investing in stocks, bonds, mutual funds, or retirement accounts.
(b) Institutional Investors
Pension funds
Hedge funds
Insurance companies
Mutual funds
They often have large capital and dominate trading volumes.
(c) Corporations
Issue stocks and bonds to raise capital for growth and expansion.
(d) Governments
Issue treasury securities to finance deficits and manage national debt.
(e) Central Banks
Influence interest rates, liquidity, and currency stability. For example, the Federal Reserve (US) or RBI (India).
(f) Brokers and Dealers
Middlemen who facilitate transactions.
(g) Regulators
Organizations like SEBI (India), SEC (US), or FCA (UK) ensure fair practices, transparency, and investor protection.
5. Financial Instruments
Financial instruments are contracts that represent monetary value. Broadly divided into:
(a) Equity Instruments
Shares or stocks represent ownership in a company.
Provide dividends and capital appreciation.
(b) Debt Instruments
Bonds, debentures, or loans represent borrowing.
Fixed income with lower risk compared to equities.
(c) Hybrid Instruments
Convertible bonds
Preference shares (mix of equity and debt features)
(d) Derivatives
Contracts like futures and options used for speculation or hedging.
(e) Foreign Exchange Instruments
Spot transactions, forwards, swaps.
6. Functions of Financial Markets
Mobilization of Savings – Channels savings into investments.
Efficient Allocation of Resources – Ensures capital flows where it is most productive.
Liquidity Creation – Enables quick conversion of assets to cash.
Price Discovery – Determines fair asset prices.
Risk Management – Through diversification and hedging.
Economic Growth Support – Facilitates industrial expansion and infrastructure building.
7. Primary vs. Secondary Market
Primary Market
New securities are issued.
Example: An IPO of a company.
Investors buy directly from the issuer.
Secondary Market
Existing securities are traded among investors.
Example: Buying shares of TCS on NSE.
Prices are driven by demand and supply.
Both markets are essential – the primary market raises fresh funds, while the secondary market ensures liquidity.
8. Global Financial Markets
Financial markets today are interconnected. Events in one region impact others through global capital flows.
US markets (NYSE, NASDAQ) dominate equity trading.
London is a hub for forex trading.
Asia (Tokyo, Shanghai, Hong Kong, Singapore, Mumbai) is rising as a global financial powerhouse.
Globalization and technology have made markets operate 24/7, with information spreading instantly.
9. Role of Technology in Financial Markets
Technology has revolutionized finance:
Online trading platforms allow individuals to trade from anywhere.
Algo & High-Frequency Trading execute orders in microseconds.
Blockchain & Cryptocurrencies (Bitcoin, Ethereum) are creating new asset classes.
Fintech Innovations like robo-advisors, digital wallets, and payment banks are reshaping finance.
10. Risks in Financial Markets
Despite benefits, markets involve risks:
Market Risk – Loss due to price movements.
Credit Risk – Default by borrowers.
Liquidity Risk – Inability to sell assets quickly.
Operational Risk – Failures in processes, systems, or fraud.
Systemic Risk – Collapse of one institution affecting the entire system (e.g., 2008 crisis).
Conclusion
Financial markets are complex yet fascinating ecosystems that drive global economic growth. They connect savers with borrowers, facilitate price discovery, provide liquidity, and enable risk management. For individuals, they offer opportunities to grow wealth, while for nations, they are vital for development and stability.
Understanding the basics of financial markets is not just about investing—it’s about grasping how economies function in a globalized, interconnected world. With technological advancements and evolving regulations, financial markets will continue to transform, creating both opportunities and challenges for future generations.

Part 7 Trading Masterclass With ExpertsMistakes Beginners Make
Ignoring Time Decay: Many beginners buy out-of-the-money options and lose money as they expire worthless.
Over-Leverage: Betting too much on one trade.
Lack of Exit Plan: Holding options till expiry without managing risk.
Not Understanding Greeks: Greeks (Delta, Theta, Vega, Gamma) explain option movements.
Following Tips Blindly: Always research, don’t rely on random market tips.
The Greeks – A Beginner’s View
Delta: Measures sensitivity of option price to stock price changes.
Theta: Measures time decay.
Vega: Measures sensitivity to volatility.
Gamma: Measures change in delta.
While beginners don’t need to master Greeks immediately, having a basic awareness helps in making smarter trades.
Roadmap to Becoming a Skilled Options Trader
Start with Education: Learn basics before trading.
Paper Trade: Practice without real money.
Begin Small: Trade with limited capital.
Focus on Risk Management: Never risk more than 1–2% of your capital per trade.
Keep a Trading Journal: Record every trade, analyze mistakes.
Gradually Explore Strategies: Start with buying calls/puts, then move to spreads, covered calls, and advanced strategies.
Stay Updated: Market news, volatility, and earnings impact options heavily.

Options Trading Growth in India1. Introduction
Options trading has emerged as one of the fastest-growing segments of the Indian financial markets. A decade ago, derivatives trading in India was primarily the playground of institutional investors, foreign funds, and sophisticated traders. But today, options have become the preferred instrument for millions of retail participants across the country.
India is now one of the largest derivatives markets in the world, surpassing even developed markets like the US in terms of contract volumes. According to NSE data, over 90% of derivatives volume in India comes from options contracts, with index options (mainly Nifty and Bank Nifty) leading the charge.
This rapid expansion is not a coincidence—it is the result of a combination of technological advancements, regulatory support, low-cost brokerage models, and rising financial awareness among Indians. At the same time, it reflects the desire of retail investors to participate in markets with limited capital while accessing leverage and flexible strategies.
In this essay, we will explore how options trading has grown in India, its history, the role of regulations, retail and institutional participation, strategies, risks, and the road ahead.
2. History of Options Trading in India
The origins of derivatives in India can be traced back to the early 2000s, when the National Stock Exchange (NSE) and Bombay Stock Exchange (BSE) introduced futures and options.
2000 – Index futures were introduced on NSE, marking the beginning of derivatives trading in India.
2001 – Index options were launched, allowing traders to hedge or speculate on market movements without owning the underlying stock.
2002 – Stock options and stock futures were introduced, expanding the scope of trading instruments.
2008 Global Financial Crisis – Derivatives were criticized globally for excessive speculation, but in India, strict regulations by SEBI kept the market relatively safe.
2010s – Gradual increase in participation as brokers, financial media, and online platforms educated traders about F&O products.
2020 onwards – Explosion of retail participation post-COVID, thanks to low-cost digital brokers, easy app-based trading, and heightened market volatility.
From being a niche segment for professionals, options have now become the backbone of Indian trading activity.
3. Regulatory Framework & SEBI’s Role
The Securities and Exchange Board of India (SEBI) has played a critical role in shaping the options market. Its regulations ensure transparency, standardization, and risk management.
Key measures include:
Standardization of contracts – Expiry dates, strike intervals, and lot sizes are standardized for better liquidity.
Introduction of weekly options – NSE launched Bank Nifty weekly options in 2016, later followed by Nifty, FinNifty, and even stock-specific weeklies. This increased retail participation dramatically.
Margin rules – SEBI revised margin frameworks to reduce excessive leverage. While controversial, it brought discipline to the system.
Physical settlement of stock options – From 2018, stock options are physically settled, meaning if exercised, delivery of shares is mandatory. This reduced manipulation risks.
Investor education – SEBI and exchanges have run multiple campaigns on the risks of options trading, as many retail traders see it as a shortcut to wealth.
Overall, SEBI’s balanced approach of encouraging innovation while maintaining risk controls has allowed India’s options market to expand sustainably.
4. Market Growth & Key Milestones
India’s derivatives market has grown exponentially in the last decade, especially after 2020.
In 2010, F&O volumes were modest, with futures contributing more.
By 2015, options overtook futures as the preferred instrument.
In 2022, NSE became the world’s largest derivatives exchange by volume, largely driven by index options.
In 2023–24, over 70% of daily trading volume in NSE came from weekly options alone, reflecting retail traders’ preference for short-term bets.
Some key trends:
Index Options Domination: Nifty and Bank Nifty options dominate 80–85% of the market.
Weekly Expiry Craze: Traders love Thursday (weekly expiry day), where liquidity and volatility peak.
Rise of FinNifty: Introduced to give exposure to financial services stocks, FinNifty has gained traction.
Retail as Majority Players: Nearly 70% of options trading volume now comes from retail investors.
This meteoric growth highlights both the opportunities and risks of India’s options ecosystem.
5. Rise of Retail Participation
One of the biggest drivers of options growth in India has been retail participation.
Why retail traders love options:
Low Capital Requirement – Options allow traders to take positions with limited investment compared to futures or cash markets.
Leverage – Even with SEBI’s margin rules, options provide natural leverage.
High Returns Potential – A small move in Bank Nifty or Nifty can generate massive percentage gains in options.
Weekly Expiry Excitement – Short-term trading opportunities keep traders engaged.
Simplified App-based Platforms – Discount brokers like Zerodha, Upstox, Groww, and Angel One made it easy for first-time traders.
COVID-19 Lockdowns Effect – Work-from-home and digital adoption led millions of Indians to start trading.
By 2024, India had over 3 crore active derivatives traders, most of them in options. This number continues to grow rapidly as financial literacy spreads.
6. Technological Advancements & Algo Trading
Technology has fueled the options boom in India.
Discount Brokers – Platforms like Zerodha pioneered low-cost brokerage, making options affordable for small traders.
Mobile Apps – User-friendly interfaces attracted a younger generation of traders.
Algo Trading & APIs – Many advanced traders now use algorithmic trading, creating strategies that run automatically.
Data Analytics & Social Media – Traders access option chain analysis, Greeks, and strategies easily through apps, Telegram groups, and YouTube channels.
Digital Payments – Seamless UPI and net-banking integration made instant fund transfers possible, boosting intraday trading.
This democratization of tools means that what was once available only to professionals is now in the hands of retail traders.
7. Institutional Participation in Options
While retail dominates volumes, institutional investors also play a significant role:
Foreign Institutional Investors (FIIs) use options for hedging their large equity portfolios.
Mutual Funds & Insurance Companies cautiously use index options for portfolio protection.
Proprietary Trading Firms (Prop Desks) are major liquidity providers, especially in weekly options.
Hedge Funds (though limited in India) deploy complex strategies like spreads, straddles, and arbitrage.
Institutions add depth and liquidity, but their style is usually hedging rather than outright speculation, unlike retail traders.
8. Popular Options Strategies in India
Retail traders often focus on naked call/put buying or selling, but over time, many strategies have gained traction:
Buying Calls/Puts – Speculative bets on direction.
Selling Options (Writers) – Collecting premium through short straddle/strangle.
Bull Call/Bear Put Spreads – Limited-risk directional strategies.
Iron Condor & Butterfly Spreads – Popular among advanced traders on expiry days.
Hedging with Protective Puts – Used by investors to safeguard equity holdings.
Weekly expiries, especially in Bank Nifty, have become a hotspot for option sellers who capitalize on time decay (theta).
9. Impact of Margin & SEBI Rule Changes
SEBI’s new margin framework (2020–21) changed the dynamics of options trading.
Earlier, traders enjoyed high leverage, sometimes 20x–40x intraday.
New rules capped leverage and required brokers to collect upfront margins.
While this upset retail traders initially, it reduced systemic risk and brought discipline.
Still, options remain attractive due to their built-in leverage.
This regulatory shift also led to a rise in option selling strategies since traders now needed more capital and aimed for steady income rather than high-risk speculation.
10. Risks & Challenges in Indian Options Market
While growth is impressive, there are concerns:
Retail Losses – SEBI reports suggest that nearly 9 out of 10 retail F&O traders lose money.
Over-leverage & Gambling Mindset – Many treat options like lottery tickets, ignoring risk management.
Algo Manipulation – Increasing algorithmic activity raises concerns of unfair advantages.
Liquidity in Stock Options – While index options are liquid, many stock options suffer from wide spreads and low participation.
Psychological Pressure – Fast movements in options often lead to panic trading.
Unless traders approach options with proper knowledge and risk management, losses can mount quickly.
Conclusion
Options trading in India has evolved from a niche product in the early 2000s to the largest and most dynamic segment of the market today. Retail investors have been the driving force, supported by technology, regulatory reforms, and innovative market products like weekly expiries.
However, with great opportunity comes great risk. While options offer flexibility, leverage, and high returns potential, they also carry the danger of rapid losses, especially for inexperienced traders.
For India, the challenge ahead is balancing growth with investor protection. As financial literacy improves and technology empowers traders, options will continue to thrive as both a speculative tool and a risk-management instrument.
In the years to come, options trading will not just remain a growth story—it will become the very heartbeat of India’s financial markets.
Part 2 Ride The Big MovesBasic Terminology
Before we dive deeper, let’s clear the basic terms in option trading:
Underlying Asset – The stock, index, commodity, or currency on which the option is based. Example: Nifty, Reliance, crude oil.
Option Contract – The agreement between buyer and seller of the option.
Call Option – Gives the holder the right (but not obligation) to buy the underlying asset at a fixed price before expiry.
Put Option – Gives the holder the right (but not obligation) to sell the underlying asset at a fixed price before expiry.
Strike Price – The price at which the option holder can buy (call) or sell (put) the underlying.
Expiry Date – The last date when the option can be exercised. In India, stock options usually expire monthly or weekly (for indices).
Premium – The price you pay to buy an option contract. It’s like a ticket fee for having the right to buy or sell in the future.
Lot Size – Each option contract is traded in fixed quantities called lots. Example: Nifty option lot = 50 units.
How Options Work
Imagine you want to buy a house worth ₹50 lakhs, but you’re unsure whether the price will rise or fall in the next 6 months. Instead of paying ₹50 lakhs now, you strike a deal with the owner:
You pay ₹2 lakhs today as a non-refundable fee (premium).
You get the right to buy the house anytime in the next 6 months at ₹50 lakhs (strike price).
Now:
If the house price rises to ₹60 lakhs, you can still buy it at ₹50 lakhs and make a profit.
If the house price falls to ₹45 lakhs, you can walk away. You lose only the ₹2 lakhs premium.
This is exactly how a call option works.
A put option is the reverse: you get the right to sell something at a fixed price, useful if you think prices will fall.
So options are all about rights, not obligations. The buyer has rights, the seller has obligations.

Risk Smart, Grow Fast in TradingIntroduction
Trading has always been seen as a path to quick money, fast success, and even financial freedom. But the truth is that trading is not a get-rich-quick game. For every successful trader who grows fast, there are hundreds who lose money because they ignore the most important foundation of trading: risk management.
“Risk Smart, Grow Fast” is not just a catchy phrase. It’s a principle, a mindset, and a strategy. It means that if you manage your risks wisely, protect your capital, and make decisions with discipline, you can grow faster and more sustainably than if you blindly chase high returns. In fact, smart risk management is the engine that powers growth in trading.
This essay explores the philosophy, strategies, tools, and psychology behind trading with a “Risk Smart, Grow Fast” approach.
Part 1: Why Risk Management Is More Important Than Profit
Most new traders focus on one question: “How much can I make?” The right question, however, is: “How much can I lose if I’m wrong?”
In trading, risk always comes before reward. Here’s why:
Capital Preservation – Without capital, there’s no trading. Losing 50% of your account requires a 100% gain to break even. Protecting your downside ensures you stay in the game.
Compounding Effect – Smaller drawdowns allow compounding to work more efficiently. Even modest profits can grow exponentially when losses are controlled.
Emotional Stability – Large losses trigger fear, stress, and revenge trading. Smart risk control keeps emotions in check, enabling rational decision-making.
Sustainable Growth – Fast growth through reckless risk-taking often ends in collapse. True fast growth comes from controlled risk that compounds over time.
Key Idea: You cannot grow fast unless you manage risk smartly.
Part 2: What Does “Risk Smart” Really Mean?
Being risk smart doesn’t mean avoiding risk altogether. Trading is risk by nature; without risk, there is no reward. Instead, it means taking calculated risks that are aligned with your trading strategy, capital, and goals.
Core principles of being Risk Smart:
Position Sizing – Risking only a small percentage of your capital on each trade (usually 1–2%).
Stop Loss Discipline – Always knowing where you will exit if the trade goes wrong.
Diversification – Not putting all capital into one stock, sector, or instrument.
Risk/Reward Ratio – Ensuring potential reward is at least 2–3 times the risk.
Capital Allocation – Spreading money between short-term trades, long-term investments, and safe reserves.
Think of being risk smart like wearing a seatbelt while driving fast. You may enjoy the thrill of speed, but the seatbelt ensures survival if things go wrong.
Part 3: The Growth Mindset in Trading
While being risk smart focuses on protection, “grow fast” focuses on maximizing opportunities. Growth in trading is not just about profits, but also about knowledge, experience, and adaptability.
Components of the Growth Mindset:
Learning from Losses – Every loss is tuition. Smart traders don’t fear losses; they analyze them to refine strategies.
Adapting to Market Conditions – Markets change; strategies must evolve. What works in a trending market may fail in a choppy one.
Scaling Up Gradually – Growing fast doesn’t mean doubling your risk overnight. It means compounding small consistent gains until you can trade larger with confidence.
Leveraging Technology – Using charting tools, algo trading, backtesting, and data analytics to grow faster than traditional traders.
Mind and Body Discipline – Growth requires sharp focus, emotional control, and physical health. Trading is mental warfare; stamina matters.
Part 4: Balancing Risk and Growth
The challenge is balancing risk smart and grow fast. Too much focus on risk may lead to over-caution, missing opportunities. Too much focus on growth may cause reckless risk-taking.
Here’s how to strike the balance:
Risk Small, Scale Big – Start by risking 1–2% per trade. As your capital grows, absolute profits grow faster.
Compound Gains – Reinvest profits strategically instead of withdrawing all earnings.
Optimize Position Sizing – Adjust size based on volatility, conviction, and account size.
Use Asymmetric Setups – Look for trades where upside is significantly greater than downside.
Review Weekly, Act Daily – Analyze risk exposure weekly while executing growth trades daily.
Part 5: Practical Risk Smart Techniques
The 1% Rule – Never risk more than 1% of account value on a single trade.
Example: With $10,000 capital, maximum risk per trade = $100.
The 2:1 or 3:1 Rule – For every $1 risked, aim to make $2–$3.
Stop Loss & Trailing Stops – Set stop losses for protection and use trailing stops to lock profits as the trade moves in your favor.
Risk Diversification –
Across asset classes (stocks, forex, commodities, crypto).
Across sectors (IT, pharma, banking).
Across time horizons (scalping, swing, long-term).
Hedging with Options – Using protective puts or covered calls to cap downside risk.
Volatility Awareness – Adjusting position size based on market volatility (e.g., smaller trades during high VIX).
Part 6: Strategies to Grow Fast
Trend Following – Capturing large moves in trending markets. “The trend is your friend” until it bends.
Breakout Trading – Entering when price breaks major support/resistance levels with volume confirmation.
Swing Trading – Exploiting short- to medium-term price swings for consistent growth.
Position Trading – Holding positions for weeks/months based on macro or sectoral trends.
Leverage Smartly – Using moderate leverage to accelerate growth, but only when risk is tightly controlled.
Scaling In and Out – Adding to winning trades (pyramiding) and reducing exposure on uncertainty.
Part 7: Psychology of Risk Smart Growth
Trading success is 20% strategy and 80% psychology. To “risk smart, grow fast,” a trader must master their mind.
Discipline Over Impulse – Following the plan, not emotions.
Patience to Wait – Avoiding overtrading. Opportunities will always come.
Resilience to Losses – Viewing losses as part of the game, not personal failure.
Confidence Without Arrogance – Trusting your system but staying humble before markets.
Growth Mindset – Believing that skills improve with practice, not fixed by talent.
Part 8: Case Studies
Case 1: The Reckless Trader
Rahul had ₹5 lakhs and doubled it in 3 months by taking huge leveraged bets on penny stocks. But one wrong move wiped out 80% of his capital. His fast growth collapsed because he was not risk smart.
Case 2: The Risk Smart Trader
Anita had ₹5 lakhs too. She risked only 1% per trade, focused on high R/R setups, and compounded profits. In one year, she grew her account to ₹7.5 lakhs steadily. She didn’t double it overnight, but her growth was sustainable and replicable.
Lesson: Fast reckless growth often leads to collapse. Risk smart growth compounds wealth.
Part 9: Tools for Risk Smart Growth
Trading Journal – Records trades, mistakes, emotions, and improvements.
Risk Calculators – To determine position size before placing a trade.
Charting Platforms – TradingView, MetaTrader, NinjaTrader.
Backtesting Software – To validate strategies before applying real capital.
News & Data Feeds – For staying ahead of market-moving events.
AI & Algo Tools – Automating discipline and minimizing emotional decisions.
Part 10: The Roadmap to “Risk Smart, Grow Fast”
Foundation – Learn basics, risk management, and trading psychology.
System Development – Build and backtest your own trading strategy.
Capital Protection – Apply strict stop losses and position sizing.
Small Scale Trading – Start with small capital or paper trading.
Gradual Scaling – Increase trade size as consistency improves.
Compounding Phase – Reinvest profits to accelerate growth.
Mastery & Automation – Use technology and delegation for efficiency.
Conclusion
“Risk Smart, Grow Fast” is not just a slogan—it’s the essence of long-term trading success. The markets will always remain uncertain, volatile, and risky. But if you respect risk, embrace discipline, and use smart strategies, you can not only survive but thrive.
Fast growth in trading doesn’t come from reckless gambling—it comes from the slow magic of compounding, powered by smart risk management.
In the end, trading is like sailing. The winds of the market are unpredictable, but if you set your sails wisely, control your risks, and ride the waves with patience, you can reach your destination faster than you ever imagined.
Tata Steel Price Action Secrets |Backtesting Breakouts & SupportIn this video, I break down Tata Steel’s historical price action to understand its trading behavior. By backtesting past levels, we identify whether the stock respects support zones or follows breakout structures more reliably. This step-by-step analysis shows how to build your own tested data, spot recurring patterns, and improve decision-making in real trades.

Part 2 Support and ResistenceRisk Management in Options for Beginners
Options are risky if not handled well. Here’s how beginners can manage risks:
Never trade with all capital – Use only 10-20% of portfolio in options.
Set stop-loss – Don’t let losses grow.
Choose liquid contracts – Always trade in Nifty, Bank Nifty, or large-cap stocks with high liquidity.
Understand time decay (Theta) – Options lose value as expiry approaches.
Avoid shorting naked options – Unlimited risk for beginners.
Common Mistakes Beginners Make
Buying out-of-the-money options hoping for jackpot.
Ignoring Greeks (Delta, Theta, Vega).
Overtrading with small capital.
Trading without a strategy.
Not exiting on time.
Tips for Beginners to Succeed
Start with paper trading before real money.
Focus on 1-2 simple strategies (covered call, spreads).
Learn technical + fundamental analysis.
Be disciplined—don’t chase quick money.
Track and review trades weekly.

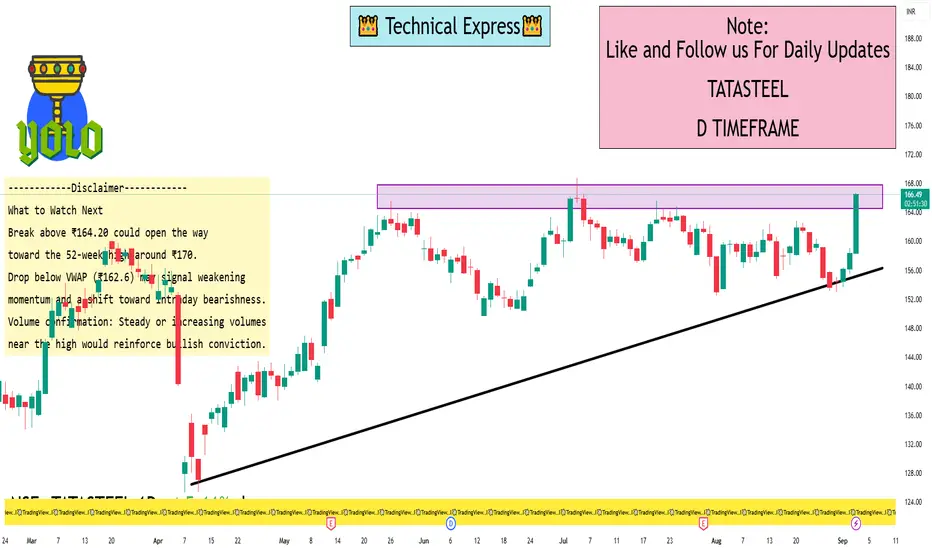
Tata SteelThe Tata Steel chart displays a bullish breakout from an ascending triangle pattern, supported by strong volume and positive momentum indicators. The price has moved above key resistance around ₹167–₹168, with bullish confirmation from EMAs and a strong MACD crossover, while the RSI at 64.05 suggests further upside potential before overbought conditions emerge. Based on this technical setup, a long trade could be considered with a stop-loss near ₹158–₹160 (below the trendline and EMAs) and a target toward ₹176–₹180, with further gains possible if strength continues. Risk management should be prioritized by closely monitoring for any reversal signs and ensuring the position is exited if bearish signals develop

Tata Steel Ltd. 1 Day ViewKey Intraday Metrics (Sep 3, 2025 – by mid-day)
Previous Close: ₹158.39
Today’s Trading Range: ₹158.40 (Low) to ₹164.20 (High)
Latest Price: Around ₹164.42, marking a gain of approximately +3.8% for the day
VWAP (Volume-Weighted Average Price): ₹162.61
Interpretation: One-Day Price Levels
Support Level: Around ₹158.40 — this represents the daily low, serving as a key intraday support.
Resistance Level: Around ₹164.20, just below the intraday high, acting as key intraday resistance.
VWAP (~₹162.6): This level is significant—price above VWAP indicates bullish pressure; below suggests bearish sentiment.
The stock is trading above both VWAP and the previous close, which is a sign of short-term bullishness.
Additional Context & Perspective
Short-Term Trend: According to TradingView’s technical indicators, the 1-day view shows a “strong buy”, and the 1-week view remains a “buy”
Momentum & Breadth: The 50-day and 20-day moving average crossovers suggest potential follow-through, with historical averages showing gains of ~5.6% within 30 days and ~3.7% within 7 days of such signals
52-Week Range: ₹122.62 (low) to ₹170.18 (high) — today’s high sits well within this broader context
Part 1 Ride The Big Moves Introduction to Options Trading
Options are one of the most versatile financial instruments in modern markets. Unlike stocks, where you directly buy or sell ownership in a company, options give you the right but not the obligation to buy (Call Option) or sell (Put Option) an underlying asset at a predetermined price within a specific period.
What makes options special is their flexibility. They allow traders to speculate, hedge, or generate income depending on market conditions. This versatility leads to the creation of numerous option trading strategies — each designed to balance risk and reward differently.
Understanding these strategies is crucial because trading options blindly can lead to substantial losses. Proper strategies help traders make calculated decisions, limit risk exposure, and maximize potential returns.
Basic Concepts in Options
Before diving into strategies, let’s clarify some key terms:
Call Option: Gives the holder the right (not obligation) to buy an asset at a specific strike price before expiry.
Put Option: Gives the holder the right (not obligation) to sell an asset at a specific strike price before expiry.
Strike Price: The pre-agreed price at which the option can be exercised.
Premium: The price paid to buy the option contract.
Expiry Date: The last date when the option can be exercised.
In-the-Money (ITM): When exercising the option is profitable.
Out-of-the-Money (OTM): When exercising the option is not profitable.
At-the-Money (ATM): When the strike price is equal to the current market price.
Options strategies are built by combining calls, puts, and underlying assets in different proportions.

Divergence SecretsHow Options Work in Real Life
Imagine buying insurance:
You pay a premium to the insurance company.
If an accident happens, you claim and get compensated.
If nothing happens, your premium is lost.
Options work the same way:
Premium = Insurance cost.
Strike Price = Insured value.
Expiry Date = Policy end date.
So, options are like insurance policies for traders!
Why Trade Options? (Advantages)
Leverage: Small capital can control a large position.
Flexibility: Profit in bullish, bearish, or sideways markets.
Hedging: Protects portfolio from big losses.
Defined Risk for Buyers: You only lose the premium paid.
Income Generation: Sellers earn premium regularly.

Part 2 Ride The Big MovesRisks & Rewards in Options Trading
Unlike stock trading, options have asymmetric risk-reward structures:
Option Buyers: Risk limited to premium paid, but potential profit can be unlimited (for calls) or large (for puts).
Option Sellers (Writers): Profit limited to premium received, but risk can be very high if the market moves sharply.
Hence, option writing is generally done by professional traders with high capital and hedging systems.
Option Trading in India
In India, options trading is regulated by SEBI and conducted on exchanges like NSE and BSE.
Lot Sizes: Options are traded in lots (e.g., Nifty = 50 units, Bank Nifty = 15 units).
Margins: Sellers must deposit margin with brokers to cover risk.
Expiry Cycle: Weekly (indices) and monthly (stocks).
Liquidity: Index options are most liquid (Nifty & Bank Nifty).

Part 1 Support and ResistanceIntroduction
Options trading is one of the most fascinating and versatile aspects of the financial markets. Unlike stocks, which give ownership in a company, or bonds, which provide fixed income, options are derivative instruments whose value is derived from an underlying asset such as stocks, indices, commodities, or currencies. They give traders the right, but not the obligation, to buy or sell the underlying asset at a predetermined price before a specific expiration date.
Because of this unique characteristic, options allow traders and investors to design strategies that suit a wide range of market conditions—whether bullish, bearish, or neutral. Through careful strategy selection, one can aim for limited risk with unlimited upside, hedge existing positions, or even profit from sideways markets where prices don’t move much.
This article explores options trading strategies in detail. We’ll cover the building blocks of options, common strategies, advanced combinations, and risk management. By the end, you’ll have a strong foundation to understand how professional traders use options to manage portfolios and generate returns.
1. Basics of Options
Before diving into strategies, it’s important to review some fundamental concepts.
1.1 What is an Option?
Call Option: Gives the holder the right (not obligation) to buy the underlying asset at a predetermined price (strike price) before or on expiration.
Put Option: Gives the holder the right (not obligation) to sell the underlying asset at a predetermined price before or on expiration.
1.2 Key Terms
Premium: The price paid to buy an option.
Strike Price: The agreed price to buy or sell the underlying.
Expiration Date: The last day the option can be exercised.
Intrinsic Value: Difference between underlying price and strike (if favorable).
Time Value: Portion of the premium that reflects time until expiration.
1.3 Options Styles
European Options: Exercisable only at expiration.
American Options: Exercisable any time before expiration.

Part 1 Ride The Big MovesKey Terminologies in Options
Before diving deeper, you need to know the “language of options.”
Strike Price → The fixed price at which you can buy/sell (like 2500 in Reliance example).
Premium → The cost you pay to buy an option.
Expiry Date → Options have a life—weekly, monthly, quarterly. After expiry, they are worthless.
Lot Size → Options are not traded in single shares. They come in fixed quantities called lots (e.g., Nifty lot size = 50).
In the Money (ITM) → Option has intrinsic value.
Out of the Money (OTM) → Option has no value (only time value).
At the Money (ATM) → Strike price = Current market price.
How Option Prices Are Decided
Option premiums are not random. They are influenced by:
Intrinsic Value (IV) → Difference between current price and strike price.
Example: Reliance at ₹2600, Call 2500 → Intrinsic value = ₹100.
Time Value → More time till expiry = higher premium.
Volatility → If a stock is volatile, options are expensive because chances of big movement are high.
Interest rates & Dividends → Minor but relevant in longer-term options.

Part 4 Learn Institutional TradingIntermediate Option Strategies
Straddle – Buy Call + Buy Put (same strike/expiry). Best for high volatility.
Strangle – Buy OTM Call + Buy OTM Put. Cheaper than straddle.
Bull Call Spread – Buy lower strike call + Sell higher strike call.
Bear Put Spread – Buy higher strike put + Sell lower strike put.
Advanced Option Strategies
Iron Condor – Sell OTM call + OTM put, hedge with farther strikes. Good for sideways market.
Butterfly Spread – Combination of multiple calls/puts to profit from low volatility.
Calendar Spread – Buy long-term option, sell short-term option (same strike).
Ratio Spread – Sell multiple options against fewer long options.
Hedging with Options
Options aren’t just for speculation; they’re powerful hedging tools.
Portfolio Hedge: If you own a basket of stocks, buying index puts protects against a market crash.
Currency Hedge: Importers/exporters use currency options to lock exchange rates.
Commodity Hedge: Farmers hedge crops using options to lock minimum prices.

Part 2 Support and ResistanceHow Options Work
Let’s break it down simply:
If you buy a call, you are betting that the price of the stock will go up.
If you buy a put, you are betting that the price of the stock will go down.
If you sell (write) a call, you are taking the opposite bet—that the stock won’t rise much.
If you sell (write) a put, you are betting that the stock won’t fall much.
Here’s a quick example:
Stock XYZ trades at ₹100.
You buy a 1-month call option with a strike price of ₹105 by paying a ₹5 premium.
If the stock rises to ₹120, your option is worth ₹15 (120 – 105). Since you paid ₹5, your profit = ₹10.
If the stock stays below ₹105, the option expires worthless, and you lose your premium of ₹5.
This example shows that options can magnify profits if you’re right, but they can also cause losses (limited to the premium paid for buyers, unlimited for sellers).
Types of Options
A. Call Options
Right to buy.
Used when you expect prices to rise.
Buyers have limited risk (premium) but unlimited upside.
Sellers (writers) have limited gain (premium received) but unlimited risk.
B. Put Options
Right to sell.
Used when you expect prices to fall.
Buyers have limited risk but big upside if stock falls sharply.
Sellers have limited gain (premium) but large risk if stock collapses.

Part 1 Support And ResistanceIntroduction to Option Trading
The stock market offers multiple instruments to trade and invest—stocks, futures, commodities, currencies, and derivatives. Among these, Options have gained tremendous popularity worldwide because they give traders flexibility, leverage, and strategies to profit in all types of market conditions—bullish, bearish, or even sideways.
At its core, an Option is a contract that gives a buyer the right but not the obligation to buy or sell an asset at a predetermined price (called the strike price) before or on a specific date (called the expiry date).
This right comes at a cost, known as the premium, which is paid by the option buyer to the option seller (also called the writer).
Options are widely traded on stocks, indices, commodities, and currencies. In India, for example, options on Nifty 50, Bank Nifty, Sensex, and individual stocks are among the most liquid contracts.
Why Options Exist?
Options exist to manage risk and to create trading opportunities. Think of them as financial insurance. Just like you pay a premium for car insurance to protect against damage, in options trading, investors pay a premium to protect themselves against adverse price moves.
For Hedgers: Options act as insurance. A stock investor can buy a put option to protect his portfolio if the market falls.
For Speculators: Options provide leverage. With small capital, traders can take large directional bets.
For Arbitrageurs: Options open opportunities to exploit price inefficiencies between the spot, futures, and options markets.

Part 4 Learn Institutional TradingParticipants in Options Market
Hedgers: Farmers, companies, or investors protecting against risk. Example: An airline hedging fuel cost with options.
Speculators: Traders betting on market moves with limited capital.
Arbitrageurs: Exploit mispricing between options and underlying.
Why Trade Options?
✅ Advantages:
Leverage: Small premium can control large value.
Flexibility: Can profit in any market condition.
Defined Risk: Buyer’s maximum loss = premium paid.
Income Strategies: Writing options to earn premium.
❌ Risks:
Time Decay: Options lose value daily.
Complexity: Many moving factors (Greeks, volatility).
Unlimited Losses (for Sellers): If selling naked options.

Trading Master Class With ExpertsDirectional Strategies
These are for traders with a clear market view.
Long Call (Bullish)
When to Use: Expecting significant upward movement.
Setup: Buy a call option.
Risk: Limited to premium paid.
Reward: Unlimited.
Example: NIFTY at 20,000, you buy 20,100 CE for ₹100 premium. If NIFTY closes at 20,500, your profit = ₹400 - ₹100 = ₹300.
Long Put (Bearish)
When to Use: Expecting price drop.
Setup: Buy a put option.
Risk: Limited to premium.
Reward: Large if the asset falls.
Example: Stock at ₹500, buy 480 PE for ₹10. If stock drops to ₹450, profit = ₹30 - ₹10 = ₹20.
Covered Call (Mildly Bullish)
When to Use: Own the stock but expect limited upside.
Setup: Hold stock + Sell call option.
Risk: Stock downside risk.
Reward: Premium income + stock gains until strike price.
Example: Own Reliance at ₹2,500, sell 2,600 CE for ₹20 premium.

Learn Institutional TradingIntroduction to Options Trading
Options trading is one of the most flexible and powerful tools in the financial markets. Unlike stocks, where you simply buy and sell ownership of a company, options are derivative contracts that give you the right, but not the obligation, to buy or sell an underlying asset at a predetermined price within a specified time frame.
The beauty of options lies in their strategic possibilities — they allow traders to make money in rising, falling, or even sideways markets, often with less capital than buying stocks outright. But with that flexibility comes complexity, so understanding strategies is crucial.
Key Terms in Options Trading
Before we jump into strategies, let’s understand the key terms:
Call Option – Gives the right to buy the underlying asset at a fixed price (strike price) before expiry.
Put Option – Gives the right to sell the underlying asset at a fixed price before expiry.
Strike Price – The price at which you can buy/sell the asset.
Premium – The price you pay to buy an option.
Expiry Date – The date the option contract ends.
ITM (In-the-Money) – When exercising the option would be profitable.
ATM (At-the-Money) – Strike price is close to the current market price.
OTM (Out-of-the-Money) – Option has no intrinsic value yet.
Lot Size – Minimum number of shares/contracts per option.
Intrinsic Value – The real value if exercised now.
Time Value – Extra premium based on time left to expiry.

Part 2 Support and ResistanceIntroduction to Options Trading
Options trading is one of the most flexible and powerful tools in the financial markets. Unlike stocks, where you simply buy and sell ownership of a company, options are derivative contracts that give you the right, but not the obligation, to buy or sell an underlying asset at a predetermined price within a specified time frame.
The beauty of options lies in their strategic possibilities — they allow traders to make money in rising, falling, or even sideways markets, often with less capital than buying stocks outright. But with that flexibility comes complexity, so understanding strategies is crucial.
Key Terms in Options Trading
Before we jump into strategies, let’s understand the key terms:
Call Option – Gives the right to buy the underlying asset at a fixed price (strike price) before expiry.
Put Option – Gives the right to sell the underlying asset at a fixed price before expiry.
Strike Price – The price at which you can buy/sell the asset.
Premium – The price you pay to buy an option.
Expiry Date – The date the option contract ends.
ITM (In-the-Money) – When exercising the option would be profitable.
ATM (At-the-Money) – Strike price is close to the current market price.
OTM (Out-of-the-Money) – Option has no intrinsic value yet.
Lot Size – Minimum number of shares/contracts per option
