Tata Steel: Bounce Back After Correction from ₹120 Ceiling🔍 Technical Analysis
In June 2024, Tata Steel hit an all-time high of ₹185 but later corrected, bottoming near ₹120 in January 2025.
The stock has since formed a higher-high, higher-low structure and currently trades around ₹162.
If the pattern sustains, the next upside targets are:
🎯 Target 1: ₹170
🎯 Target 2: ₹180
🎯 Target 3: ₹190 (new all-time high)
Suggested stop-loss is near the recent swing low at ₹150. A drop below ₹120–₹125 (major demand zone) would invalidate the bullish thesis.
💰 Q4 FY24 Financial Highlights (vs Q3 FY24 & Q4 FY23)
Total Income: ₹56,218 Cr (↑+5% QoQ vs ₹53,648 Cr; ↓–4% YoY vs ₹58,687 Cr)
Total Expenses: ₹49,659 Cr (↑ 4.7% QoQ from ₹47,745 Cr; ↓ 4.7% YoY from ₹52,087 Cr)
Total Operating Profit: ₹6,559 Cr (↑+11% QoQ vs ₹5,903 Cr; ↓–1% vs ₹6,601 Cr)
Profit Before Tax: ₹2,200 Cr (↑+32% QoQ vs ₹1,672 Cr; ↑+22% YoY vs ₹1,809 Cr)
Profit After Tax: ₹1,201 Cr (↑+298% QoQ vs ₹295 Cr; ↑+116% YoY vs ₹555 Cr)
Diluted EPS: ₹1.04 (↑+300% QoQ vs ₹0.26; ↑+112% YoY vs ₹0.49)
📌The sharp sequential and year-on-year rise in PAT reflects strong recovery driven by volume growth and cost-cutting.
📈 Fundamental Highlights
Consolidated Q4 PAT surged 113% to ₹1,301 Cr, outperforming estimates (ET cites +113% YoY rise)
Revenue grew 5% sequentially to ₹56,218 Cr; raw material costs fell ~18%, reducing total expenses by ~4% YoY
EBITDA margin improved sequentially from ~11% to 12% with consolidated EBITDA at ₹6,762 Cr
Shareholder Return: A dividend of ₹3.60 per share was announced
Operational Efficiency: Higher sales in India (~21 Mt) due to capacity ramp-up, improved margins in Netherlands, and reduced UK losses
Debt Management: Net debt trimmed to ₹82,579 Cr, and ₹6,600 Cr in capex delivered cost benefits
🧭 Outlook
Tata Steel’s Q4 results reflect earning resilience, operational efficiency, and strong cost control. Technically, it's trading within a constructive higher-high pattern. Confirmed support above ₹150 and maintaining above the swing zone boosts the probability of reaching the upside targets. A break below ₹120–₹125, however, could negate this bullish setup.
⚠️ Disclaimer
This is for informational purposes only. Do not consider it investment advice. Please consult a qualified advisor before making any investment decisions.
Trade ideas

Trendline entry, can drive the price higherA good opportunity to ride the trend
follow strict target and stoploss
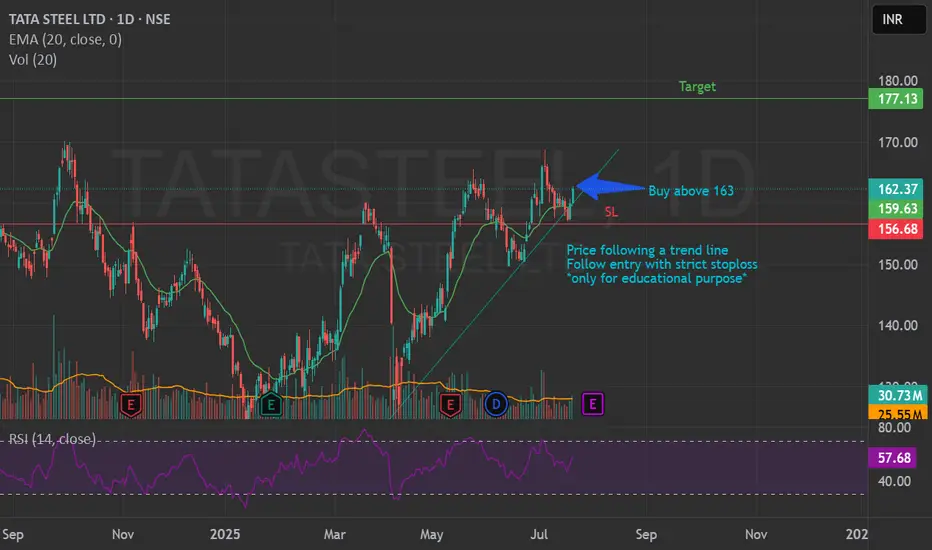
TATASTEELStock broke previous resistance now stock back at broken resistance acting as support, possible bounce from current level holding with candle closing basis
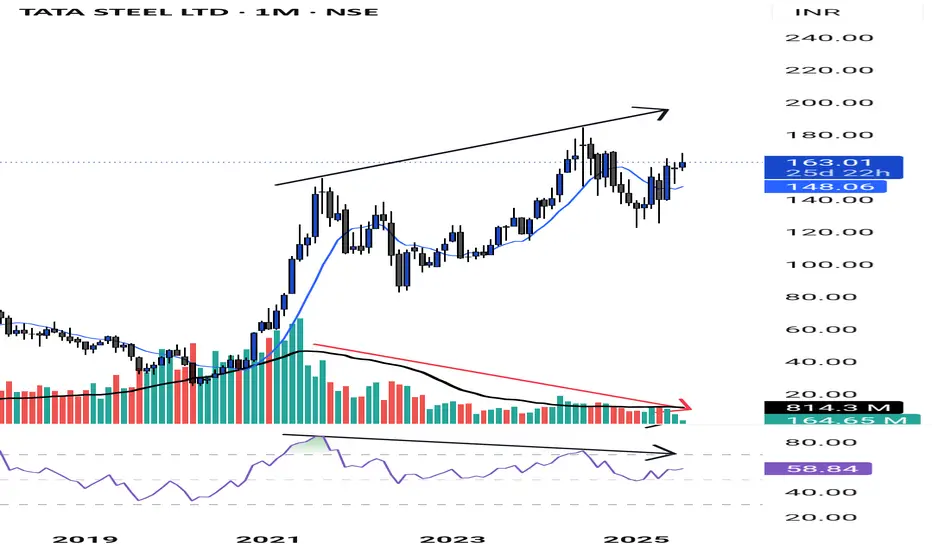
Swing Trading - Stock Options Buying Strategy Part 3📊 Tata Steel Monthly Chart Analysis
Indicators: RSI Divergence, Volume Contraction, and Market Structure
In the monthly chart of Tata Steel, we can observe some crucial technical signals that traders should pay attention to:
🔻 1. Volume Contraction
The volumes are gradually contracting, indicating a reduction in participation and momentum. This often signals a potential reversal or a consolidation phase in the market.
📉 2. RSI Divergence
A clear RSI divergence is forming—while the price is making higher highs, the RSI is forming lower lows. This reflects a loss of strength in the uptrend and a weakening momentum.
⚠️ Note:
There’s a common misconception that RSI divergence always leads to a price fall. While it can be an early warning signal, we do not take trades based solely on RSI divergence. Instead, we confirm signals using market structure and volume.
✅ Confirmation Using Market Structure
To validate the divergence, we also check:
Market Structure – Patterns like higher highs/higher lows or lower highs/lower lows.
Volume Behavior – Are volumes expanding or contracting?
Only when these elements align do we consider it a reliable trade setup—as discussed in Part 1 and Part 2 of our sessions.
📌 Five Key Steps for Analyzing Any Stock
Whether trading cash, futures, or options, follow this proven five-step approach:
1. Start with the Monthly Timeframe
This is a golden rule.
Never begin with a smaller timeframe. The monthly chart gives you the most reliable trend information. On the monthly chart:
Identify the latest swing high and swing low
Check if the price is above the 9-period SMA
2. Check Volume on Monthly Chart
Observe what the volume is doing:
Increasing? Decreasing? Flat?
Volume behavior gives deeper insight into the strength or weakness of the trend.
3. Look for RSI Divergence on Monthly
Is there a mismatch between price and momentum?
If the RSI shows divergence while prices climb, it could indicate an upcoming reversal.
4. Repeat the Process on Weekly and Daily Charts
Once the monthly chart confirms your bias:
Move to the weekly chart. Check if it is also above the 9 SMA.
Then check the daily for potential entry setups.
📌 Often, the weekly and daily charts will give earlier signals of 9 SMA crossovers before the monthly confirms the trend.
5. Confirm Trend and Set Risk Management Rules
Identify the ongoing trend:
Uptrend: Higher highs and higher lows
Downtrend: Lower highs and lower lows
Set your trade plan:
Stop Loss (SL): Below the previous swing low
Target: Based on the swing high from a higher timeframe
📈 Final Thoughts
To trade effectively, align these five elements:
Higher timeframe confirmation (start with monthly)
Volume behavior
RSI divergence
Market structure
Solid risk management plan
Only when all conditions align should a trade be considered.
This structured approach prevents emotional trading and increases the probability of success.
List of 50 NSE liquid stocks - RELIANCE, INFY, HDFCBANK, ICICIBANK, SBI, TATAMOTORS, TATASTEEL
AXISBANK, BAJFINANCE, LT, ITC, TCS, HINDALCO, POWERGRID, BHARTIARTL, MARICO
HINDUNILVR, NTPC, ONGC, WIPRO, SBIN, COALINDIA, GRASIM, M&M, ULTRACEMCO
HDFC, CIPLA, EICHERMOT, NESTLEIND, BRITANNIA, ASIANPAINT, SUNPHARMA, DRREDDY
AMBUJACEM, TATACHEM, GODREJPROP, INDUSINDBK, CANBK, IOC, PFC, RECLTD
BIOCON, HINDPETRO, NTPC, PETRONET, SBILIFE, LAURUSLABS, COLPAL, BAJFINANCE
Add to your watchlist. Only trade in these.
Please leave a comment if you have any doubts. God bless you all!
TATA STEEL | Time for Metals to ShineIt has been consolidating in triangle pattern since very long and it's on the verge of breakout. Metals have cyclical nature and CNXMETAL is also forming good pattern for breakout so seems like it is time for metals to shine. Ensure that volume is more than median during time for breakout to avoid false breakout.
Entry -: 117.45 (at least 1 hour closing candle)
Target -: 172
SL -: 104 (daily closing basis)
RRR -: 1:4
Use trailing SL after 1:2

LONG TATASTEEL Target 247 This is Long Term View as per Monthly charts and need patience to see the target.
Tata Steel has broken out from Flag pattern and ready to make new high
Target 1 - 170
Target 2 - 212
Target 3 - 247

Tata steel cup Handle breakoutTata steel cup and handle breakout and the price is near resistance also with support coming close to the resistance suggesting possible breakout.
Buy around - 160
Target - 180 (13%)
Duration - 1 month
Tata steel have good fundamentals and showing breakout possibility

Option Trading with Option chain part -3Example of an Option. Suppose that Microsoft (MFST) shares trade at $108 per share and you believe they will increase in value. You decide to buy a call option to benefit from an increase in the stock's price. You purchase one call option with a strike price of $115 for one month in the future for 37 cents per contract ...
Ans: Options contracts are of two types; Call options and Put options. However, they can differ based on their underlying assets and expiration date.

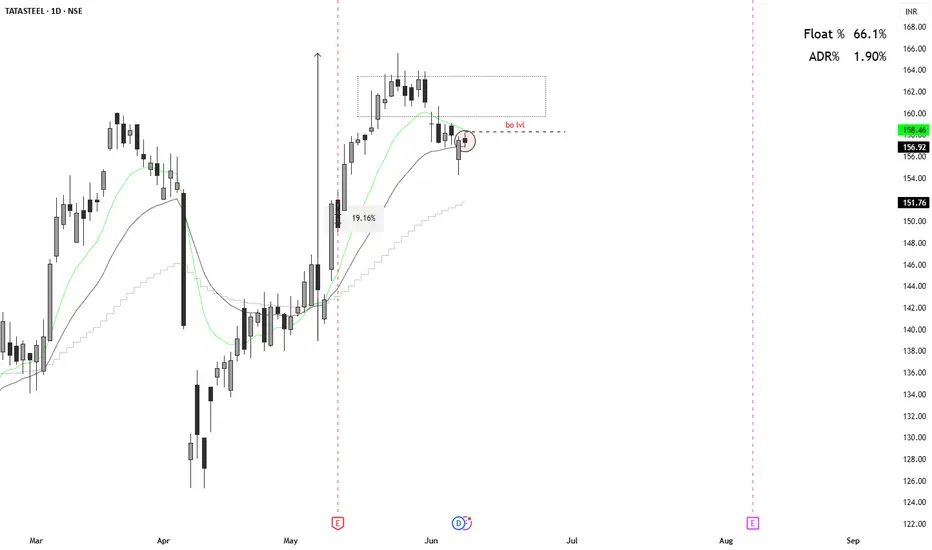
Good momentum stock, gave clean rally, pulled back Good momentum stock, gave clean rally, pulled back and consolidated forming narrow ranges ready for B.O ( The output of the BO is based on mkt condition)
TATA STEEL: At a make-or-break level• Tata steel is trading between two different channel system for the last one year.
• On 19th May It broke out from channel system 1
• On 25th May it broke the channel system 2 with good volume.
• There after the market is sideways and there is a volume contraction is observed.
• Weekly candle is indication a bearish piersing
• A fake BD below level 160 could lead the price on channel system 2 and EMA 21 around 156.5
• A free fall might happen there after.
• Go long only if a strong bullish marubuzo closing above 166.
• Wait and watch the show!!!

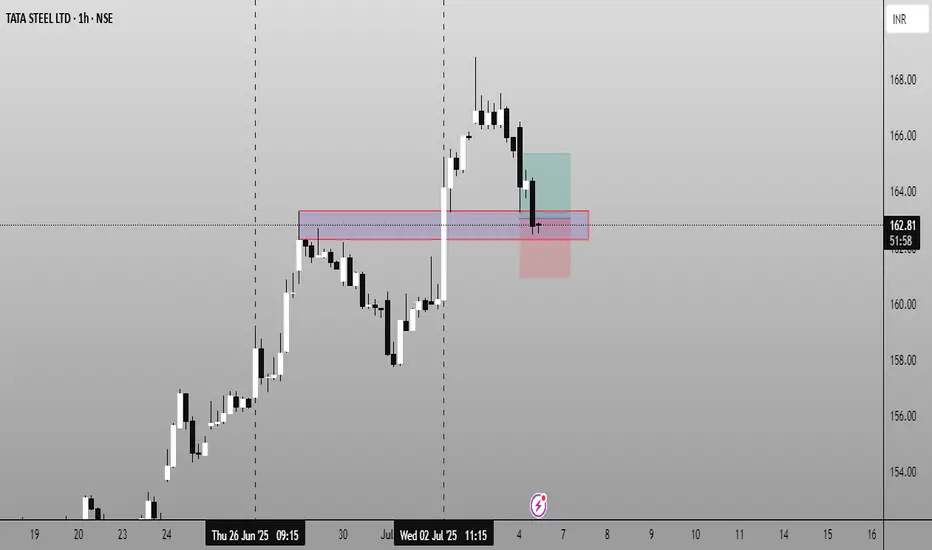
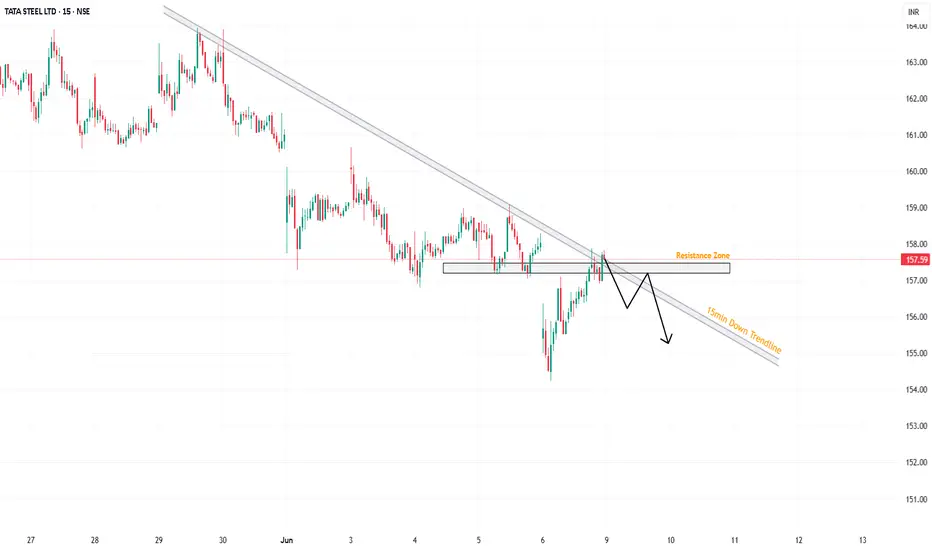
TATASTEEL | 15 min Idea – 10 June 2025 / SWING📌 TATASTEEL | 15 min Idea – 7 June 2025
Bias: Neutral to Bearish
CMP: 157.59
Market Structure
• Price is hovering just below a resistance zone near 158.5–159.5.
• Mild downward pressure with lower highs forming.
Levels
│ R1 158.50 │ R2 159.50
│ S1 156.50 │ S2 154.80
Trade Plan
🟢 Breakout Long → Entry on 15‑min close > 158.60.
Targets 159.80 / 161.00 | SL 157.20.
🔴 Breakdown Short → Entry on 15‑min close < 156.30.
Targets 155.00 / 153.50 | SL 157.90.
Notes
• Volume faded near resistance – signs of exhaustion.
• Sideways consolidation suggests wait for breakout trigger.
Set alerts at 158.60 and 156.30; manage risk ≤ 1% per trade.
#PriceAction #TATASTEEL #15min #GLOBALTRADESECURITIES
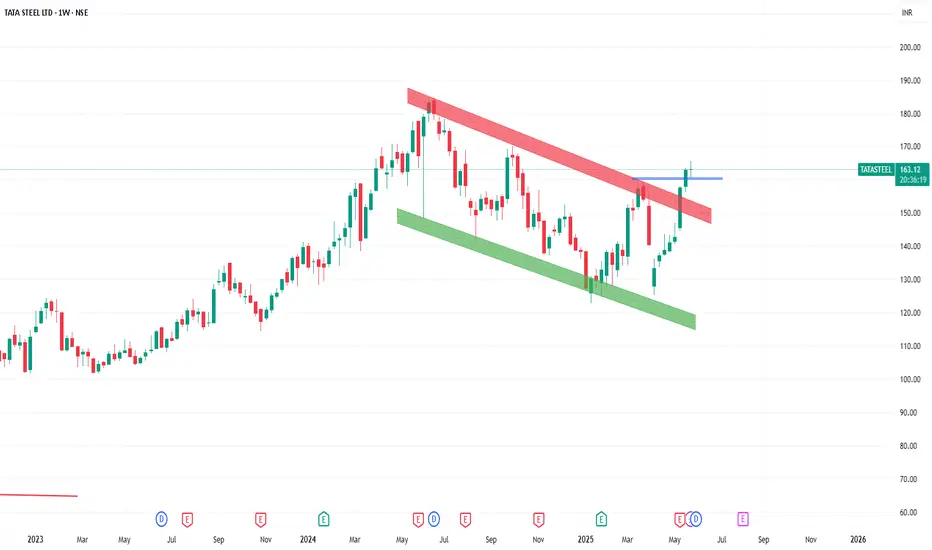
Tata Steel: Breaking Out with Strong Q4 Momentum🔍Technical Overview
Tata Steel has been range-bound between ₹20–₹80 for over a decade. In 2021, it broke above the ₹80 resistance, which then acted as support in 2022. The stock rallied to ₹184 by June 2024, then it came to ₹120.
A descending channel formed during this correction, characterized by lower highs and lower lows. This pattern was decisively broken in May 2025, coinciding with strong Q4 results. The stock surpassed its recent lower high and is now trading at ₹163.
Key Levels:
Resistance: ₹170 (Target 1), ₹180 (Target 2), ₹190 (Target 3)
Support: ₹160, ₹150, and a major demand zone at ₹120
The breakout, supported by robust financials, suggests a bullish trend continuation.
💰Q4 FY25 Key Financial Highlights:
Tata Steel's Q4 FY25 performance showed significant improvement compared to the previous quarter:
Total Income: ₹56,218 Cr (vs ₹53,648 Cr in Q3 FY25)
Total Expenses: ₹49,659 Cr (vs ₹47,745 Cr in Q3 FY25)
Total Operating Profits: ₹6,559 Cr (vs ₹5,903 Cr in Q3 FY25)
Profit Before Tax: ₹2,200 Cr (vs ₹1,672 Cr in Q3 FY25)
Profit After Tax: ₹1,201 Cr (vs ₹295 Cr in Q3 FY25)
Diluted Normalized EPS: ₹1.04 (vs ₹0.26 in Q3 FY25)
Compared to Q4 FY24, while revenue saw a slight decline, net profit more than doubled, indicating improved operational efficiency.
🧾Fundamental Insights
Cost Efficiency: The significant profit increase is attributed to reduced input costs, particularly in raw materials like coking coal and iron ore.
Dividend Declaration: The company announced a dividend of ₹3.60 per share, reflecting confidence in its financial health.
Market Position: Tata Steel's strategic cost management and operational efficiency have positioned it favorably in the steel industry, even amidst global challenges.
📊Conclusion
Tata Steel's technical breakout, coupled with strong Q4 financials, indicates a positive outlook. Investors should monitor key support and resistance levels as the stock navigates its upward trajectory.
Disclaimer: lnkd.in
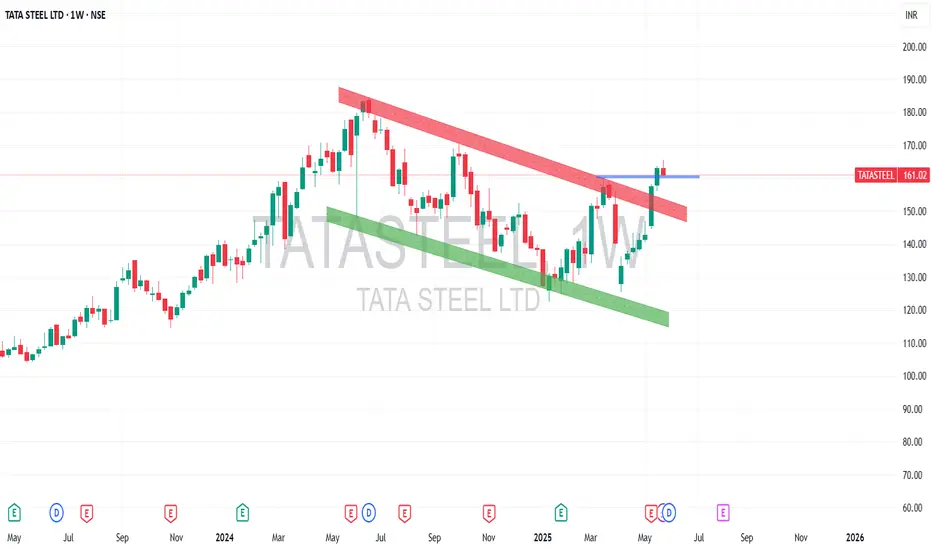
Tata Steel: Breaking Out with Strong Q4 Momentum🔍 Technical Overview
Tata Steel has been range-bound between ₹20–₹80 for over a decade. In 2021, it broke above the ₹80 resistance, which then acted as support in 2022. The stock rallied to ₹184 by June 2024, then it came to ₹120.
A descending channel formed during this correction, characterized by lower highs and lower lows. This pattern was decisively broken in May 2025, coinciding with strong Q4 results. The stock surpassed its recent lower high and is now trading at ₹163.
Key Levels:
Resistance: ₹170 (Target 1), ₹180 (Target 2), ₹190 (Target 3)
Support: ₹160, ₹150, and a major demand zone at ₹120
The breakout, supported by robust financials, suggests a bullish trend continuation.
💰 Q4 FY25 Key Financial Highlights:
Tata Steel's Q4 FY25 performance showed significant improvement compared to the previous quarter:
Total Income: ₹56,218 Cr (vs ₹53,648 Cr in Q3 FY25)
Total Expenses: ₹49,659 Cr (vs ₹47,745 Cr in Q3 FY25)
Total Operating Profits: ₹6,559 Cr (vs ₹5,903 Cr in Q3 FY25)
Profit Before Tax: ₹2,200 Cr (vs ₹1,672 Cr in Q3 FY25)
Profit After Tax: ₹1,201 Cr (vs ₹295 Cr in Q3 FY25)
Diluted Normalized EPS: ₹1.04 (vs ₹0.26 in Q3 FY25)
Compared to Q4 FY24, while revenue saw a slight decline, net profit more than doubled, indicating improved operational efficiency.
🧾 Fundamental Insights
Cost Efficiency: The significant profit increase is attributed to reduced input costs, particularly in raw materials like coking coal and iron ore.
Dividend Declaration: The company announced a dividend of ₹3.60 per share, reflecting confidence in its financial health.
Market Position: Tata Steel's strategic cost management and operational efficiency have positioned it favorably in the steel industry, even amidst global challenges.
📊 Conclusion
Tata Steel's technical breakout, coupled with strong Q4 financials, indicates a positive outlook. Investors should monitor key support and resistance levels as the stock navigates its upward trajectory.
⚠️ Disclaimer
This report is for informational purposes only and does not constitute investment advice. Investors should conduct their own research or consult with a financial advisor before making investment decisions.
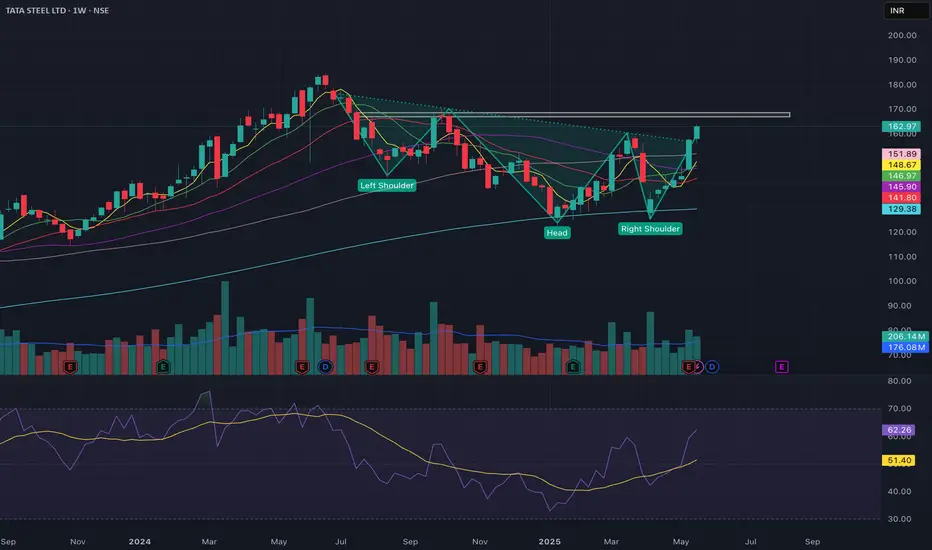
TATASTEEL ready to reach 200Inv H&S patterns observed in W.
Taken support at the MA.
RSI divergence with strength above 50.
Resistance at 170 beyond which target of 200.
Divergence Trading Divergence occurs when the stochastic oscillator's peaks or troughs disagree with the price. For instance, if the stochastic makes lower highs while the price is rising, it indicates a bearish divergence. Likewise, higher stochastic lows against lower price lows indicate a bullish divergence.

RSI Divergence Part 3RSI divergence happens when the price and the RSI move in opposite directions. This signals that the current trend may be losing momentum and could reverse soon. For example, if the price keeps rising but the RSI starts falling, it could mean the uptrend is weakening.

RSI DivergenceRSI divergence happens when the price and the RSI move in opposite directions. This signals that the current trend may be losing momentum and could reverse soon. For example, if the price keeps rising but the RSI starts falling, it could mean the uptrend is weakening.

Explanation of MACDThe Moving Average Convergence Divergence (MACD) is a technical indicator used in trading to analyze the strength, direction, and momentum of a trend. It's calculated using two exponential moving averages (EMAs) and a signal line, helping traders identify potential entry and exit points.

Technical Analysis class1 1Technical analysis is a means of examining and predicting price movements in the financial markets, by using historical price charts and market statistics. It is based on the idea that if a trader can identify previous market patterns, they can form a fairly accurate prediction of future price trajectories.

RSI Divergence Part 2RSI divergence happens when the price and the RSI move in opposite directions. This signals that the current trend may be losing momentum and could reverse soon. For example, if the price keeps rising but the RSI starts falling, it could mean the uptrend is weakening.

More About RSIRSI is a tool that aids traders in capturing market momentum by measuring the fluctuation in prices. Traders rely on RSI to spot oversold and overbought markets and determine the right time to enter a trade. RSI helps traders identify whether a stock is either overbought or oversold.

RSI and RSI Divergence Part 2RSI (Relative Strength Index) is a momentum indicator that measures recent price changes to assess if an asset is overbought or oversold. RSI divergence occurs when the price of an asset and its RSI move in opposite directions, potentially indicating a trend reversal or weakening trend. There are two main types: bullish divergence (price makes lower lows while RSI makes higher lows) and bearish divergence (price makes higher highs while RSI makes lower highs).

Advanced Divergence Trading AnalysisA positive divergence means price is making lower lows while an indicator/oscillator is making higher highs. On the other hand, a negative divergence happens when price is making higher highs while an indicator/oscillator is forming lower lows.
