M&M... Ready for the Reversal .....?? MAHINDRA & MAHINDRA LTD: CMP: 2585.10; RSI: 38.12
Mahindra and Mahindra stock is 21% down from its recent highs and in oversold zone. Script is below its all moving averages 10...200 days EMA. On daily chart Harmonic Shark pattern is visible . Current market price is, at its Potential Price Reversal Zone (PRZ), and price trend reversal can unfold in coming days. It can be rewarding bet for aggressive traders with risk to profit of 1:3.
Entry: 2510-2600;
Stop loss- 2425;
Targets:
Target -1- 2835 (Book 50% profit);
Target-2-2985
✅ FOR MORE TRADING IDEAS LIKE THIS, LIKE, SHARE, AND FOLLOW MY IDEA STREAM ✅
MOM trade ideas

Yearly Breakout Candidate @3200M&M is trying to break out of a year-long consolidation.
Many mutual fund houses have been accumulating M&M, good strong business, healthy CF as well and overall market share, sales, and profits are growing.
Good opportunity if the stock gives a monthly closing above 3200.

Mahindra & Mahindra – Activity Picking Up! Watch CloselyHey Family, here’s another stock showing a strong technical setup! 🚀
📈 Stock: Mahindra & Mahindra Ltd (NSE: M&M)
🔍 Key Observations:
📊 Chart Pattern:
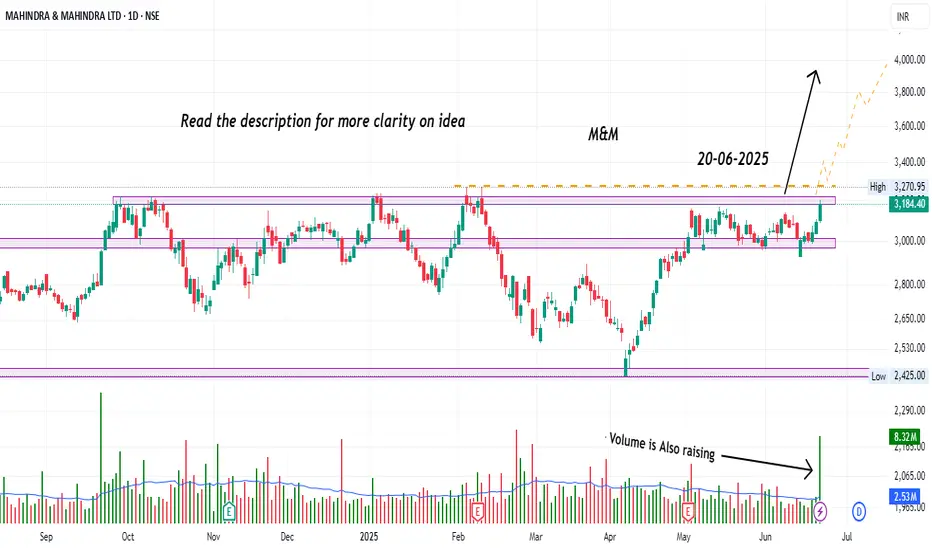
The stock is displaying a Horizontal Breakout Setup from a well-defined multi-month resistance zone, dating back to 07-10-2021. This forms a strong bullish continuation base, indicating potential for a sustained move higher.
📈 Recent Price Action:
• M&M has recently tested the upper boundary of its resistance zone around ₹3,270, which has been respected multiple times in the past (notably on 18-06-2025 and 20-06-2025).
• The current close at ₹3,184.40 (+2.90%) on June 20, 2025, shows increasing buying momentum near this critical resistance level.
• Volume surged to 8.32M, significantly above average, confirming institutional participation and validating the price action.
📦 Volume Insight:
The volume spike on the breakout attempt signals strong accumulation. This is a vital confirmation factor for the bullish case.
💡 Trading Recommendation:
Aggressive Approach:
• Traders can consider participating based on the current price structure, using proper risk management techniques aligned with individual trading plans.
Conservative Approach:
• Alternatively, wait for a clear breakout confirmation with strong follow-through and closing strength above the resistance zone before considering entry. This helps reduce false breakout risks.
🧠 Rationale:
The recent price behavior, combined with heightened volume activity, reflects growing interest in the stock. Such conditions often signal a shift in market sentiment. Observing how the stock reacts in the coming sessions can provide useful cues. Traders should focus on structure, strength, and participation—adapting their approach based on personal style and risk preference.
🚨 Disclaimer: This is not financial advice. All views are shared for educational purposes only. Please do your own research and always manage your risk before making any trading decisions.
📢 What’s your view? Drop it in the comments and boost the idea if you found it useful – your support helps us keep sharing quality setups! 💬🔥
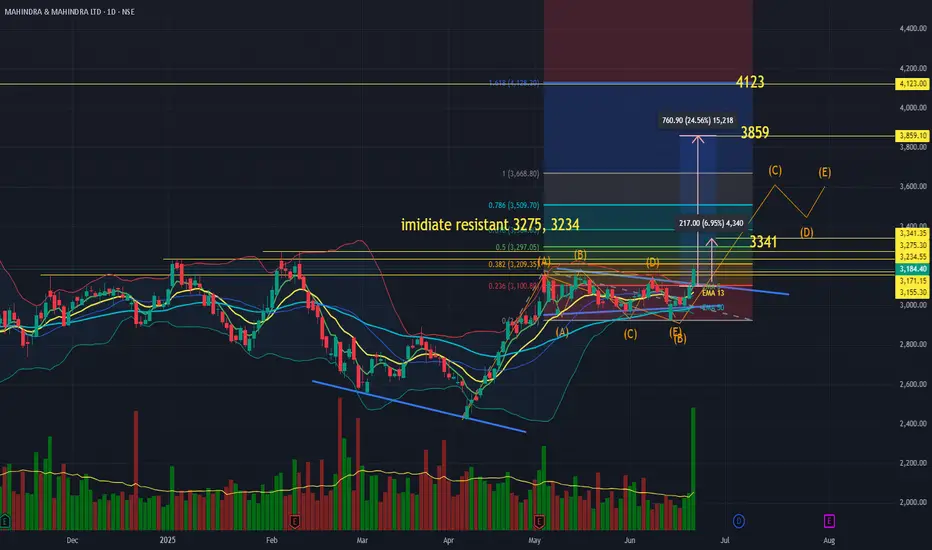
Mahindra and Mahindra flag &pole break out (possibility 3rd waveMahindra and Mahindra flag &pole break out (possibility of 3rd wave as per study
Break out of resist 3170
Flag and pole break out breakout, angular trend line breakout
immediate resistant 3275, 3234
with target of as per trend base fib retracement 1st 4123, 2nd 3859 3rd 3341
Bollinger band challenged up side ema positive crossover
parameter macd uptick abv 0 line and positive cross over
rsi 64.35,
as per Elliotte wave, stock moved from completion of 2nd wave and could be entering into 3rd wave , as per the study 3rd wave target will be measured through TBFR, and it would be 4123
this is for study purpose only
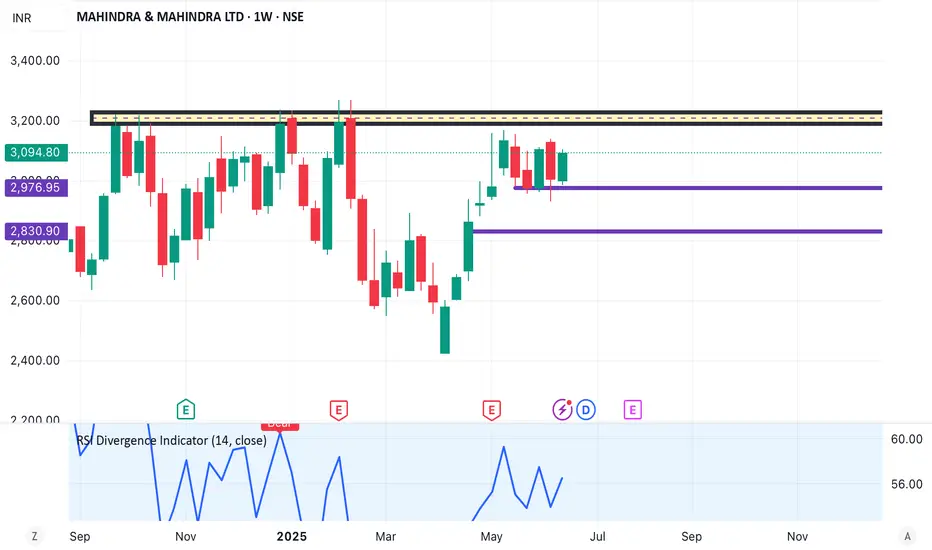
Mahindra & Mahindra weekly chart idea🔥 Mahindra & Mahindra (M&M) Weekly Chart वर जबरदस्त Breakout Setup तयार होत आहे:
✅ Flag Pattern पूर्ण – Ready for breakout
✅ Inverted Head & Shoulders – ₹3,200 is neckline (Line Chart वर स्पष्ट)
✅ Fibonacci Retracement – 0.382 वरून Price ने वळण घेतलं आहे
✅ Trendline Resistance – ₹3,270 वर Breakout confirm झाल्यास momentum वाढेल
✅ RSI Divergence – Bullish confirmation
📈 Confluence of 3 strong technical signals:
🔹 Flag pattern +
🔹 Inverted H&S +
🔹 Fibo bounce = 🔥 High conviction breakout
---
🎯 Targets (post breakout above ₹3,270):
▶ Target 1: ₹3,680
▶ Target 2: ₹3,900
🛡 Stop Loss (weekly close basis): ₹2,975
---
🙏 जय माऊली!
चार्टने दिला संकेत – कृती ठेवा ठाम, breakout आल्यावर होईल श्रीराम!
#mahindra #nse #priceaction #flagpattern #headandshoulders #technicalanalysis #tradingview
Divergence Test Divergence is when the asset price moves in the direction opposite to what a technical indicator indicates. When a stock is diverging, it signals weaker price trends and the beginning of a reversal.

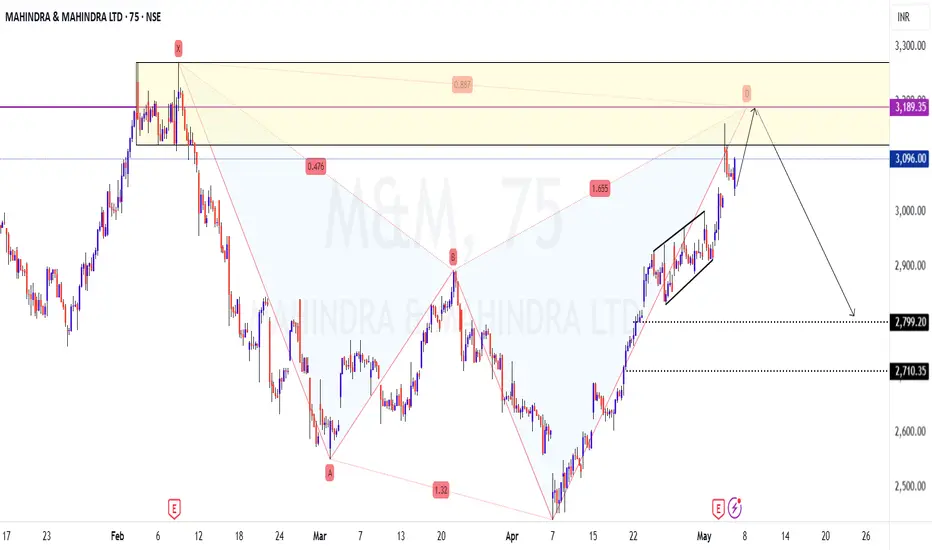
M&M PRZ at 3190 - Not a place or time to go long nowThe Shark pattern PRZ is placed at 3180-200 levels. Expecting the price to sell off from there. A minimum of 50-60% of the CD leg could be the level to expect on this counter in the coming days.. Not a place to go long
M$M DOUBLE BOTTOM BREAKOUT M&M breaking double bottom weekly
with good volume since few week
RSI good, RSI divergence
breaking 20 ema also
#target1 3100 breaking it
will reach #target2 3230
NO BUY/SELL RECOMENDATION

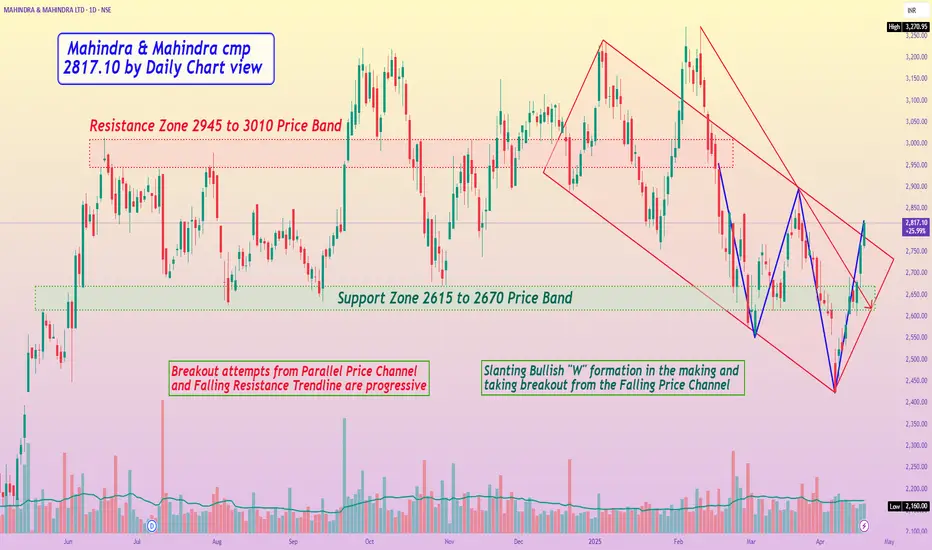
Mahindra & Mahindra cmp 2817.10 by Daily Chart viewMahindra & Mahindra cmp 2817.10 by Daily Chart view
- Support Zone 2615 to 2670 Price Band
- Resistance Zone 2945 to 3010 Price Band
- Volumes are seen to be getting in close sync with the average traded quantity
- Breakout attempts from Parallel Price Channel and Falling Resistance Trendline are progressive
- Slanting Bullish "W" formation in the making and taking breakout from the Falling Price Channel
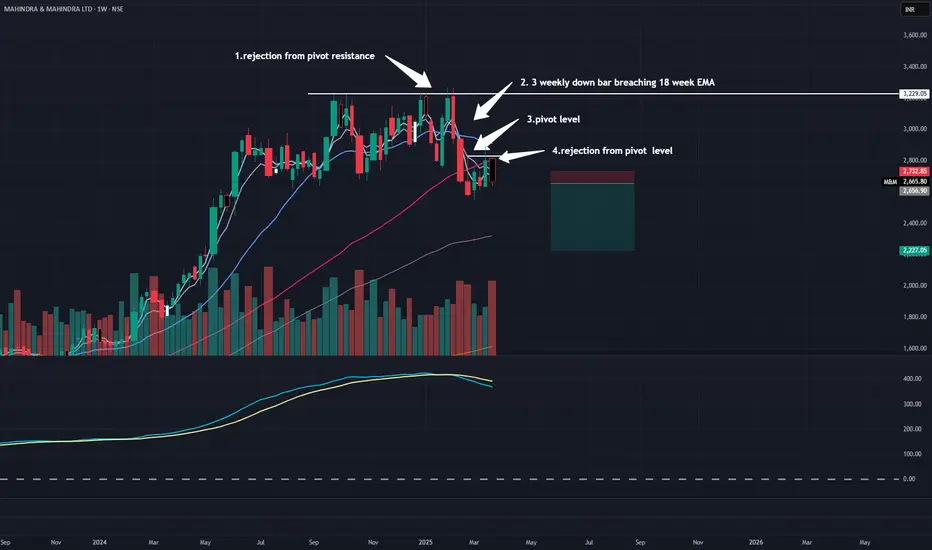
M&M- short for 15 %auto sector looks weak
Mahindra & Mahindra's (M&M) share price has experienced a decline recently, influenced by several factors:
1.Investment in Subsidiaries: In February 2025, M&M announced plans to invest up to ₹4,500 crore in rights issues for its subsidiaries—₹3,000 crore for Mahindra & Mahindra Financial Services Ltd. and ₹1,500 crore for Mahindra Lifespace Developers Ltd. This move raised concerns among investors about potential cash outflows, leading to a significant drop in M&M's stock price.
2.Potential Entry of Tesla into the Indian Market: Reports suggest that Tesla is preparing to enter the Indian automotive market. This development has caused apprehension among local automakers, including M&M, about increased competition in the electric vehicle segment. Consequently, M&M's shares declined by approximately 6.2% following these reports.
Reuters
3.Ongoing Tax Disputes: M&M is involved in tax disputes amounting to $694 million, primarily related to income tax and excise duties. Such significant disputes can create uncertainty and negatively impact investor sentiment.
technials
1.price faced rejection from 3250 levels
2.3 weekly down bars
3. retracement followed by bearish bar
4.negative crossover of 18 and 50 week EMA looks imminent
4.MACDS are negative
target and SL marked
Mahndra & Mahindra Support & ResistanceMahindra & Mahindra Ltd (M&M) is a leading Indian multinational company headquartered in Mumbai, India. It is part of the Mahindra Group and is primarily engaged in the automotive and farm equipment sectors. The company is one of the largest manufacturers of tractors in the world and has a strong presence in utility vehicles, commercial vehicles, and electric vehicles.
### **Key Information:**
- **Founded:** 1945 (as Mahindra & Mohammed)
- **Headquarters:** Mumbai, India
- **Chairman:** Anand Mahindra
- **CEO & MD:** Anish Shah
- **Business Segments:**
- **Automotive:** SUVs, electric vehicles (EVs), commercial vehicles.
- **Farm Equipment:** Tractors, agricultural machinery.
- **Financial Services:** Mahindra Finance.
- **IT & Technology:** Tech Mahindra.
- **Renewable Energy & Real Estate:** Mahindra Solar, Mahindra Lifespaces.
### **Notable Products:**
- **SUVs:** Scorpio, Thar, XUV700, Bolero.
- **Electric Vehicles:** XUV400 EV, Treo electric auto.
- **Tractors:** Mahindra Yuvo, Jivo, Novo series.
M&M has a strong global presence, with operations in the U.S., Europe, Africa, and other emerging markets. It is also known for its investments in electric mobility, sustainability, and advanced technologies.

Mahindra & Mahindra Bearish View Why ? Mahindra & Mahindra Ltd. (M&M) is a prominent Indian multinational corporation and the flagship company of the **Mahindra Group**, a diversified conglomerate with interests spanning various sectors.
**Overview**
- **Founded**: October 2, 1945, as **Mahindra & Mohammed** in Ludhiana, Punjab.
- **Founders**: J.C. Mahindra, K.C. Mahindra, and Malik Ghulam Muhammad.
- **Headquarters**: Mumbai, Maharashtra, India.
- **Key People**:
- **Anand Mahindra**: Chairman.
- **Dr. Anish Shah**: Managing Director & CEO.
- **Employees**: Approximately 68,414 as of 2024. citeturn0search6
**Business Segments**
M&M operates across multiple industries, including:
- **Automotive**: Manufactures a wide range of vehicles such as SUVs, multi-utility vehicles, pickups, light commercial vehicles, and heavy commercial vehicles. Notable models include the **Scorpio**, **Thar**, and **XUV700**. citeturn0search0
- **Farm Equipment**: Recognized as the world's largest tractor manufacturer by volume, M&M produces tractors and agricultural machinery under brands like **Mahindra Tractors** and **Swaraj Tractors**. citeturn0search0
- **Aerospace and Defense**: Engages in manufacturing aircraft components and providing defense solutions, including military vehicles and equipment. citeturn0search0
- **Information Technology**: Through subsidiaries like **Tech Mahindra**, offers IT services and consulting globally.
- **Financial Services**: Provides a range of financial products, including vehicle loans, insurance, and mutual funds, primarily through **Mahindra & Mahindra Financial Services Limited**.
- **Real Estate and Infrastructure**: Develops residential and commercial properties via **Mahindra Lifespace Developers Limited**.
- **Hospitality**: Operates vacation ownership and leisure hospitality services through **Mahindra Holidays and Resorts India Limited**.
**Global Presence**
M&M has a significant international footprint, exporting products to over 100 countries. The company has established subsidiaries and joint ventures worldwide, including:
- **Mahindra Automotive North America (MANA)**: Based in the USA, focusing on automotive design and engineering.
- **Automobili Pininfarina**: An Italian luxury electric vehicle manufacturer acquired by M&M.
- **SsangYong Motor Company**: A South Korean automobile manufacturer acquired by M&M in 2011. citeturn0search0
**Financial Performance**
As of 2024, M&M reported revenues of approximately **$16.8 billion**, marking a 14.1% increase compared to the previous year. citeturn0search2
**Sustainability Initiatives**
M&M is committed to environmental sustainability, with goals such as achieving **carbon neutrality by 2040**. The company actively engages in social initiatives, including **Project Nanhi Kali**, which has educated over 500,000 underprivileged girls in India. citeturn0search1
**Recent Developments**
- **Electric Vehicles (EVs)**: M&M is investing in electric mobility solutions, developing EV models and related technologies to cater to the growing demand for sustainable transportation.
- **Acquisitions and Partnerships**: The company continues to expand through strategic acquisitions and partnerships, enhancing its capabilities across various sectors.
For more detailed information, you can visit the official Mahindra & Mahindra website: (www.mahindra.com)
Is there a specific aspect of Mahindra & Mahindra you'd like to explore further?

M&M 1HRINTRADAY / SWING TRADE
- EARN WITH ME DAILY 10K-20K –
M&M Looking good for Downside..
When it break level 2594 and sustain.. it will go Downside...
SELL @ 2594
Target
1st 2572
2nd 2549
FNO
M&M MAR FUT – LOT 11 (Qty-1925)
M&M MAR 2750 PE – LOT 11 (Qty-1925)
Enjoy trading traders.. Keep add this STOCK in your watch list..
Big Investor are welcome..
Like this Post??? Hit like button..!!!
Follow me for FREE Educational Post and Alert..

view on Mahindra and mahindraStock name: Mahindra and Mahindra
current price: 2585
If it take support at 2500, it can retest 2650-2710 and may remain in 2700-2500 range.
below 2500 stock can see more fall to 2469-2300
If it breaks resistance above 2700, upside target would be 2850+

Mahindra & mahindraM&M itself focuses primarily on mobility products and farm solutions. It’s a titan in India’s automotive sector, renowned for rugged SUVs like the Scorpio, Thar, and XUV700, and holds a dominant position in utility vehicles with an 11.4% market share, competing with Tata Motors, Hyundai, Kia, and Maruti Suzuki.
Chart for your reference

Mahindra & Mahindra Ltd. (M&M) Stock Analysis### **Mahindra & Mahindra Ltd. (M&M) Stock Analysis**
---
#### **Fundamental Analysis:**
- **Company Overview:**
Mahindra & Mahindra Ltd. (M&M) is one of India's largest and most diversified conglomerates, with a strong presence in various industries including automotive, agriculture, aerospace, construction, energy, and finance. M&M is particularly well-known for its leadership in the Indian automotive market, especially in the segments of SUVs, tractors, and electric vehicles. The company’s focus is on innovation, sustainability, and providing solutions for rural and urban India.
- **Revenue & Profit Growth:**
- **Revenue Trends:** M&M has experienced steady revenue growth in recent years, driven by strong sales in its automotive and agricultural segments. The company's robust growth in its tractor and SUV divisions has helped offset slower growth in other sectors.
- **Profitability:** The company has been improving its profitability, with significant growth in operating profit margins due to operational efficiencies and strong demand for its vehicles, especially in rural India. The company has managed to report consistent growth in net profits, aided by its cost control measures and diversified revenue streams.
- **Valuation (as of Feb 2025):**
- **P/E Ratio:** 18.6 (this is relatively attractive for a company with a diversified business model and a leadership position in several key sectors)
- **Price-to-Book Ratio:** 2.2 (reflects a fair valuation based on the company's tangible assets, and market leadership in key segments)
- **Dividend Yield:** 1.5% (M&M has a stable dividend payout policy, though the dividend yield is on the lower side given its growth potential)
- **Key Ratios:**
- **Return on Equity (ROE):** 15.3% (a good indication of efficient use of shareholder capital)
- **Return on Assets (ROA):** 7.4% (reflecting solid asset management)
- **Debt-to-Equity Ratio:** 0.4 (low leverage, indicating a conservative approach to debt, which reduces financial risk)
- **Outlook:**
M&M is positioned well in the automotive sector with its strong portfolio in tractors, SUVs, and electric vehicles. The growing demand for EVs, especially in India, gives M&M a distinct advantage with its focus on sustainable mobility. The company is also expanding into new international markets. The agriculture and financial services sectors also offer significant growth potential. The company's diversified revenue base mitigates risks in any one sector, making it relatively stable.
---
#### **Technical Analysis:**
- **Current Price:** ₹1,500 (as of February 2025)
- **Chart Overview:**
M&M's stock has shown consistent growth over the last year, supported by strong fundamentals and increasing demand for its SUV and tractor models. The stock has seen a recent pullback, but the overall trend remains positive, as the company has been a leader in the SUV and tractor segments.
- **Support and Resistance Levels:**
- **Immediate Support:** ₹1,470 (a critical support level where the stock has bounced in recent times)
- **Next Major Support:** ₹1,400 (providing a strong cushion in case of a broader market correction)
- **Immediate Resistance:** ₹1,530 (recent highs, which could act as a barrier to further gains)
- **Next Major Resistance:** ₹1,600 (a psychological level, and also the previous all-time high)
- **Moving Averages:**
- **50-Day Moving Average (50-DMA):** ₹1,480 (indicating a neutral short-term trend)
- **200-Day Moving Average (200-DMA):** ₹1,400 (providing strong support, which aligns with the broader uptrend)
- **Relative Strength Index (RSI):**
- RSI is currently at 58, which indicates that the stock is neither overbought nor oversold, suggesting that there is still room for potential upside or further consolidation.
- **MACD:**
- The MACD is showing a bullish crossover, suggesting that positive momentum could continue. However, any significant rise in the stock could lead to an overbought condition, so it is important to watch for a potential correction.
---
#### **Key Metrics:**
- **Market Capitalization:** ₹2.2 trillion (approx.)
- **52-Week High:** ₹1,620
- **52-Week Low:** ₹1,100
---
#### **Risk Considerations:**
- **Commodity Price Fluctuations:** M&M is exposed to fluctuations in the prices of raw materials such as steel and aluminum, which are crucial for automotive manufacturing. A rise in these costs could impact profit margins.
- **Regulatory Risks:** Changes in government policies related to electric vehicles, agriculture, or taxes could impact M&M’s business. The shift towards EVs also comes with regulatory challenges, especially related to battery technology and charging infrastructure.
- **Competition:** The automotive sector is highly competitive, with both domestic and international players vying for market share. M&M faces significant competition in both the SUV and EV segments, and any aggressive moves by competitors could impact market share and profitability.
- **Geopolitical Risks:** M&M operates in various international markets, including the US, Europe, and several African countries. Geopolitical tensions, trade barriers, or economic slowdowns in these regions could negatively impact business performance.
---
### **Conclusion:**
Mahindra & Mahindra Ltd. (M&M) is a strong and diversified player in the Indian and global markets, with solid growth potential in both its automotive and agricultural divisions. The company's leadership in the tractor and SUV segments, combined with a strong focus on electric vehicles, positions it well for future growth. The stock has performed well, and its fundamental metrics are solid, with a low debt-to-equity ratio and strong profitability.
Technically, M&M is trading near key support levels around ₹1,470, with resistance around ₹1,530. A breakout above ₹1,530 could signal further upside potential. The stock has been consolidating in the short term, and while the RSI is not yet in overbought territory, investors should be mindful of potential risks, including commodity price fluctuations, regulatory changes, and competition in the automotive sector.
For long-term investors, M&M presents a solid opportunity, especially as the demand for electric vehicles and rural-focused solutions like tractors continue to grow. However, short-term volatility due to broader market movements and commodity price risks should be considered.
---
**Disclaimer:** This analysis is based on publicly available information, and I am not a SEBI-registered advisor. Please conduct your own research and consult a certified financial advisor before making any investment decisions. This is for informational purposes only and should not be considered as financial advice.

what is rsi and why it is important for trading ?**SkyTradingZone: Your Ultimate Guide to Trading Education**
# Understanding RSI (Relative Strength Index) and Its Importance in Trading
## What is RSI?
Relative Strength Index (RSI) is a momentum oscillator that measures the speed and change of price movements. It helps traders identify overbought and oversold conditions in the market and provides insights into potential trend reversals.
### RSI Formula:
RSI = 100 -
Where RS (Relative Strength) = Average gain over a period / Average loss over the same period
The standard period used for RSI is 14 days, but traders can adjust it based on their strategy.
## How to Interpret RSI?
- **Above 70:** Indicates overbought conditions; potential for price correction or reversal.
- **Below 30:** Indicates oversold conditions; potential for price bounce or uptrend.
- **Between 30-70:** Indicates a neutral zone where price is neither overbought nor oversold.
## Importance of RSI in Trading
1. **Identifying Overbought and Oversold Conditions:** RSI helps traders avoid entering trades at extreme price levels.
2. **Trend Confirmation:** RSI can confirm whether an existing trend is strong or losing momentum.
3. **Divergence Trading:** If price makes a new high but RSI doesn’t, it signals a potential reversal (bearish divergence). If price makes a new low but RSI doesn’t, it signals a potential uptrend (bullish divergence).
4. **Support and Resistance Validation:** RSI can help validate whether a support or resistance level is likely to hold.
## How to Use RSI Effectively?
- Combine RSI with other indicators like Moving Averages and Bollinger Bands for better accuracy.
- Look for RSI divergences to predict potential trend reversals.
- Use RSI along with candlestick patterns for precise entry and exit points.
- Adjust RSI periods for different trading styles (e.g., shorter periods for day trading, longer for swing trading).
## Conclusion
RSI is a powerful tool in technical analysis that helps traders understand market momentum and make informed decisions. When combined with other indicators, RSI can improve trading accuracy and risk management.
---
*Disclaimer: SkyTradingZone provides educational content only and does not offer financial or investment advice. We are not SEBI registered.*

Mahindra & Mahindra - Tough roads aheadLaunch timing of the 2 new EVs seems to have gone against them in the light of governments recent EV policy. Also, the investors doesn't seem to like their recent investment in the 2 subsidiaries.
What lies on the road ahead? The video tells.

Mahindra & Mahindra Date : 21.02.2025
Mahindra & Mahindra
Timeframe : Day Chart
Key Points :
Good profit growth of 121.66% for the Past 3 years.
Good revenue growth of 30.31% for the Past 3 years.
Has significantly decreased its debt by 3,058.84 Cr.
Maintaining healthy ROCE of 20.26% over the past 3 years.
Virtually debt free.
Healthy Interest coverage ratio of 53.72.
Company’s PEG ratio is 0.49.
Has an efficient Cash Conversion Cycle of -35.20 days.
Has a good cash flow management; CFO/PAT stands at 1.66
Current Impact :
1 Tesla entry in India amid huge expansion of M&M in EV segment is hurting sentiment
2 Tariff on imported EV slashed 100% to 15%
Regards,
Ankur

What is Trading psychology and why it is important ?**Trading psychology** refers to the emotional and mental state of a trader during their decision-making process in the financial markets. It plays a critical role in influencing trading outcomes because how a trader reacts to market movements—whether it's fear, greed, overconfidence, or impatience—can significantly affect their performance.
Here are key aspects of trading psychology and why it's important:
### 1. **Emotions**:
- Emotions like fear, greed, anxiety, or excitement can distort rational decision-making. For example, fear can cause a trader to sell too early, while greed may make them hold onto a position for too long, hoping for higher profits.
- Managing emotions helps maintain discipline, which is essential for sticking to a trading strategy.
### 2. **Risk Management**:
- Trading psychology affects how a trader handles risk. If they are overly emotional or impulsive, they might take on excessive risk without considering the long-term consequences. On the other hand, an overly risk-averse trader might miss profitable opportunities.
- Proper risk management involves setting stop losses, taking profits at appropriate levels, and understanding when to step back from the market.
### 3. **Discipline**:
- A disciplined trader follows a plan or system, even when it feels uncomfortable or uncertain. Emotions can push traders to abandon their strategies, but consistency is crucial for success in the long run.
- Sticking to a plan and not chasing after quick profits or reacting emotionally is vital to maintaining a steady approach.
### 4. **Patience and Impulsiveness**:
- Successful trading requires patience. Sometimes the best action is no action, waiting for the right opportunity. Impulsive decisions often result in losses or missed chances.
- Learning to wait for setups and sticking to the plan helps avoid mistakes driven by impatience or excitement.
### 5. **Overcoming Losses**:
- Losses are inevitable in trading. How a trader handles them mentally can determine their long-term success. Some traders might dwell on their losses or try to "revenge trade" to recover the money, leading to further losses.
- Developing mental resilience and learning from mistakes allows traders to stay calm and avoid making emotionally-driven decisions.
### 6. **Confidence vs. Overconfidence**:
- Confidence in one's strategy and decisions is essential for success. However, overconfidence can lead to risky behavior, ignoring warning signs, or not managing trades properly.
- Striking the right balance between confidence and caution is key for sustainable profitability.
### Why It's Important:
- **Consistency**: Traders with strong psychological control are more consistent. They stick to their trading plans, follow proper risk management, and can perform better over time.
- **Avoiding Emotional Mistakes**: By recognizing and controlling emotions, traders can reduce the likelihood of making impulsive or reactionary decisions.
- **Long-Term Success**: Trading is a marathon, not a sprint. Successful traders know how to manage their psychology for long-term profitability, rather than focusing on short-term gains.
- **Mental Clarity**: Good psychological control helps a trader remain clear-headed, which is crucial when market conditions are volatile or unpredictable.
In summary, trading psychology is a crucial element for success because it directly influences a trader's behavior and decision-making process. Mastering it can be just as important as mastering technical and fundamental analysis.

Manhindara & Mahindra strong down zoneNSE:M&M
mahindra & Mahindra break trendline
Disclaimer: This analysis is for educational purposes only.
Please assess your own risk tolerance and conslut with a financial advisor before trading.

M & M - Expecting reboundStock has nearly corrected itself between 10 to 12%
Now approaching an area which is a support in Daily / Weekly / Hourly as well
Expecting the fall to stop here for sometime go side ways before turning back up (depending upon the market situation)
Or may continue its journey downwards again
Lower TF confirmation (15 Mins) is compulsory to enter the trade
Downside final support can be accounted as 2850
If takes support it can easily go back up to 2955 - 3020
Volatility is High. Trade is against the trend, so trade cautiously
MAHINDRA & MAHINDRA - BEARISH PRICE ACTION AT RESISTANCE ZONESymbol - M&M
CMP - 3218
Mahindra & Mahindra Ltd. has been witnessing a recovery in recent weeks after facing a significant decline. The stock has shown strength by bouncing back from key support zones and is now encountering key resistance levels. However, it faces challenges at higher levels, and we are starting to see signs of consolidation & bearish price action as it tests these resistance zones.
The overall trend appears to be on a recovery path, following a steep drop. But at these higher levels, the stock faces resistance, suggesting a possible pause or consolidation before any significant movement in either direction.
In the short term, the trend is slightly bearish. The stock has encountered some selling pressure & is forming bearish candlesticks as it nears its resistance levels, and it's currently consolidating. In the long term, the trend remains positive, backed by the company’s strong fundamentals, especially in the automotive and farm equipment sectors.
Currently, the stock is trading within a range with visible selling pressure near a resistance zone, indicating a consolidation phase. My bias leans towards the downside in the short term, and we could see a pullback from the resistance level towards the support trendline, with the possibility of further declines.
For traders, the strategy could involve looking for short opportunities near the resistance zone, particularly if the stock fails to break out above this level and begins reversing. However, if the stock manages to break through the resistance and shows sustained momentum, the bias could shift to the upside, and long positions might be considered.
Disclaimer - Do not consider this as a buy/sell recommendation. I'm sharing my analysis. You can track it for educational purposes. Thanks!
