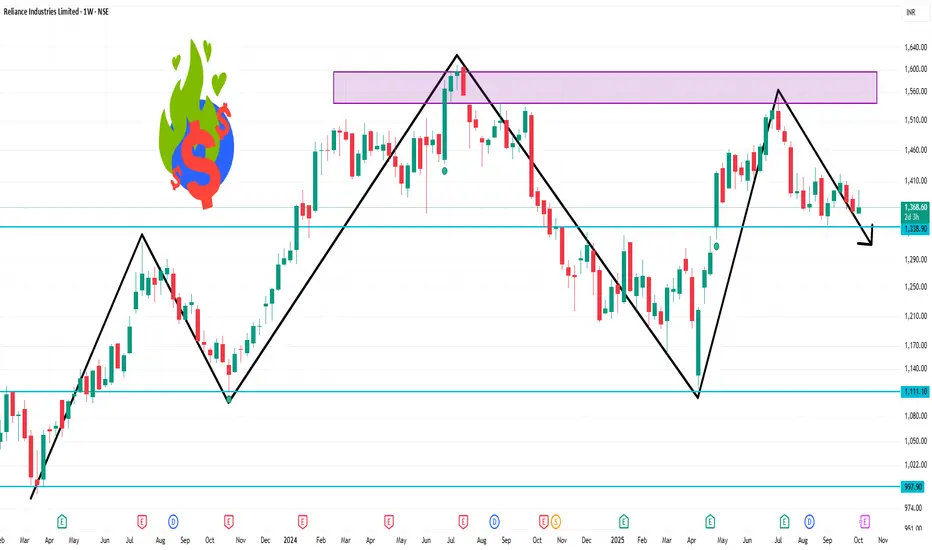
BUY RELIANCEONLY FOR EDUCATIONAL PURPOSE. Only For SWING. This post is meant for learning purposes only. Invest your capital at your own risk.
Next report date
—
Report period
—
EPS estimate
—
Revenue estimate
—
1.2 EUR
7.62 B EUR
105.27 B EUR
6.77 B
About Reliance Industries Limited
Sector
Industry
CEO
Mukesh Dhirubhai Ambani
Website
Headquarters
Mumbai
Founded
1957
ISIN
US7594701077
FIGI
BBG000BKVTY7
Reliance Industries Ltd. engages in hydrocarbon exploration and production, petroleum refining and marketing, petrochemicals, retail, and telecommunications. It operates through the following segments: Oil to Chemicals (O2C), Oil & Gas, Retail, Digital Services, Financial Services, and Others. The O2C segment includes refining, petrochemicals, fuel retailing through Reliance BP Mobility Limited, aviation fuel and bulk wholesale marketing. The Oil and Gas segment engages in the exploration, development and production of crude oil and natural gas. The Retail segment includes consumer retail and range of related services. The Digital Services segment includes provision of a range of digital services. The Financial Services segment comprises of management and deployment of identified resources of the firm to various activities including non-banking financial services and insurance broking. The Others segment engages in Media, SEZ development, and textile business. The company was founded by Dhirubhai Hirachand Ambani in 1957 and is headquartered in Mumbai, India.
Related stocks

How to trade in the Right Trend - Beginners guide
How to Identify a Trend in a Chart?
Here's a practical breakdown of trend identification methods:
1. Price Structure Method (Most Fundamental)
Uptrend:
- Series of Higher Highs (HH) and Higher Lows (HL)
- Each peak is higher than the previous peak
- Each trough is higher than the previous tro
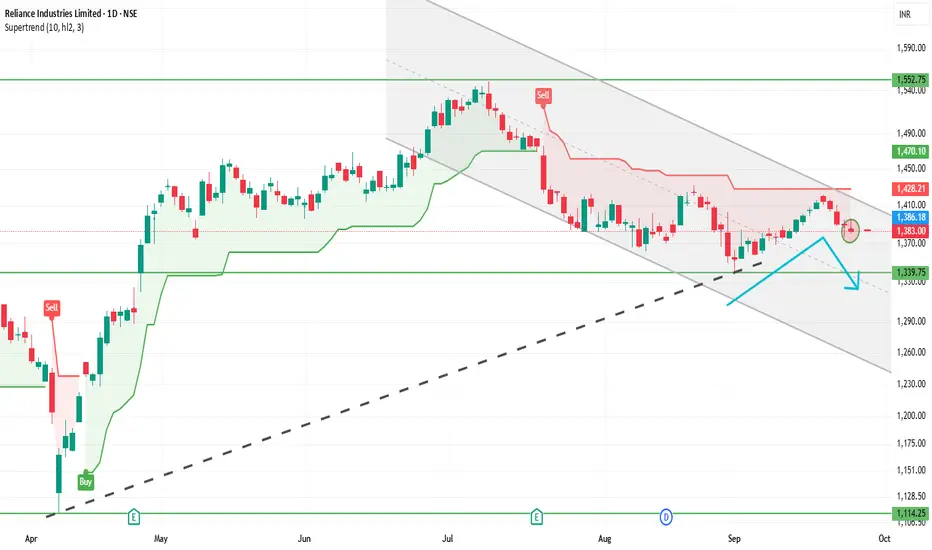
RELIANCE 1D Time frame📊 Reliance Daily (1D) Snapshot
Close: Around ₹1,382
Range of the Day: High near ₹1,396, Low near ₹1,380
Trend: Slight weakness on daily chart (mild red candle)
Stock is consolidating between support and resistance zones.
🎯 Key Daily Levels
Support Zone: ₹1,350 – ₹1,365
Strong Support: ₹1,330
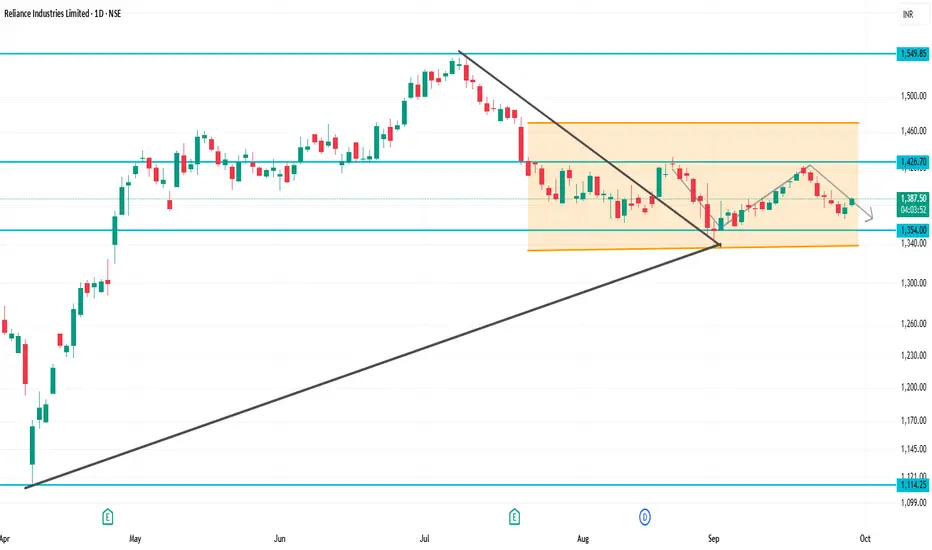
RELIANCE 1D Time frameCurrent Market Snapshot
Current Price: ₹1,383.30
Opening Price: ₹1,381.60
Day’s Range: ₹1,379.00 – ₹1,386.90
Previous Close: ₹1,377.60
🔑 Technical Indicators
Relative Strength Index (RSI): 49.76 – indicating a neutral condition.
Moving Average Convergence Divergence (MACD): -3.20 – suggesting
Part 12 Trading Master Class With ExpertsI. Introduction to Options
What is an Option?
An option is a financial derivative contract that gives the buyer the right, but not the obligation, to buy or sell an underlying asset at a predetermined price (strike price) within a specified time period. Options derive their value from the underlyi

PCR Trading StrategiesPart 1: Introduction to Options
Options are a type of derivative instrument that derive their value from an underlying asset like stocks, indices, commodities, or currencies. Unlike buying the asset itself, options give you the right—but not the obligation—to buy or sell the asset at a predetermine

Energy Trading and Geopolitics1. The Fundamentals of Energy Trading
Energy trading involves buying and selling energy commodities such as oil, natural gas, coal, electricity, and increasingly renewable energy credits. Markets for these commodities can be physical (spot markets) or financial (futures, options, and derivatives).
Part 7 Trading Master Class1. Risk Management in Options Trading
Risk is both the biggest appeal and the biggest danger in options trading. Without proper risk management, traders can face massive losses.
Key practices include:
Position Sizing: Never risking more than a small percentage of capital on a single trade.
Stop-

How AI is Transforming Financial Markets1. Introduction
Financial markets have traditionally relied on human expertise, intuition, and historical data analysis to make decisions. While these methods have served well, they are often limited by human cognitive biases, data processing constraints, and the speed at which information is absor

RELIANCE 1 Week Time Frame 📊 Weekly Technical Outlook
Overall Trend: The prevailing trend is bearish, with a "Strong Sell" signal on the weekly timeframe.
Moving Averages: All key moving averages—5-day, 10-day, 20-day, 50-day, 100-day, and 200-day—are indicating a "Sell" signal.
Relative Strength Index (RSI): The RSI is at 4
See all ideas
An aggregate view of professional's ratings.
Neutral
SellBuy
Strong sellStrong buy
Strong sellSellNeutralBuyStrong buy
Neutral
SellBuy
Strong sellStrong buy
Strong sellSellNeutralBuyStrong buy
Neutral
SellBuy
Strong sellStrong buy
Strong sellSellNeutralBuyStrong buy
Displays a symbol's price movements over previous years to identify recurring trends.
RLNGF5335118
Reliance Industries Limited 3.75% 12-JAN-2062Yield to maturity
5.50%
Maturity date
Jan 12, 2062
RLNGF5335117
Reliance Industries Limited 3.625% 12-JAN-2052Yield to maturity
5.45%
Maturity date
Jan 12, 2052
RLNGF4208883
Reliance Industries Limited 4.875% 10-FEB-2045Yield to maturity
5.29%
Maturity date
Feb 10, 2045
RLNGF5059438
Reliance Industries Limited 6.25% 19-OCT-2040Yield to maturity
5.24%
Maturity date
Oct 19, 2040
RLNGF5335116
Reliance Industries Limited 2.875% 12-JAN-2032Yield to maturity
4.58%
Maturity date
Jan 12, 2032
RLNGF4567942
Reliance Industries Limited 3.667% 30-NOV-2027Yield to maturity
4.25%
Maturity date
Nov 30, 2027
J
640JUPPL29
Jamnagar Utilities & Power Pvt Ltd. 6.4% 29-SEP-2026Yield to maturity
—
Maturity date
Sep 29, 2026
See all RLI bonds
Curated watchlists where RLI is featured.

Downstream oil: Petroleum through the pipes
39 No. of Symbols

Indian stocks: Racing ahead
46 No. of Symbols

See all sparks