Part 12 Trading Master Class With ExpertsRisk in Option Trading
Although options can be powerful, they carry risks:
1. For Option Buyers
Premium can become zero if market doesn’t move as expected.
Time decay works against buyers.
2. For Option Sellers
Potentially unlimited loss in selling naked calls or puts.
Require higher capital
1.4 EUR
6.56 B EUR
89.84 B EUR
About Tesla, Inc.
Sector
Industry
CEO
Elon Reeve Musk
Website
Headquarters
Austin
Founded
2003
Identifiers
3
ISIN:CA88162R1091
Tesla, Inc. engages in the design, development, manufacture, and sale of electric vehicles and energy generation and storage systems. It operates through the Automotive and Energy Generation and Storage segments. The Automotive segment includes the design, development, manufacture, sale, and lease of electric vehicles as well as sales of automotive regulatory credits. The Energy Generation and Storage segment is involved in the design, manufacture, installation, sale, and lease of solar energy generation, energy storage products, and related services and sales of solar energy systems incentives. The company was founded by Jeffrey B. Straubel, Elon Reeve Musk, Martin Eberhard, and Marc Tarpenning on July 1, 2003 and is headquartered in Austin, TX.
Related stocks

Part 1 Ride The Big Moves What is an Option?
An option is a financial derivative whose value is derived from an underlying asset such as a stock, index, or commodity. Options come in two primary forms:
Call Option: It gives the holder the right to buy the underlying asset at a predetermined price (known as the strike price

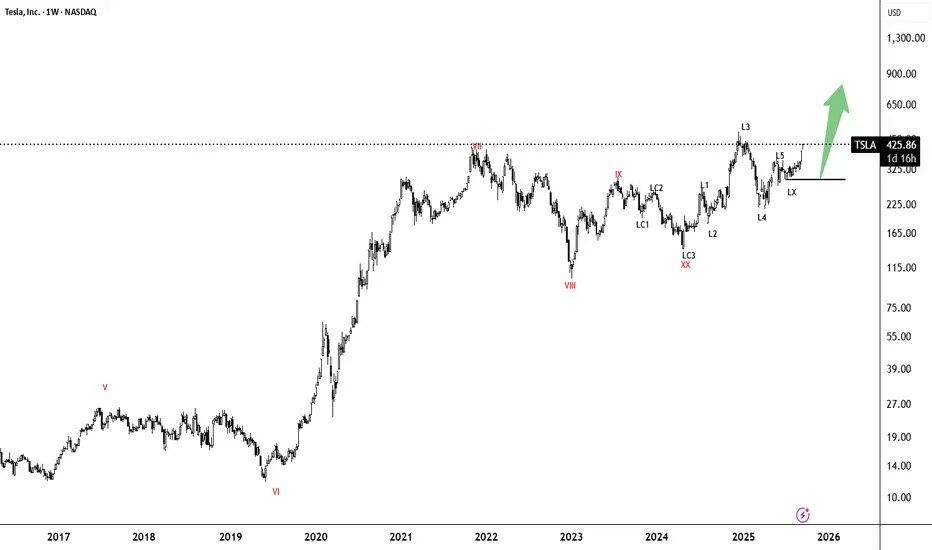
Tesla’s Technical Outlook and Future Possibilities Tesla’s Technical Outlook and Future Possibilities
Tesla’s current price action reflects a phase of consolidation after a strong rally, where traders are carefully observing how the stock reacts near crucial levels.
The stock’s position around $439 indicates indecision between bu

Part 12 Trading Masster ClassOption Trading in India
In India, options are traded on exchanges like the NSE (National Stock Exchange) and BSE (Bombay Stock Exchange). The most active instruments include NIFTY, BANKNIFTY, and FINNIFTY indices, as well as popular stocks like Reliance, TCS, and HDFC Bank.
Indian traders have acc

Part 2 Intraday Master ClassKey Concepts and Terminology
Before understanding how option trading works, it’s important to grasp some basic terms:
Call Option: Gives the holder the right to buy an asset at a specific price (called the strike price) before a set date.
Put Option: Gives the holder the right to sell an asset at

TESLA Bullish Wave CyclesHi everyone
Welcome to intelligent investor, we provide market insights by synchronising and combining all the price action waves from different time frames and gives you single trend.
If you see different keyword in charts, here is the meaning and an explaining video will be made in some time how
Part 2 Master Candle Stick PatternWhy Trade Options?
Options can be used for different purposes:
Speculation – Traders predict whether prices will rise or fall and buy options to profit from that movement.
Hedging – Investors use options to protect their portfolios from potential losses, like insurance for their investments.
Inc

Part 1 Ride The Big Moves American vs. European Options
Options can be American-style or European-style. American options can be exercised any time before expiry, while European options can be exercised only on the expiry date. In India, stock options are American, while index options are European.
In-the-Money, At-the-Mon

3 Common Trading Mistakes Traders Should AvoidTraders of all levels, from beginners to experienced professionals, can fall prey to psychological mistakes that can lead to poor trading decisions and ultimately, losses. Understanding and avoiding these common mistakes is crucial for developing a sound trading strategy and achieving consistent suc

Part 12 Trading Master Class With Experts Common Option Trading Strategies
Options can be combined in different ways to create strategies with defined risk and reward profiles.
Some popular strategies include:
Covered Call – Holding a stock and selling a call option on it (income strategy).
Protective Put – Holding a stock and buying a p

See all ideas
Displays a symbol's price movements over previous years to identify recurring trends.
TSLA4317805
Tesla Energy Operations, Inc. 5.45% 17-DEC-2030Yield to maturity
10.02%
Maturity date
Dec 17, 2030
TSLA4296328
Tesla Energy Operations, Inc. 5.45% 16-OCT-2030Yield to maturity
9.28%
Maturity date
Oct 16, 2030
TSLA4290558
Tesla Energy Operations, Inc. 5.45% 01-OCT-2030Yield to maturity
8.99%
Maturity date
Oct 1, 2030
TSLA4324758
Tesla Energy Operations, Inc. 4.7% 14-JAN-2026Yield to maturity
8.00%
Maturity date
Jan 14, 2026
TSLA4286421
Tesla Energy Operations, Inc. 5.45% 17-SEP-2030Yield to maturity
7.89%
Maturity date
Sep 17, 2030
TSLA4231716
Tesla Energy Operations, Inc. 5.45% 23-APR-2030Yield to maturity
7.60%
Maturity date
Apr 23, 2030
TSLA4250220
Tesla Energy Operations, Inc. 5.45% 29-MAY-2030Yield to maturity
7.40%
Maturity date
May 29, 2030
TSLA4313161
Tesla Energy Operations, Inc. 5.45% 03-DEC-2030Yield to maturity
7.15%
Maturity date
Dec 3, 2030
TSLA4260133
Tesla Energy Operations, Inc. 5.45% 25-JUN-2030Yield to maturity
7.02%
Maturity date
Jun 25, 2030
TSLA4247202
Tesla Energy Operations, Inc. 5.45% 21-MAY-2030Yield to maturity
6.97%
Maturity date
May 21, 2030
TSLA4224815
Tesla Energy Operations, Inc. 5.45% 26-MAR-2030Yield to maturity
6.78%
Maturity date
Mar 26, 2030
See all TL01 bonds
Curated watchlists where TL01 is featured.


Frequently Asked Questions
Depending on the exchange, the stock ticker may vary. For instance, on FWB exchange Tesla, Inc. Shs Canadian Depositary Receipt Repr Shs Reg S stocks are traded under the ticker TL01.
TL01 reached its all-time high on Dec 17, 2024 with the price of 29.6 EUR, and its all-time low was 1.7 EUR and was reached on Apr 30, 2009. View more price dynamics on TL01 chart.
See other stocks reaching their highest and lowest prices.
See other stocks reaching their highest and lowest prices.
Yes, you can track Tesla, Inc. Shs Canadian Depositary Receipt Repr Shs Reg S financials in yearly and quarterly reports right on TradingView.
TL01 net income for the last quarter is 1.16 B EUR, while the quarter before that showed 1.01 B EUR of net income which accounts for 14.42% change. Track more Tesla, Inc. Shs Canadian Depositary Receipt Repr Shs Reg S financial stats to get the full picture.
No, TL01 doesn't pay any dividends to its shareholders. But don't worry, we've prepared a list of high-dividend stocks for you.
As of Dec 12, 2025, the company has 125.67 K employees. See our rating of the largest employees — is Tesla, Inc. Shs Canadian Depositary Receipt Repr Shs Reg S on this list?
EBITDA measures a company's operating performance, its growth signifies an improvement in the efficiency of a company. Tesla, Inc. Shs Canadian Depositary Receipt Repr Shs Reg S EBITDA is 9.28 B EUR, and current EBITDA margin is 13.44%. See more stats in Tesla, Inc. Shs Canadian Depositary Receipt Repr Shs Reg S financial statements.
Like other stocks, TL01 shares are traded on stock exchanges, e.g. Nasdaq, Nyse, Euronext, and the easiest way to buy them is through an online stock broker. To do this, you need to open an account and follow a broker's procedures, then start trading. You can trade Tesla, Inc. Shs Canadian Depositary Receipt Repr Shs Reg S stock right from TradingView charts — choose your broker and connect to your account.