DOW JONES suggest strength in Global markets for next few days.DOW JONES suggest strength in Global markets for next few days.
LTP - 50000
Targets - 52000+ suggesting 4% upside.
Timeframe - 10-15 trading sessions.
US30 index has shown breakout for last 15 days high suggesting strength in markets for next few days making new highs possible.
This suggest str

DOW Jones looking for 3-5% correction in next 5-8 daysDOW Jones looking for 3-5% correction in next 5-8 days.
Dow Jones is looking to correct further & this may create panic in global markets too.
Be Cautious.

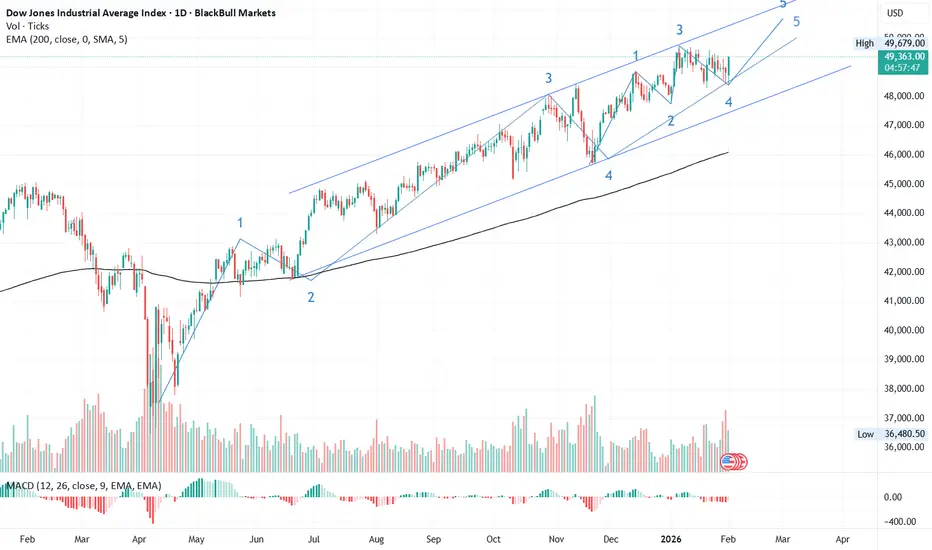
#DJI📊 DJI Technical Outlook – Entering the Final Leg of Its Impulsive Cycle
The Dow Jones Industrial Average (DJI) began a new impulsive cycle in April 2025, marking its 1st wave on 20 May 2025.
• The 2nd wave unfolded as a flat correction with a C-wave failure, ending at 41,835.
• The 3rd wave, the s
Where DJIA is heading?In my opinion DJIA is heading north till 53k,
as i have shown in the charts and before 53K it won't give any meaning ful correction also
i believe DJIA won't be retract by 2% before reaching to 53K.
#MAGA
#HeadingNorth

DowJones (DJI) IntraSwing Levels for 10th-11th Feb 2026(2:30 am)DowJones (DJI) IntraSwing Levels for 10th-11th Feb 2026 (2:30 am)
━━━━━━━━━₹₹₹₹₹₹₹₹₹₹₹₹━━━━━━━━
💥Level Interpretation / description:
L#1: If the candle crossed & stays above the “Buy Gen”, it is treated / considered as Bullish bias.
L#2: Possibility / Probability of REVERSAL near RLB#1 & UBTg

DowJones (DJI) IntraSwing Levels for 09th-10th Feb 2026 (2:30 amDowJones (DJI) IntraSwing Levels for 09th-10th Feb 2026 (2:30 am)
━━━━━━━━━₹₹₹₹₹₹₹₹₹₹₹₹━━━━━━━━
💥Level Interpretation / description:
L#1: If the candle crossed & stays above the “Buy Gen”, it is treated / considered as Bullish bias.
L#2: Possibility / Probability of REVERSAL near RLB#1 & UBTg

DowJones (DJI) IntraSwing Levels for 02nd-03rd Feb 2026 (2:30 amDowJones (DJI) IntraSwing Levels for 02nd-03rd Feb 2026 (2:30 am)
━━━━━━━━━₹₹₹₹₹₹₹₹₹₹₹₹━━━━━━━━
💥Level Interpretation / description:
L#1: If the candle crossed & stays above the “Buy Gen”, it is treated / considered as Bullish bias.
L#2: Possibility / Probability of REVERSAL near RLB#1 & UBTg

Will History Repeat Itself? A Warning from the Dow-Gold RatioRecently, the newly nominated candidate for the Fed chair, Kevin Warsh, talked about an upcoming global economic & financial shift, and it was shocking to hear from him because people at position like his never say such stuff unless it's already underway.
He said "we're entering a new economic syst

DowJones (DJI) IntraSwing Levels for 30th-31st Jan 2026 (2:30 amDowJones (DJI) IntraSwing Levels for 30th-31st Jan 2026 (2:30 am)
━━━━━━━━━₹₹₹₹₹₹₹₹₹₹₹₹━━━━━━━━
💥Level Interpretation / description:
L#1: If the candle crossed & stays above the “Buy Gen”, it is treated / considered as Bullish bias.
L#2: Possibility / Probability of REVERSAL near RLB#1 & UBTg

US30 buy setupThere is only one zone near US30 from where it can be bought, you can take a good trade by taking confirmation in LTF timeframe.

See all ideas
Displays a symbol's value movements over previous years to identify recurring trends.
Frequently Asked Questions
Dow Jones Industrial Average Index reached its highest quote on Jan 13, 2026 — 49,688.56 USD. See more data on the Dow Jones Industrial Average Index chart.
The lowest ever quote of Dow Jones Industrial Average Index is 579.94 USD. It was reached on Dec 10, 1974. See more data on the Dow Jones Industrial Average Index chart.
Dow Jones Industrial Average Index is just a number that lets you track performance of the instruments comprising the index, so you can't invest in it directly. But you can buy Dow Jones Industrial Average Index futures or funds or invest in its components.