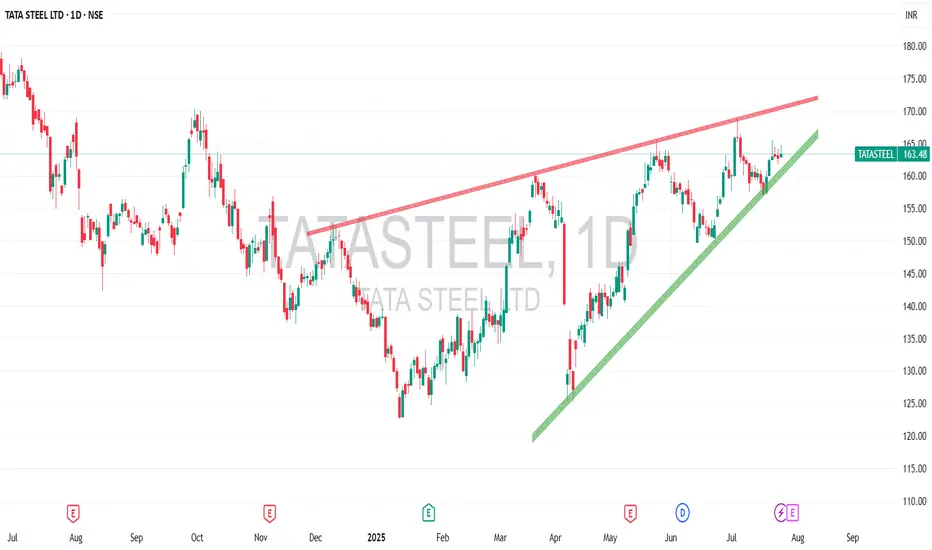
Tata Steel: Bounce Back After Correction from ₹120 Ceiling🔍 Technical Analysis
In June 2024, Tata Steel hit an all-time high of ₹185 but later corrected, bottoming near ₹120 in January 2025.
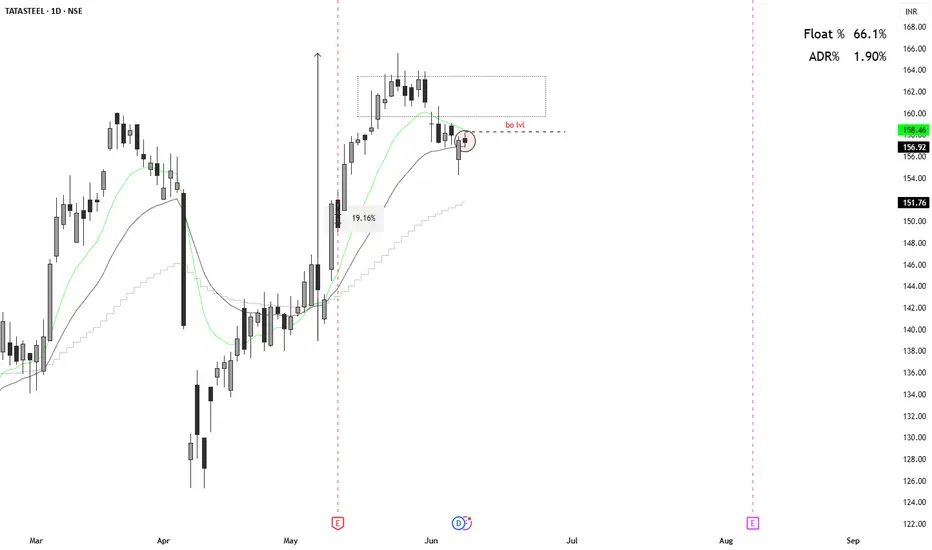
The stock has since formed a higher-high, higher-low structure and currently trades around ₹162.
If the pattern sustains, the next upside targets are:
🎯 Target 1:
Next report date
≈
November 5
Report period
Q2 2025
EPS estimate
0.31 EUR
Revenue estimate
—
0.36 EUR
373.99 M EUR
23.90 B EUR
About TATA STEEL LTD
Sector
Industry
CEO
Thachat Viswanath Narendran
Website
Headquarters
Mumbai
Founded
1907
FIGI
BBG00FGX37Q9
Tata Steel Ltd. is a holding company, which engages in the manufacture of iron and steel products. It operates through the following segments: Agriculture, Automotive Steels, Construction, Consumer Goods, Energy and Power, Engineering and Material Handling. Its products include Automotive Steels, Galvano, Tata Agrico, Astrum, Bearings, Pipes, Precision Tubes, Shaktee, Steelium, Tiscon and Wiron. The company was founded on August 26, 1907 and is headquartered in Mumbai, India.
0.6%
1.5%
2.4%
3.3%
4.2%
Q1 '24
Q2 '24
Q3 '24
Q4 '24
Q1 '25
0.00
1.60 B
3.20 B
4.80 B
6.40 B
Revenue
Net income
Net margin %
Revenue
COGS
Gross profit
Op expenses
Op income
Non-Op income/ expenses
Taxes & Other
Net income
0.00
1.50 B
3.00 B
4.50 B
6.00 B
Revenue
COGS
Gross profit
Expenses & adjustments
Net income
0.00
1.50 B
3.00 B
4.50 B
6.00 B
Q1 '24
Q2 '24
Q3 '24
Q4 '24
Q1 '25
0.00
3.00 B
6.00 B
9.00 B
12.00 B
Debt
Free cash flow
Cash & equivalents
No news here
Looks like there's nothing to report right now

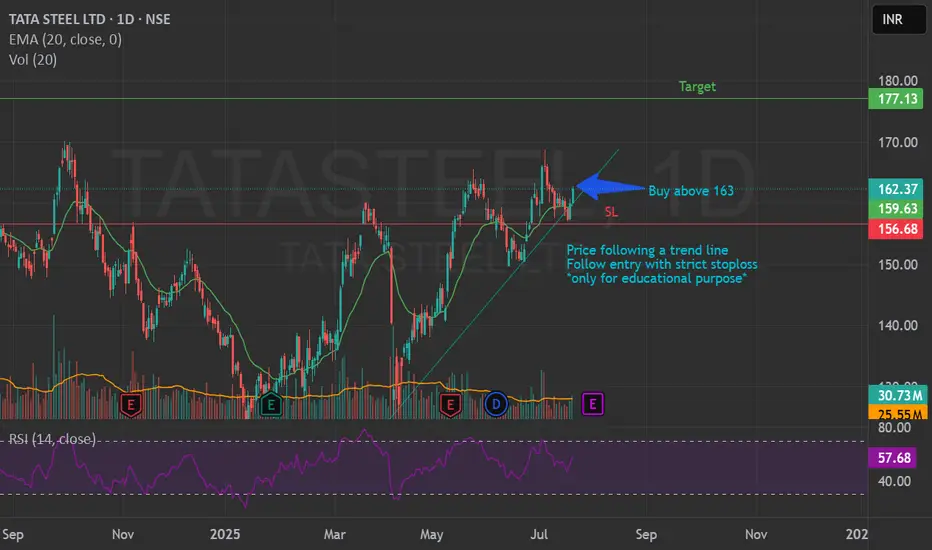
Tata Steel: Bounce Back After Correction from ₹120 Ceiling🔍Technical Analysis
In June 2024, Tata Steel hit an all-time high of ₹185 but later corrected, bottoming near ₹120 in January 2025.
The stock has since formed a higher-high, higher-low structure and currently trades around ₹162.
If the pattern sustains, the next upside targets are:
🎯Target 1:
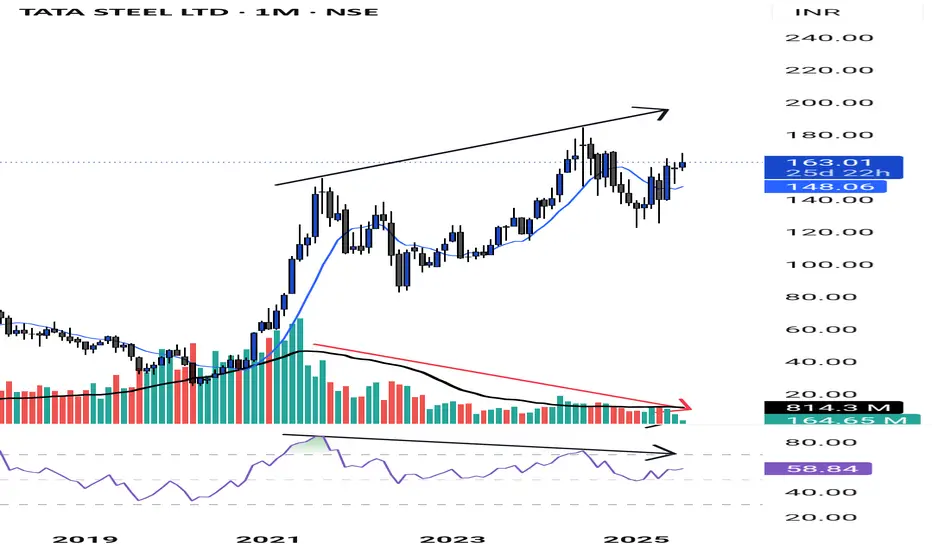
Swing Trading - Stock Options Buying Strategy Part 3📊 Tata Steel Monthly Chart Analysis
Indicators: RSI Divergence, Volume Contraction, and Market Structure
In the monthly chart of Tata Steel, we can observe some crucial technical signals that traders should pay attention to:
🔻 1. Volume Contraction
The volumes are gradually contracting, indicating
TATA STEEL | Time for Metals to ShineIt has been consolidating in triangle pattern since very long and it's on the verge of breakout. Metals have cyclical nature and CNXMETAL is also forming good pattern for breakout so seems like it is time for metals to shine. Ensure that volume is more than median during time for breakout to avoid f


Option Trading with Option chain part -3Example of an Option. Suppose that Microsoft (MFST) shares trade at $108 per share and you believe they will increase in value. You decide to buy a call option to benefit from an increase in the stock's price. You purchase one call option with a strike price of $115 for one month in the future for 3

See all ideas
An aggregate view of professional's ratings.
Neutral
SellBuy
Strong sellStrong buy
Strong sellSellNeutralBuyStrong buy
Neutral
SellBuy
Strong sellStrong buy
Strong sellSellNeutralBuyStrong buy
Neutral
SellBuy
Strong sellStrong buy
Strong sellSellNeutralBuyStrong buy
Displays a symbol's price movements over previous years to identify recurring trends.
A
TAEL4599346
ABJA Investment Co. Pte Ltd. 5.45% 24-JAN-2028Yield to maturity
5.03%
Maturity date
Jan 24, 2028
815TSL26
TSL-8.15%-4-10-26-PVTYield to maturity
4.63%
Maturity date
Oct 1, 2026
776TSL32
TSL-7.76%-20-9-32-PVTYield to maturity
—
Maturity date
Sep 20, 2032
750TSL27
TSL-7.50%-20-9-27-PVTYield to maturity
—
Maturity date
Sep 20, 2027
803TSL28
TSL-8.03%-25-2-28-PVTYield to maturity
—
Maturity date
Feb 25, 2028
98359TSL34
TSL-9.8359%-1-3-34-PVTYield to maturity
—
Maturity date
Mar 1, 2034
779TSL27
TSL-7.79%-27-3-27-PVTYield to maturity
—
Maturity date
Mar 27, 2027
765TSL30
TSL-7.65%-21-2-30-PVTYield to maturity
—
Maturity date
Feb 21, 2030
See all HWHG bonds