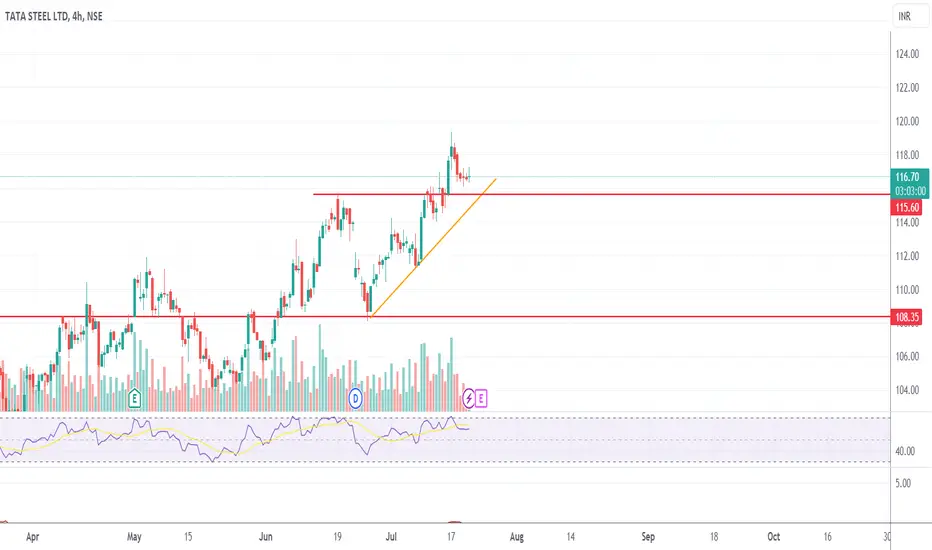
LONG
Fundamentally good stock
Undervalued
Currently taking support at 109.40
tARGET 120
WATCHOUT for the trendline Breakout for further Up-side movement
EDUCATIONAL PURPOSE ONLY!!!!!
HWHG trade ideas


TATASTEEEL Weekly Chart Tringle Break OutTatasteel has formed a triangle pattern and in consolidation since August 2021 as seen in this weekly chart. Move up to 129,136 Support 110-112

TATASTEEL - (BREAKOUT AND RETEST)buy tata steel at current levels of Rs. 115-118
The logic behind the trade:
• tata steel was forming a triangle pattern which is visible in the chart attached below. the structure started to form in mid-august of 2021. (Reason - increase in coal price and increase in taxes)
• Since then, the stock formed lower highs and lower lows (bearish trend) on a higher time frame which is weekly.
• In the previous week the stock broke out from the resistance levels provided by the triangle pattern and retested them this week (note - now the resistance levels will act as support levels).
• Volumes were also higher the previous week as compared to this week.
• Also, the coal prices are decreasing now, and the taxes were also removed a while ago which will ultimately result in a margin growth that will go in hand with increasing demand.

TATASTEEL TATASTEEL is going to bullish
ENTRY : 119
*TARGET 1 : 132
*TARGET 2 : 147
*TARGET 3 : 162
STOP LOSS : 100

Long wie on tata steelGreat company with great fundamental, here is possible to go 165 within year and sl will be 99

weekly trendline breakout Weekly trendline breakout and forming head and shoulder like pattern 1:4 Target

#TATASTEELTATASTEEL forms multiple levels of No Overlaps
The strcuture is highly Bullish
Simple wave navigation to reach the top

Ready to hold it for too long 😉Once TATA STEEL break the long term resistance zone then its going to boom in terms of
favourlable news . Do your own research and invest in Stock Market which are subjected to financial risk .

TataSteel to watch for!!Tatasteel has formed a triangle pattern and in consolidation since August 2021 as seen in this weekly chart. This pattern has a huge potential for a superb breakout so the tgts would be 127 , 150. The ADX and MACD are also supporting the view so a buy with SL below 104 on weekly closing would be a great 1:3 ratio.

TATA STEEL HARMONIC PATTERN ABCD bullish Tata Steel in continuation of Bullish Pattern ABCD with Tgt near 137-140 and SL below 105
1. Harmonic ABCD on weekly chart
2. RSI on all time frames M/W/D bullish abv 60
buy on dips for positional tgt 129-137

Tata Steel - Extended Flag & Pole along with Triangle formationMetals to lead the Rally
Buy Tata Steel @ 115
SL 85
Target : 175-250

Ascending triangle breakoutNot a clean chart but looks good to go up, lets see how it goes.
Just a learning phase
TATA Steel - Long-term opportunity
Based on the Chart - after months of consolidation - Tatasteel crossed the trendline and looks like sustained the move.
Also from indicators perspective - Daily RSI > Weekly > Monthly.
Currently trading above Daily, Weekly, Monthly 20-SMA, and 50-SMA.
Also above Weekly, Monthly Pivots and above VWMA on Weekly charts.
It crossed CCI 100 on Daily and Weekly charts.
If we look at Monthly and Weekly time frames:
Comparing CNXMETAL/CNX500 with Tata steel
On Weekly Time frame :
Crossing CCI above 100 after consolidation in the past couple of months
Considering NIFTY all-time High & possible slight correction in the near time frame -- start will small quantity in TATASteel -- and 112 should be stop loss. And above 119 and 124 -- we can add more quantity.
Please spend time and do your own research before taking a decision.

TATA STEEL | Swing Trade | Bullish MomentumTATA STEEL | Swing Trade | Bullish Momentum
A good triangle pattern breakout

TATASTEELReady for an up move with slight retest left around 116/114
Targets looks good for 8-10%
Thank you

TATA STEEL TRADE 50% CLOSEDTata Steel today reached 1st target and retraced.
As afler long consolidation it had broken.out @115 its should reach 125. Now SL is 114.

Weekly breakout Stock has given breakout of resistance line on weekly TF.
Next level to watch 125/135/150+

Tata steel going reach new high 💰Just hit boost 🚀 button and follow me 😉
Soon going keep detailed article ☺️

Triangle break out in Tata Steel 17/07/23.Tata steel is taking resistance from a trend line after forming a ATH in 2021 and the resistance line has been tested 4-5 time and finally it is near a break out.
The stock took support from 20 ema on the weekly charts and has formed 'W' pattern.
As the markets are trading and forming new highs. Stocks will also follow the same. Watch the metal sector move and the stock too.
Metal sector is trading around 21400 levels giving 3.25% or 680 points move in a week.
The index and stock both are in green and if the sector remains bullish the stock can give good bullish targets.
On daily time frame, there is a triangle break out and a bullish moving average cross over.
Entry :- Above 117.5
Targets :- 124, 130
Let the stock cross and start trading above the entry level. Long term investors can accumulate the stock for 15-20% return.
Positional stock positions can be initiated and option traders can form a hegde in August series and trail there stop losses.
Swing positions for a 5% move can be initiated as probability of bullish move is there in the stock.
Wait for the price action near the levels before entering.

Tata SteelWeekly pole and flag breakout. Consolidating since long, metal sector seems good for next 1-2 years due to infrastructure boom. Keep hold. May see 150 levels shortly.


