Uptrend Metal Stock_Tata Steel
Currently Tatasteel trading around 178, Stock closed for the week with Technical Confirmation.
Bullish 📌 Bar at uptrend with respecting 20 EMA in weekly Timeframe.
Go long in Equity with Current Stoploss of 147 and Wait for Pullback in daily timeframe to trade in F&O.
HWHG trade ideas

TATA STEEL Day chart ( for accumulation)Tata Steel as per the Day chart can be considered for Accumulation.
It is for investment and not for trading purpose.

TATASTEEL, Technical OutlookThe price is in a strong down trend. Today's candle has changed the character of price.
The next important level to consider is 162.30 and if broken then the price could test the levels of 158. Also the degree and nature of separation in both bands indicates the price is entering in the compression zone.
Disclaimer : This is my pre market analysis and my trading journal. Not a suggestion to buy or sell.

TATA STEELShort at 175.
Target 166-67.
SL 178 hourly basis
Risky trade as results to be declared today.

TATA STEEL - BUY TREND - BUT....Tata steel is in buy trend. It breakout the resistance at 167.5. The price didn't retest at this level. So wait for retracement. If trend reversal occurs after retracement we can go for buy. The target will be 210. Stop-loss should be put below 165. Risk reward ratio is 3

TATA STEEL FOR LONGMy view on this script is bullish
Ofter strong rally its on consolidation and makes wedge pattern .
Strong Breakout with Retest with Volume

failed breakout in tata steelEnter in opposite direction, whenever Price breaks horizontal level and Retraces in 1_2 Candles.
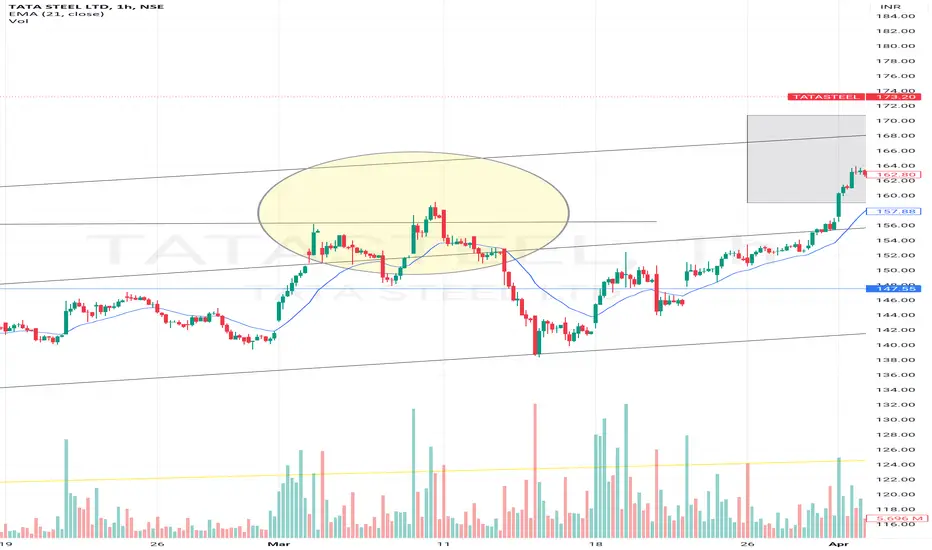
Huge loss in Tata steelTook trade in Tata Steel at yellow point, breakout of horizontal line , but it came back.
Never take trade Just after breakout, Wait for price to Reach the trendline
or take trade in Opposite direction of breakout.

Huge loss in Tata steelTook trade in Tata Steel at yellow point, breakout of horizontal line , but it came back.
Never take trade Just after breakout, Wait for price to Reach the trendline
or take trade in Opposite direction of breakout.

TATASTEEL ASCENDING TRIANGLE BREAKOUTTatasteel breaking ascending triangle
with good volume and rsi
macd crossover
#swingtrading
#target178
EDUCATIONAL IDEA

momentum breakoutstock has gained the momentum would give 15 percent upside momentum in coming days.
SL should be below breakout candle or any day candle closing below 10EMA

tata steel going to falltata steel at the resistance of 167.60.resistance broken bulls are trapped.now going to fall

Ready for Breakdown Tatasteel showing some bearishness .
Ofternoon breakdown I plan for go short on this script...🏁

Tata steel LTD Analyasis on 03 mar 24Tata Steel LTD Analyasis on 03 mar 24
Breakout of Rounding bottom formation
breakout of all time high after Aug 2021
add 25% now
add more quantity after breakout retest @ 140-145
Keep stoploss 130 (on closing basis)
target 160 - 170 -180
rounding bottom target 200

TATASTEEL
The stock moved past its prior all time high of 153.
The Monthly RSI has bounced from its bull phase support level of 47-55 zone, Monthly MACD is also positive.
If the scrip is to repeat its past price behavior, it becomes a good investment option with target around 335.
Bullish outlook remains intact as long as price is above 150.

Tata Steel capped upsideAs the Momentum indicator suggest that momentum is capped now. And it has a book value of 82/- which is like 50% less than the current price. Usually steel shares trade near book value. The fundamentals are opposite to the movement of stock currently. Wait for the q4 results for any decision

Tata Steel - Correction?Tata Steel :-
- Monthly RSI showing signs of Divergence
- The same could be observed on Weekly RSI as well
- On daily the candle formed on 26.04.24 seems to be bearish in nature with high volumes forming a double top around the levels 165/170.
The Fib retracement could be seen plotted at 154-150, 0.5/0.618 respectively.
A short can be initiated from the levels 165/168 for a target of 6-8%
Buy opportunity can be seen at levels 152/154 post confirmation.

Cycle C of Zigzag underwayCycle Degree:Blue
Primary impulse:red
Primary Corrective:Yellow
Monthly chart of Tata Steel is suggesting price raising in zigzag corrective pattern on cycle degree of which we are in wave C shown here in blue.As zigzag being a 5-3-5 pattern wave C is unfolding in an impulsive manner on primary degree shown here in red.This impulse has completed wave 4 recently and wave 5 is underway currently.
Ideally wave 3 is found to be extended in an impulse but this being a commodity stock,wave 5 is often found extended.Equality target on cycle degree is coming at 480 level and wave 5 extention target on primary degree is coming at 360,which is still double from current levels.
One can go long at cmp of 162.25 as price has recently broken its previous all time high of 153 as is sustaining above that breakout level from last 3 weeks post a pull back.On the downside a stop-loss of wave 4 low should be kept which is coming at 115 odd levels.
Disclaimer:This are just my views on the stock,no position should solely be taken on its basis,posting this just for my future reference.

Tata steel - Looking goodTatasteel looking good for short to medium - Target 157+ 30% upswide potential

Tata steelBuy abv 125
Target 138, 150.
SL 112
Trend line broken, 125 abv only strong movement we can expect

Tata steel towards new highTata Steel has crossed its major resistance and towards of a new high.
entry after a small correction
Target 154
next target stay updated
Note this is only for no educational purpose so all risk is yours I am not responsible for any loss or profit.

TATA Steel Bullish long timeframe As per my previous analysis as you can see after taking retrace at 115 level it take a bullish move.
Now you can add more position at the range between 156.90-153.55 . As I'm expecting price will come here once .
Our Support :147.35

TATA Steel Analysis and future trend.Tata steel is looking very strong. It has crossed all time high two days back. And it has rested its level and it looking to go up Apple. I have consider year low and project based on that price.
