ICICI Bank: Resistance Turned Support Powers Next Rally🔍 Technical Analysis
ICICI Bank showcases another remarkable wealth creation story spanning over two decades. The stock has delivered an extraordinary super bullish rally, transforming from ₹40 to the current trading level of ₹1,351 - representing an impressive 33.8x growth over 20+ years.
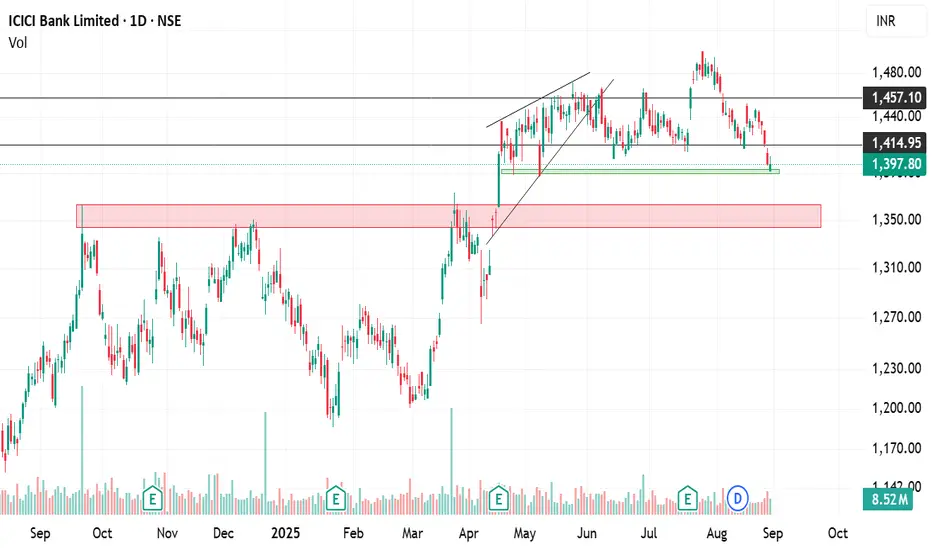
The ₹1,345-₹1,365 zone has historically acted as a strong resistance, tested multiple times. However, with the confirmation of strong FY25 results, the stock decisively broke out from this resistance zone and created a new all-time high at ₹1,500.
Following the breakout peak, the stock witnessed a sudden fall and is now trading back in the same zone at current market price of ₹1,351. This presents a critical juncture - if the earlier resistance zone transforms into support with bullish candlestick pattern confirmations, it could signal the next leg of the rally.
Entry Strategy: Enter only on confirmation of ₹1,345-₹1,365 zone acting as support with bullish patterns.
🎯 Targets:
Target 1: ₹1,400
Target 2: ₹1,450
Target 3: ₹1,500
🚫 Stop Losses:
Critical Support: ₹1,200 (crucial demand zone)
If ₹1,200 level doesn't sustain, no more expectations on this stock.
💰 FY25 Financial Highlights (vs FY24 & FY23)
Total Income: ₹1,86,331 Cr (↑ +17% YoY from ₹1,59,516 Cr; ↑ +95% from FY23 ₹95,407 Cr)
Total Expenses: ₹1,30,078 Cr (↑ +31% YoY from ₹99,560 Cr; ↑ +48% from FY23 ₹87,864 Cr)
Financing Profit: ₹-32,775 Cr (Improved from ₹-14,152 Cr in FY24)
Profit Before Tax: ₹72,854 Cr (↑ +21% YoY from ₹60,434 Cr; ↑ +58% from FY23 ₹46,256 Cr)
Profit After Tax: ₹54,569 Cr (↑ +18% YoY from ₹46,081 Cr; ↑ +54% from FY23 ₹35,461 Cr)
Diluted EPS: ₹71.65 (↑ +14% YoY from ₹63.02; ↑ +47% from FY23 ₹48.74)
🧠 Fundamental Highlights
ICICI Bank delivered robust FY25 performance with 18% PAT growth to ₹54,569 crore, supported by strong 17% revenue growth. The bank announced Q4 FY25 net profit of ₹12,630 crore, marking 18% increase, and declared ₹11 per share dividend reflecting strong financial health.
Market cap stands at ₹9,71,186 crore (up 4.06% in 1 year) with total revenue reaching ₹1,90,830 crore and profit of ₹56,563 crore. Stock is trading at 3.08 times its book value, indicating reasonable valuation for quality franchise.
Asset quality continues to improve with gross NPA dropping to 1.97% in Q2FY25 from 2.48% in Q2FY24, while net NPA ratio remained healthy at 0.43% in Q1 FY25. This demonstrates effective risk management and strong credit discipline.
The bank shows strength near key support zone of 1370-1390 on daily charts, with technical indicators suggesting potential diamond pattern formation around 1380-1400 range. Analysts expect stable net interest margins and continued momentum.
Strong digital banking initiatives, expanding retail franchise, and consistent delivery of 14-18% profit growth across quarters validates the bank's operational excellence and market leadership position in private banking sector.
✅ Conclusion
ICICI Bank's remarkable 20+ year journey from ₹40 to ₹1,500 all-time high, backed by strong FY25 fundamentals showing 18% PAT growth and ₹11 dividend, validates the sustained growth thesis. The critical ₹1,345-₹1,365 resistance-to-support transformation offers attractive entry opportunity for targeting ₹1,500 retest. Improving asset quality with 1.97% gross NPA, strong ROE profile, and digital transformation drive provide multiple growth catalysts. Key support at ₹1,200 provides risk management framework for this quality banking franchise.
ICBA trade ideas

FII and DII1. Introduction
In modern financial markets, institutional investors play a critical role in shaping the dynamics of equity, debt, and derivative markets. Among these, Foreign Institutional Investors (FIIs) and Domestic Institutional Investors (DIIs) are two dominant categories whose investments can influence market liquidity, volatility, and pricing trends. Understanding the characteristics, strategies, and regulatory frameworks governing FIIs and DIIs is essential for investors, policymakers, and financial analysts.
2. Definition and Overview
2.1 Foreign Institutional Investors (FII)
Definition: FIIs are investment entities incorporated outside a domestic market but authorized to invest in that market’s financial instruments. For example, a U.S.-based mutual fund investing in Indian equities is an FII in India.
Types of FIIs:
Pension Funds
Hedge Funds
Mutual Funds
Insurance Companies
Sovereign Wealth Funds
Objective: FIIs primarily seek to diversify portfolios internationally and capitalize on higher returns in emerging markets.
2.2 Domestic Institutional Investors (DII)
Definition: DIIs are investment entities incorporated within the domestic market and investing in local financial instruments. Examples include Indian mutual funds, insurance companies, and banks investing in Indian equities and bonds.
Types of DIIs:
Mutual Funds
Insurance Companies
Banks and Financial Institutions
Pension Funds
Objective: DIIs focus on long-term capital growth and stability, often with a fiduciary responsibility towards domestic investors.
3. Regulatory Framework
3.1 FII Regulations
FIIs operate under strict regulations in host countries to protect domestic financial markets.
In India:
Regulated by Securities and Exchange Board of India (SEBI)
Must register under SEBI’s FII framework.
Subject to limits on equity holdings in single companies.
Required to comply with Anti-Money Laundering (AML) norms.
3.2 DII Regulations
DIIs operate under domestic financial regulations.
Mutual Funds: Regulated by SEBI (Mutual Fund Regulations)
Banks & Insurance Companies: Regulated by RBI (banks) and IRDAI (insurance).
DII investments are often encouraged to stabilize markets and support government securities.
4. Role in Financial Markets
4.1 FIIs
Liquidity Provider: FIIs bring significant foreign capital, improving market liquidity.
Market Volatility: FIIs’ short-term strategies can create volatility due to sudden inflows or outflows.
Price Discovery: Global investment patterns influence asset valuations and market pricing.
Emerging Market Influence: In countries like India, FII investments impact currency, interest rates, and economic policy.
4.2 DIIs
Stabilizers: DIIs often act as counterbalances to FII volatility.
Long-Term Investment: DIIs usually adopt buy-and-hold strategies, ensuring market depth.
Domestic Growth: Their investments support domestic enterprises, infrastructure, and government securities.
5. Investment Strategies
5.1 FIIs Strategies
Arbitrage: Exploiting differences in asset prices across markets.
Momentum Investing: Riding on short-term price trends for quick gains.
Sectoral Focus: FIIs may invest heavily in high-growth sectors like IT or Pharma.
Derivatives: Using futures, options, and swaps to hedge risk or speculate.
5.2 DIIs Strategies
Value Investing: Focusing on fundamentally strong companies with long-term growth potential.
Portfolio Diversification: Reducing risk across sectors and asset classes.
Fixed-Income Instruments: Heavy investments in bonds and government securities.
Market Support: DIIs often buy during FII outflows to stabilize the market.
6. Impact on Stock Markets
6.1 On Equity Markets
FIIs can drive market rallies or corrections due to large-scale trades.
DIIs counterbalance excessive volatility, supporting sustained growth.
Example: In India, FII inflows in IT and Pharma often cause index surges, while DII inflows stabilize sectors like FMCG and Banks.
6.2 On Currency Markets
FIIs’ foreign investments influence exchange rates. Sudden FII outflows may weaken domestic currency.
DIIs typically operate in local currency instruments, minimizing forex risk.
6.3 On Bond Markets
DIIs dominate government and corporate bond markets.
FIIs also invest in sovereign debt, affecting yields and interest rate dynamics.
7. Comparative Analysis of FIIs and DIIs
Feature FII DII
Origin Foreign-based institutions Domestic institutions
Investment Horizon Short to medium term Long-term
Impact on Market Can increase volatility Stabilizes market
Currency Exposure Exposed to forex risk Typically in local currency
Regulatory Oversight SEBI (and home country regulations) SEBI, RBI, IRDAI
Influence on Economy Drives capital inflows and growth Supports domestic stability and growth
8. Challenges and Risks
8.1 FIIs
Market sensitivity to global economic conditions.
Exchange rate fluctuations.
Regulatory changes in home or host countries.
Risk of sudden capital withdrawal affecting liquidity.
8.2 DIIs
Slower response to global trends.
Limited investment resources compared to FIIs.
Regulatory restrictions on certain high-yield investments.
Potential conflict between long-term objectives and short-term market needs.
9. Case Studies and Historical Trends
9.1 India
1990s Liberalization: FII investments surged post-economic liberalization.
2008 Global Financial Crisis: FIIs pulled out capital, DIIs mitigated impact by buying equities.
Post-2020 Pandemic: FIIs initially exited, DIIs supported markets through mutual fund inflows.
9.2 Global Perspective
FIIs dominate emerging markets (India, Brazil, China), affecting stock indices.
DIIs in developed markets (U.S., U.K.) have less relative impact due to higher domestic liquidity.
10. Policy and Market Implications
Regulators monitor FII and DII flows to manage market stability.
Capital controls, investment limits, and taxation policies influence investment decisions.
Governments encourage DIIs to build domestic capital and reduce reliance on foreign funds.
11. Conclusion
FIIs and DIIs are integral to the functioning of financial markets. FIIs bring global capital, sophistication, and market depth but also volatility. DIIs provide stability, long-term growth, and support domestic economic objectives. A balanced participation of both ensures a robust, dynamic, and resilient financial system. Understanding their behavior, strategies, and impact is crucial for investors, regulators, and policymakers aiming to maintain healthy capital markets.
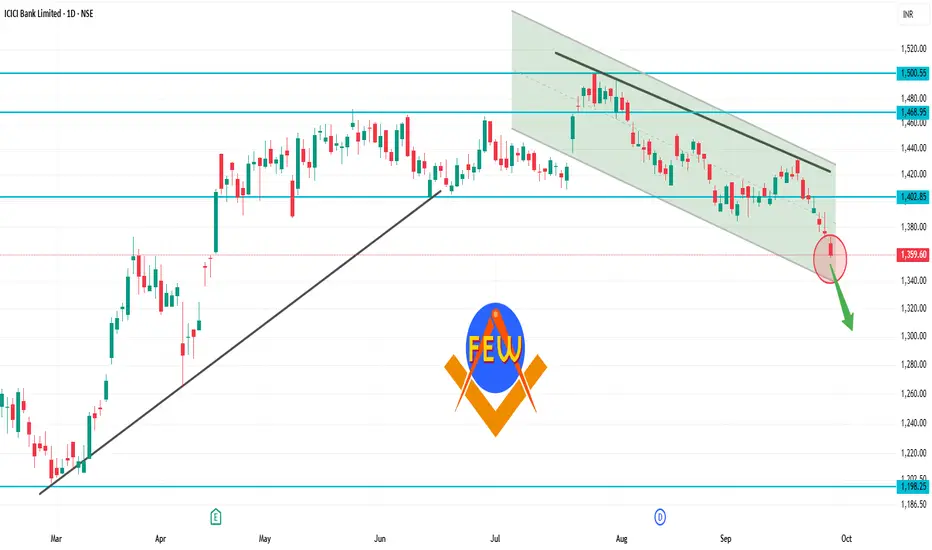
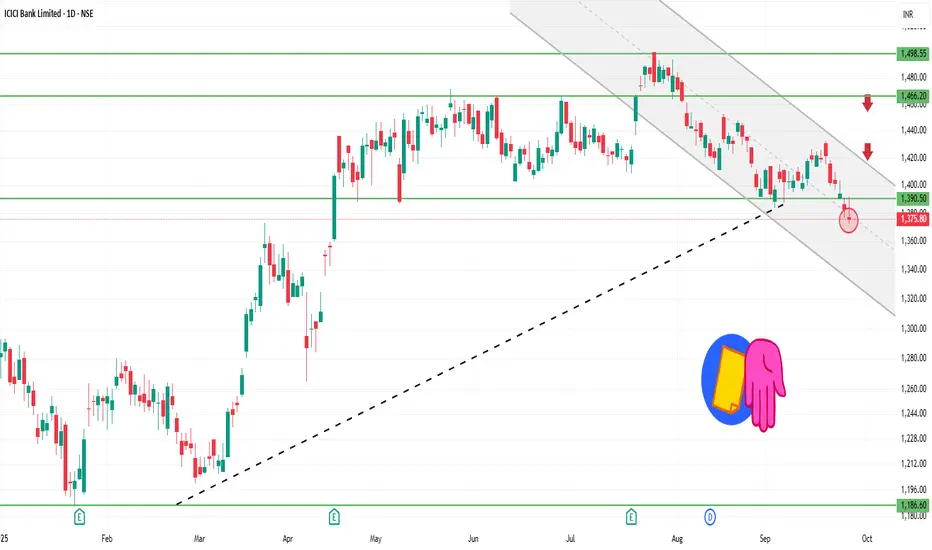
ICICI Bank Under Pressure: Breakdown Could Open ₹1,360–1,340ICICI Bank has been exhibiting persistent weakness over the past few sessions, underperforming relative to the broader market and showing clear signs of profit-booking. Despite being one of the stronger banking names in the past, the stock has recently struggled to sustain upward momentum, reflecting near-term bearish undertones.
Currently, ICICI Bank is trading around a crucial support band of ₹1,400–1,390. This zone has historically acted as a strong base, where buying interest has emerged in the past. However, repeated testing of this support without a meaningful bounce raises concerns about its sustainability.
A decisive breakdown below ₹1,390 could accelerate weakness and potentially drag the stock towards ₹1,360 and ₹1,340 levels, which are the next major support zones. These levels are important markers that could determine the medium-term trend.
On the upside, for sentiment to improve, the stock must sustain above ₹1,400–1,420 with strong volumes. Until then, caution is advised, as the undertone remains weak, and any breakdown may invite further selling pressure.
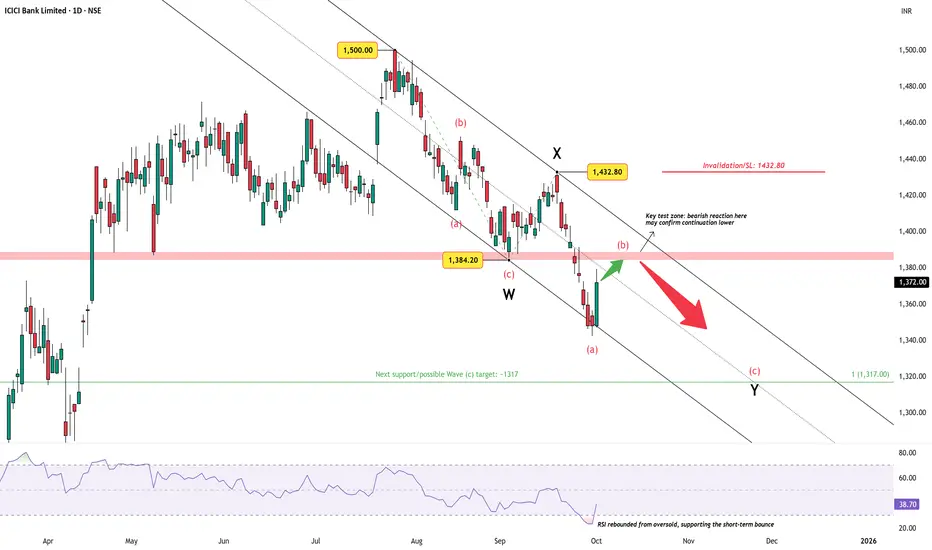
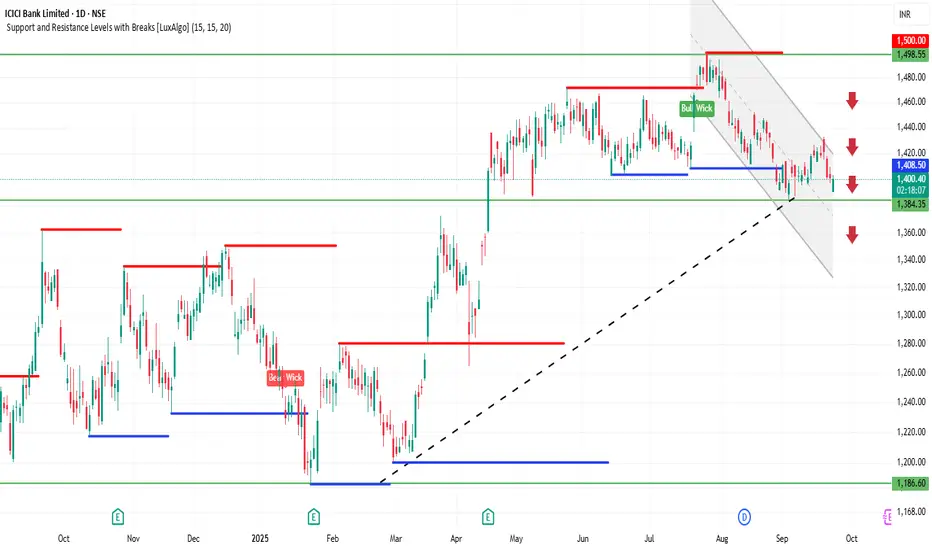
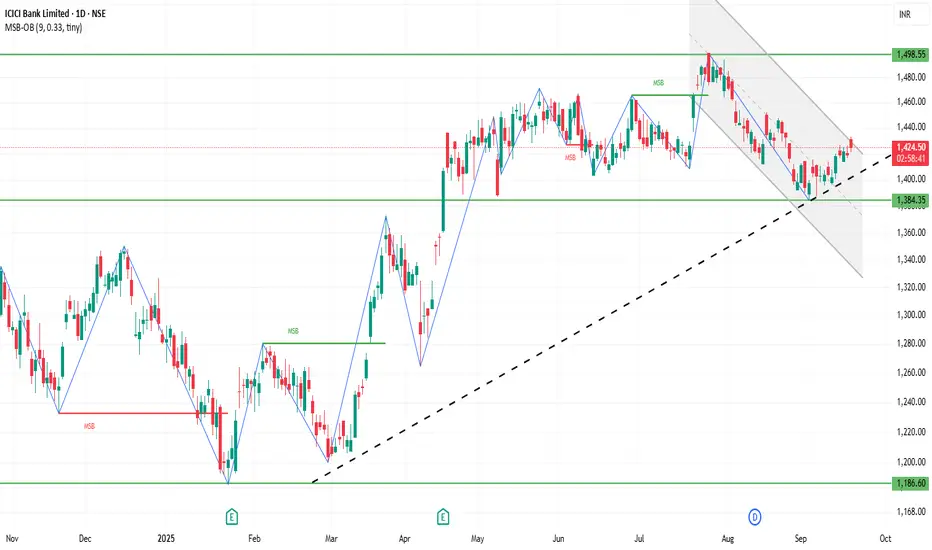
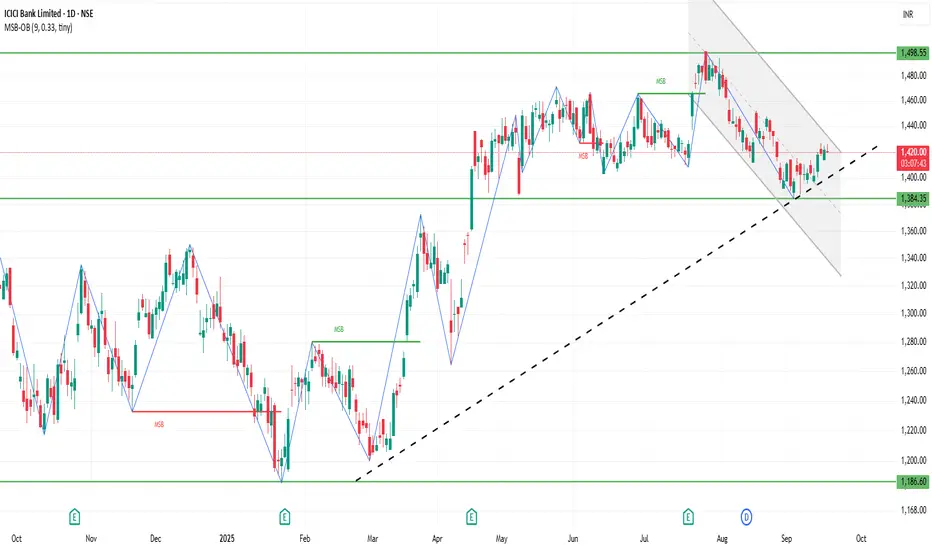
ICICI Bank – Relief Rally into ResistanceAfter topping at ₹1500 , ICICI Bank has corrected over 10% into late September, carving out a clear W–X–Y corrective structure. The recent bounce from oversold RSI levels was expected, but price is now heading straight into the crucial resistance band near ₹1384 .
A bearish reaction here would validate the ongoing correction, opening the path toward the next support / Wave (c) target at ~₹1317 .
However, any sustained move above ₹1432.80 would invalidate the bearish view and suggest a different structure in play.
Overall, the setup currently favors caution on rallies, with focus on whether sellers defend the resistance band.
Disclaimer: This analysis is for educational purposes only and does not constitute investment advice. Please do your own research (DYOR) before making any trading decisions.
Option Trading SecretsPart 1: Understanding Options – The Foundation of Secrets
1.1 What Are Options?
Options are financial derivatives that give the holder the right, but not the obligation, to buy or sell an asset at a predetermined price (strike price) before a certain date (expiry). There are two main types:
Call Options: Right to buy.
Put Options: Right to sell.
Secret Insight: Many traders fail because they focus on “predicting direction” rather than understanding the time value and volatility embedded in options prices.
1.2 Components of an Option
Strike Price – The predetermined price of the underlying asset.
Expiry Date – The date the option contract expires.
Premium – The price paid to buy the option.
Intrinsic Value – The value if exercised today.
Time Value – Additional value due to the time left until expiry.
Secret Insight: Time decay (Theta) is often overlooked. Successful option traders exploit time decay instead of fighting against it.
1.3 Why Trade Options?
Leverage: Small capital controls large positions.
Flexibility: Can profit in bullish, bearish, or neutral markets.
Hedging: Protects your stock portfolio against losses.
Income Generation: Selling options (writing calls/puts) can create steady cash flow.
Secret Insight: Most beginners try to predict market direction, while pros focus on probability, risk management, and strategic positioning.
Part 2: Core Option Trading Secrets
2.1 Volatility – The Hidden Force
Volatility is the heartbeat of option pricing.
Implied Volatility (IV): Market’s forecast of future volatility.
Historical Volatility (HV): Past price movement.
Secret Insight: Options are more expensive when IV is high. Selling options in high IV periods and buying in low IV periods can increase success probability.
2.2 The Greeks – Your Secret Weapons
Understanding the Greeks is crucial:
Delta: Sensitivity to underlying price.
Gamma: Rate of change of Delta.
Theta: Time decay effect.
Vega: Sensitivity to volatility.
Rho: Sensitivity to interest rates.
Secret Insight: Most traders obsess over price prediction. Successful traders control risk by managing Greeks, not just by buying/selling calls or puts.
2.3 The Myth of Directional Trading
While buying calls in a bullish market or puts in a bearish market is intuitive, it’s often a losing strategy if done without:
Timing
Volatility awareness
Strike price selection
Secret Insight: Many profits come from neutral strategies that capitalize on time decay or volatility changes.
Part 3: Advanced Option Strategies – Secrets of the Pros
3.1 Spreads – Reducing Risk and Cost
Vertical Spread: Buy and sell options of the same type and expiry but different strikes.
Horizontal/Calendar Spread: Exploit time decay differences.
Diagonal Spread: Combines vertical and horizontal spreads for advanced hedging.
Secret Insight: Spreads reduce cost and risk while keeping profit potential. Many retail traders ignore them, chasing naked options for huge gains and ending up in losses.
3.2 Iron Condors & Butterflies – Secrets for Range-Bound Markets
Iron Condor: Sell OTM calls and puts, buy further OTM options to hedge risk.
Butterfly Spread: Profit from minimal movement around a target price.
Secret Insight: The real secret is managing position size and probability. Profitable options trading often comes from small, consistent wins rather than rare big wins.
3.3 Protective Strategies – Hedging Like a Pro
Protective Puts: Own stock but buy puts to limit downside.
Covered Calls: Own stock and sell calls to generate income.
Secret Insight: The best traders treat options primarily as insurance and income tools, not just speculation.
Part 4: Risk Management Secrets
4.1 Position Sizing
Never risk more than 1–2% of capital on a single trade.
Adjust size based on volatility and Greeks.
Secret Insight: Even the best strategies fail without disciplined capital management.
4.2 Avoiding Common Traps
Buying deep OTM options as “lottery tickets.”
Ignoring IV crush after earnings.
Over-leveraging and underestimating Theta decay.
Secret Insight: Most traders fail psychologically before failing technically. Emotional control is a secret weapon.
4.3 The Power of Probability
Options trading isn’t gambling—it’s about stacking probabilities in your favor.
Favor high probability setups with defined risk.
Accept small consistent profits over chasing massive gains.
Part 5: Market Timing Secrets
5.1 Earnings and Events
Options react violently to earnings, FOMC, or geopolitical events.
Secret Insight: Use spreads or iron condors around events rather than naked buying. This controls risk while keeping upside potential.
5.2 Using Technical Analysis
Support/resistance levels, trend lines, and moving averages can guide strike selection.
Combine technicals with implied volatility for high-probability trades.
Secret Insight: Pros don’t blindly buy calls and puts—they combine technical triggers with probability and volatility analysis.
5.3 Psychological Edge
Patience beats impulsiveness.
Accept losses quickly; let winners run within limits.
Secret Insight: Trading psychology, discipline, and emotional control are the ultimate secrets that most books don’t emphasize.
Part 6: Building a System – From Secrets to Strategy
6.1 Developing a Personal Edge
Track historical trades and analyze winning patterns.
Identify setups where probability favors you.
Stick to trades that fit your risk tolerance.
6.2 Journaling & Review
Record each trade: entry, exit, rationale, and outcome.
Evaluate mistakes objectively.
Secret Insight: The market doesn’t care about your emotions. Your edge grows from systematic review and refinement.
6.3 Continuous Learning
Study options pricing models, volatility surfaces, and macro events.
Attend webinars, read research reports, and adapt strategies.
Conclusion
Option trading secrets are not magic formulas; they are disciplined habits:
Understanding volatility and Greeks.
Using spreads and hedges to control risk.
Managing position sizes and emotions.
Timing trades around probability and technical setups.
Constant learning and adaptation.
By mastering these secrets, traders can transform options trading from risky speculation to a high-probability, strategic, and disciplined pursuit.
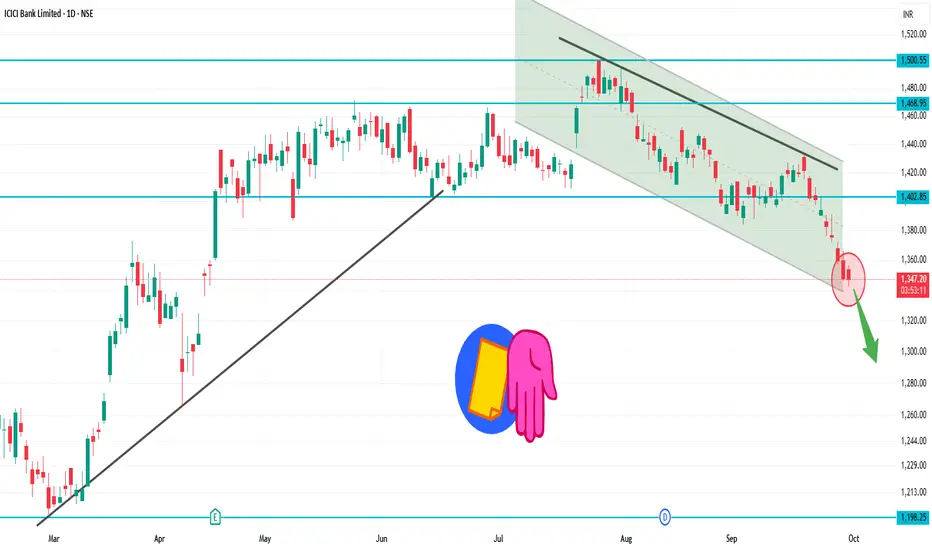
ICICI Bank: Resistance Turned Support Powers Next RallyTechnical Analysis
ICICI Bank showcases another remarkable wealth creation story spanning over two decades. The stock has delivered an extraordinary super bullish rally, transforming from ₹40 to the current trading level of ₹1,351 - representing an impressive 33.8x growth over 20+ years.
The ₹1,345-₹1,365 zone has historically acted as a strong resistance, tested multiple times. However, with the confirmation of strong FY25 results, the stock decisively broke out from this resistance zone and created a new all-time high at ₹1,500.
Following the breakout peak, the stock witnessed a sudden fall and is now trading back in the same zone at current market price of ₹1,351. This presents a critical juncture - if the earlier resistance zone transforms into support with bullish candlestick pattern confirmations, it could signal the next leg of the rally.
Entry Strategy: Enter only on confirmation of ₹1,345-₹1,365 zone acting as support with bullish patterns.
Targets:
Target 1: ₹1,400
Target 2: ₹1,450
Target 3: ₹1,500
Stop Losses:
Critical Support: ₹1,200 (crucial demand zone)
If ₹1,200 level doesn't sustain, no more expectations on this stock.
FY25 Financial Highlights (vs FY24 & FY23)
Total Income: ₹1,86,331 Cr (↑ +17% YoY from ₹1,59,516 Cr; ↑ +95% from FY23 ₹95,407 Cr)
Total Expenses: ₹1,30,078 Cr (↑ +31% YoY from ₹99,560 Cr; ↑ +48% from FY23 ₹87,864 Cr)
Financing Profit: ₹-32,775 Cr (Improved from ₹-14,152 Cr in FY24)
Profit Before Tax: ₹72,854 Cr (↑ +21% YoY from ₹60,434 Cr; ↑ +58% from FY23 ₹46,256 Cr)
Profit After Tax: ₹54,569 Cr (↑ +18% YoY from ₹46,081 Cr; ↑ +54% from FY23 ₹35,461 Cr)
Diluted EPS: ₹71.65 (↑ +14% YoY from ₹63.02; ↑ +47% from FY23 ₹48.74)
Fundamental Highlights
ICICI Bank delivered robust FY25 performance with 18% PAT growth to ₹54,569 crore, supported by strong 17% revenue growth. The bank announced Q4 FY25 net profit of ₹12,630 crore, marking 18% increase, and declared ₹11 per share dividend reflecting strong financial health.
Market cap stands at ₹9,71,186 crore (up 4.06% in 1 year) with total revenue reaching ₹1,90,830 crore and profit of ₹56,563 crore. Stock is trading at 3.08 times its book value, indicating reasonable valuation for quality franchise.
Asset quality continues to improve with gross NPA dropping to 1.97% in Q2FY25 from 2.48% in Q2FY24, while net NPA ratio remained healthy at 0.43% in Q1 FY25. This demonstrates effective risk management and strong credit discipline.
The bank shows strength near key support zone of 1370-1390 on daily charts, with technical indicators suggesting potential diamond pattern formation around 1380-1400 range. Analysts expect stable net interest margins and continued momentum.
Strong digital banking initiatives, expanding retail franchise, and consistent delivery of 14-18% profit growth across quarters validates the bank's operational excellence and market leadership position in private banking sector.
Conclusion
ICICI Bank's remarkable 20+ year journey from ₹40 to ₹1,500 all-time high, backed by strong FY25 fundamentals showing 18% PAT growth and ₹11 dividend, validates the sustained growth thesis. The critical ₹1,345-₹1,365 resistance-to-support transformation offers attractive entry opportunity for targeting ₹1,500 retest. Improving asset quality with 1.97% gross NPA, strong ROE profile, and digital transformation drive provide multiple growth catalysts. Key support at ₹1,200 provides risk management framework for this quality banking franchise.
Disclaimer: tinyurl.com

ICICIBANK 1D Time frameClosing Price: ₹1,363.00
Day's Range: ₹1,357.00 – ₹1,372.70
Previous Close: ₹1,375.80
Volume: 18,342,280 shares traded
Market Cap: ₹971,186 crore
52-Week High: ₹1,500.00
52-Week Low: ₹1,186.00
Face Value: ₹2.00
Beta: 0.90
🧾 Financial Highlights
P/E Ratio (TTM): 18.36
P/B Ratio: 3.12
EPS (TTM): ₹74.04
Dividend Yield: 0.81%
ROE: 17.05%
Book Value: ₹436.56
📈 Technical Insights
Trend: The stock is approaching its 200-day moving average, a key technical indicator. A bounce from this level could signal a buying opportunity, while a breakdown may suggest further downside risk.
Support Levels: ₹1,357.00, ₹1,350.00
Resistance Levels: ₹1,375.00, ₹1,400.00
📌 Key Takeaways
Recent Performance: ICICI Bank's stock declined by 0.91%, underperforming the broader market.
Analyst Sentiment: Despite recent volatility, ICICI Bank remains a top pick among analysts for long-term investment.
Part 6 Learn Institutional Trading 1. The Mechanics of Option Trading
Option trading involves two primary participants: buyers and sellers (writers).
Option Buyer: Pays the premium upfront. Has limited risk (only the premium can be lost) but unlimited potential gain (in case of call options) or substantial downside protection (in case of puts).
Option Seller (Writer): Receives the premium. Has limited potential gain (only the premium) but carries significant risk if the market moves against the position.
Trading mechanics also include:
Margin Requirements: Sellers need to deposit margins since their risk is higher.
Lot Size: Options are traded in lots rather than single shares. For example, Nifty options have a standard lot size of 25 contracts.
Liquidity: High liquidity in options ensures tighter spreads and better price execution.
Settlement: Options can be cash-settled (index options in India) or physically settled (individual stock options in India post-2019 reforms).
The actual trading process involves analyzing the market, selecting strike prices, and deciding whether to buy or sell calls/puts depending on the outlook.
2. Option Pricing and the Greeks
One of the most fascinating aspects of option trading is pricing. Unlike stocks, which are priced directly by supply and demand, option prices are influenced by multiple factors.
The Black-Scholes model and other pricing models take into account:
Intrinsic Value: The real value of an option if exercised today.
Time Value: Extra premium based on time left until expiry.
Volatility: Higher expected volatility raises option premiums.
The Greeks
Option traders rely heavily on the Greeks, which measure sensitivity to different market factors:
Delta: Measures how much an option price changes with a ₹1 change in the underlying asset.
Gamma: Measures how delta itself changes with the price movement.
Theta: Time decay; options lose value as expiry nears.
Vega: Sensitivity to volatility.
Rho: Sensitivity to interest rates.
Understanding these allows traders to manage risk more effectively and structure trades in line with their market views.
3. Types of Option Strategies: From Basics to Advanced
Options allow for simple trades as well as complex multi-leg strategies.
Basic Strategies:
Buying Calls (bullish).
Buying Puts (bearish).
Covered Call (own stock + sell call).
Protective Put (own stock + buy put).
Intermediate Strategies:
Bull Call Spread (buy lower strike call, sell higher strike call).
Bear Put Spread (buy put, sell lower strike put).
Straddle (buy call + buy put at same strike).
Strangle (buy out-of-money call + put).
Advanced Strategies:
Iron Condor (combination of spreads to profit from low volatility).
Butterfly Spread (low-risk, low-reward strategy).
Calendar Spread (buy long-term option, sell short-term).
Each strategy has a defined risk-reward profile, making options unique compared to outright stock trading.

Part 2 Support and Resistance 1. Introduction to Options
Financial markets have always revolved around two broad purposes—hedging risk and creating opportunity. Among the tools available, options stand out because they combine flexibility, leverage, and adaptability in a way few instruments can match. Unlike simply buying a stock or bond, an option lets you control exposure to price movements without outright ownership. This makes options both fascinating and complex.
Option trading today has exploded globally, with millions of retail and institutional traders participating daily. But to appreciate their role, we need to peel back the layers—what exactly is an option, how does it work, and why do traders and investors use them?
2. What Are Options? (Call & Put Basics)
An option is a financial derivative—meaning its value is derived from an underlying asset like a stock, index, commodity, or currency.
There are two main types:
Call Option – Gives the holder the right (not obligation) to buy the underlying at a set price (strike) before or on expiration.
Put Option – Gives the holder the right (not obligation) to sell the underlying at a set price before or on expiration.
Example: Suppose Reliance stock trades at ₹2,500. If you buy a call option with a strike price of ₹2,600 expiring in one month, you’re betting the stock will rise above ₹2,600. Conversely, if you buy a put option with a strike price of ₹2,400, you’re betting the stock will fall below ₹2,400.
The beauty lies in asymmetry: you can lose only the premium you pay, but your potential profit can be much larger.
3. Key Terminologies in Option Trading
Options trading comes with its own dictionary. Some must-know terms include:
Strike Price – Predetermined price to buy/sell underlying.
Expiration Date – Last date the option is valid.
Premium – Price paid to buy the option.
In the Money (ITM) – Option has intrinsic value (profitable if exercised immediately).
Out of the Money (OTM) – Option has no intrinsic value, only time value.
At the Money (ATM) – Strike price equals current market price.
Lot Size – Standardized quantity of underlying in each option contract.
Open Interest (OI) – Number of outstanding option contracts in the market.
Understanding these is critical before trading.
4. How Options Work in Practice
Let’s say you buy an Infosys call option with strike ₹1,500, paying ₹30 premium.
If Infosys rises to ₹1,600, your option has intrinsic value of ₹100. Profit = ₹100 – ₹30 = ₹70 per share.
If Infosys stays below ₹1,500, the option expires worthless. Loss = Premium (₹30).
Notice how a small move in stock can create a large percentage return on option, thanks to leverage.
5. Intrinsic Value vs. Time Value
Option price = Intrinsic Value + Time Value.
Intrinsic Value – Actual in-the-money amount.
Time Value – Extra premium traders pay for the possibility of future favorable movement before expiry.
Time value decreases with theta decay as expiration approaches.

ICICIBANK 1D Time frame📍 Today’s Expected Range (Intraday Approximation)
Expected High: ₹1,403–₹1,410
Expected Low: ₹1,391–₹1,385
These are approximate intraday levels. Actual prices may fluctuate slightly due to market volatility.
🔍 Key Points
Current price: ₹1,400–₹1,401, close to resistance.
If price breaks above ₹1,410 with strong volume → bullish momentum likely.
If price drops below ₹1,385 → short-term correction or pullback possible.
📊 Suggested Trading Strategy
Bullish Scenario
If ICICI Bank breaks ₹1,403–₹1,410, you can buy, targeting ₹1,420–₹1,430.
Stop-loss: ₹1,395
Bearish Scenario
If ICICI Bank drops below ₹1,385, you can sell/short, targeting ₹1,375–₹1,370.
Stop-loss: ₹1,390
Range-Bound / Sideways
If price trades between ₹1,385–₹1,403, it’s better to wait and avoid trading until a clear breakout occurs.
💡 Summary
Resistance Zone: ₹1,403–₹1,410
Support Zone: ₹1,385–₹1,391
Strategy: Trade in the direction of the breakout, and always use stop-loss to manage risk.
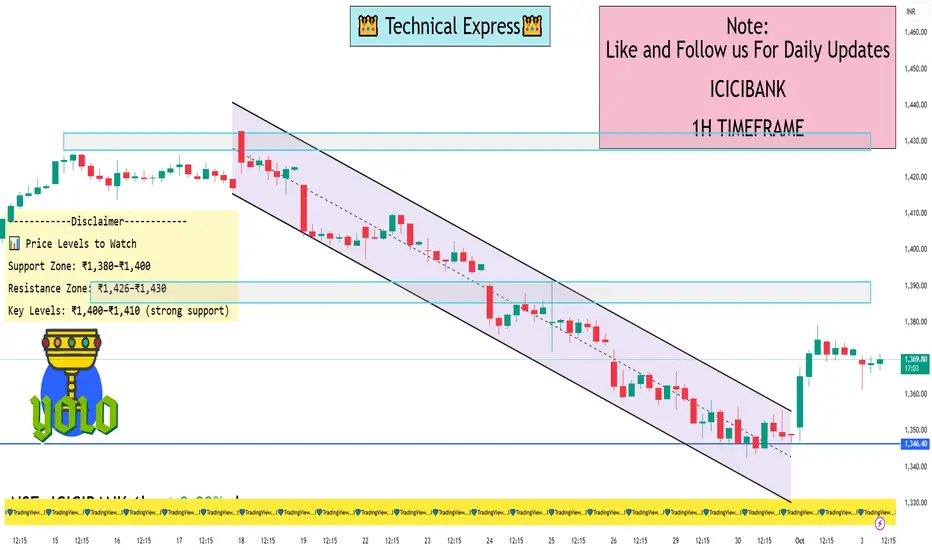
ICICIBANK 1 Hour View📊 1-Hour Timeframe: Key Levels
🔹 Support Levels
Immediate Support: ₹1,363.14
Key Support Zones: ₹1,352.93, ₹1,333.87
🔹 Resistance Levels
Immediate Resistance: ₹1,367.07
Key Resistance Zones: ₹1,385.23, ₹1,398.47
These levels are derived from standard pivot point calculations and are commonly used by traders to identify potential reversal points within the trading day.
📈 Technical Indicators (1-Hour Chart)
Relative Strength Index (RSI): 37.26 — indicates the stock is nearing oversold conditions, suggesting potential for a price rebound.
Moving Average Convergence Divergence (MACD): -16.11 — a negative value, which may indicate bearish momentum.
Average Directional Index (ADX): 23.81 — suggests a weak trend, implying indecision in the market.
Stochastic Oscillator: 13.21 — indicates the stock is oversold, potentially signaling a reversal.
Supertrend Indicator: ₹1,398.34 — indicates a bearish trend.
These indicators collectively suggest a bearish short-term outlook, with potential for a reversal if support levels hold.
📊 Price Levels to Watch
Support Zone: ₹1,380–₹1,400
Resistance Zone: ₹1,426–₹1,430
Key Levels: ₹1,400–₹1,410 (strong support)
🔄 Summary
ICICI Bank Ltd. is currently trading near its support levels on the 1-hour chart. The RSI indicates potential oversold conditions, while other indicators suggest a weak bearish trend. Traders should monitor the key support and resistance levels mentioned above for potential breakout or breakdown scenarios.
icici bank BULLISH ICICI Bank's earnings are approaching, with weekly candles showing support at the 50-day moving average.

ICICIBANK 1D Time frame₹1,345.80 (NSE)
Day’s Range: ₹1,342.60 – ₹1,356.60
52-Week Range: ₹1,186.00 – ₹1,500.00
📉 Technical Overview
Trend: The stock is trading below its 200-day moving average, indicating a mildly bearish trend.
RSI: Currently at 26.6, suggesting the stock is in the oversold zone.
MACD: At -10.01, reinforcing the bearish momentum.
Moving Averages: A strong sell signal is indicated, with 0 buy signals and 12 sell signals across various timeframes.
🔼 Potential Upside (Rise)
Immediate Resistance: ₹1,355 – ₹1,365
Breakout Target: Above ₹1,365, the next resistance is around ₹1,380 – ₹1,390.
Bullish Confirmation: A close above ₹1,390 could signal a reversal or consolidation.
🔽 Potential Downside (Fall)
Immediate Support: ₹1,340 – ₹1,330
Breakdown Target: Below ₹1,330, the stock may test ₹1,310 – ₹1,300.
Bearish Confirmation: A close below ₹1,300 would strengthen the bearish outlook.
✅ Summary
Above ₹1,365: Potential rise toward ₹1,380 – ₹1,390.
Below ₹1,330: Potential fall toward ₹1,310 – ₹1,300.
Between ₹1,330 – ₹1,365: Likely range-bound movement.
ICICIBANK 1D Time frame📊 Daily Snapshot
Closing Price: ₹1,375.50
Day’s Range: ₹1,371.80 – ₹1,391.50
Previous Close: ₹1,382.70
Change: Down –0.52%
52-Week Range: ₹1,018.85 – ₹1,494.10
Market Cap: ₹9.7 lakh crore
P/E Ratio: 20.5
Dividend Yield: 1.2%
EPS (TTM): ₹67.00
Beta: 1.05 (moderate volatility)
🔑 Key Technical Levels
Support Zone: ₹1,370 – ₹1,375
Resistance Zone: ₹1,390 – ₹1,400
All-Time High: ₹1,494.10
📈 Technical Indicators
RSI (14-day): 34.1 – approaching oversold territory, suggesting potential for a rebound.
MACD: Negative, indicating bearish momentum.
Moving Averages: Trading below the 150-day moving average, indicating a bearish trend.
Candlestick Patterns: Recent formation of a Bearish Engulfing pattern, suggesting potential for further downside.
📉 Market Sentiment
Recent Performance: ICICI Bank has experienced a decline for the fifth consecutive session, underperforming the broader market.
Sector Performance: The NIFTY BANK index also closed lower, reflecting sector-wide weakness.
📈 Strategy (1D Timeframe)
1. Bullish Scenario
Entry: Above ₹1,390
Stop-Loss: ₹1,370
Target: ₹1,405 → ₹1,420
2. Bearish Scenario
Entry: Below ₹1,370
Stop-Loss: ₹1,390
Target: ₹1,355 → ₹1,340
Algorithmic Momentum Trading1. Introduction
In financial markets, traders constantly seek strategies that can give them an edge. Among these strategies, momentum trading has been widely used due to its intuitive appeal: assets that are rising tend to continue rising, and those falling tend to continue falling, at least in the short term. With the advent of technology, algorithmic trading—the use of automated, computer-driven systems to execute trades—has transformed momentum trading, making it faster, more precise, and more systematic.
Algorithmic momentum trading combines the principles of momentum strategies with the computational power of algorithms, enabling traders to identify trends, execute trades automatically, and optimize returns while reducing human biases. This approach has become increasingly popular in equity, forex, futures, and cryptocurrency markets, especially for high-frequency trading (HFT) and systematic trading firms.
2. Understanding Momentum Trading
2.1 Definition
Momentum trading is a strategy where traders buy assets that have shown an upward price movement and sell those that have shown downward momentum. The basic idea is rooted in behavioral finance: investors often underreact or overreact to news, causing trends to persist for a period.
2.2 Types of Momentum
Price Momentum: Focused on price movements over specific timeframes, e.g., buying assets that have gained more than 10% in the past month.
Volume Momentum: Involves monitoring unusually high trading volumes, signaling strong investor interest and potential continuation of trends.
Relative Strength: Comparing the performance of an asset relative to a benchmark or other assets.
Cross-Asset Momentum: Applying momentum strategies across different assets, sectors, or even markets to capture broader trends.
2.3 The Psychology Behind Momentum
Momentum trading leverages the herding behavior and confirmation bias of market participants. Investors tend to follow trends due to fear of missing out (FOMO) or overconfidence in their predictions. Algorithmic systems exploit these behavioral tendencies systematically, avoiding emotional decision-making.
3. Algorithmic Trading: An Overview
3.1 Definition
Algorithmic trading, also known as algo-trading, uses computer programs and pre-defined rules to execute trades. These rules can be based on timing, price, volume, or other market indicators.
3.2 Advantages
Speed: Algorithms can analyze markets and execute trades in milliseconds.
Accuracy: Reduces human error and emotional trading.
Backtesting: Strategies can be tested on historical data before implementation.
Scalability: Can monitor multiple markets and instruments simultaneously.
Consistency: Maintains trading discipline by following pre-defined rules.
3.3 Key Components
Market Data Feeds: Real-time price, volume, and news data.
Trading Algorithms: Mathematical models that generate buy/sell signals.
Execution Systems: Platforms that automatically place trades.
Risk Management Modules: Tools to monitor exposure, stop losses, and position sizing.
4. Momentum Strategies in Algorithmic Trading
4.1 Trend-Following Algorithms
These algorithms aim to capture prolonged price trends. They often rely on technical indicators such as moving averages (MA), exponential moving averages (EMA), or the Moving Average Convergence Divergence (MACD).
Example Strategy:
Buy when the short-term MA crosses above the long-term MA.
Sell when the short-term MA crosses below the long-term MA.
4.2 Relative Strength Index (RSI) Based Momentum
RSI is a momentum oscillator that measures the speed and change of price movements. In algorithmic systems:
Buy signals occur when RSI crosses above a lower threshold (e.g., 30, signaling oversold conditions).
Sell signals occur when RSI crosses below an upper threshold (e.g., 70, signaling overbought conditions).
4.3 Breakout Algorithms
These algorithms detect price levels where an asset breaks out of a defined range:
Buy when price exceeds resistance.
Sell when price drops below support.
Breakouts often generate strong momentum due to rapid market participation.
4.4 Volume-Weighted Momentum
Some algorithms combine price movement with trading volume:
Momentum is stronger when price rises along with high trading volume.
Algorithms assign higher probabilities to trades during high-volume trends.
4.5 Multi-Factor Momentum
Advanced algo strategies combine multiple indicators, such as:
Price trends
Volume spikes
Volatility metrics
Market sentiment derived from news or social media
By integrating multiple factors, these systems reduce false signals and enhance robustness.
5. Building an Algorithmic Momentum Trading System
5.1 Step 1: Data Collection
Algorithms require accurate, high-frequency data:
Historical price data (open, high, low, close)
Trading volume
Market news and sentiment
Economic indicators
5.2 Step 2: Signal Generation
The heart of any momentum algorithm is the signal:
Technical indicators (e.g., moving averages, MACD, RSI)
Statistical measures (e.g., z-scores, regression models)
Machine learning models (predictive signals from historical patterns)
5.3 Step 3: Risk Management
Key risk controls include:
Stop-Loss Orders: Automatic exit if losses exceed a threshold.
Position Sizing: Limiting the size of each trade based on risk tolerance.
Diversification: Trading across multiple instruments or timeframes.
Volatility Filters: Avoid trading during excessively volatile periods.
5.4 Step 4: Backtesting and Optimization
Before live deployment:
Test the strategy on historical data.
Optimize parameters (e.g., moving average lengths, RSI thresholds).
Check for overfitting, ensuring the strategy works across different market conditions.
5.5 Step 5: Execution
Execution modules interact with brokers or exchanges to:
Place market or limit orders
Monitor fill rates and slippage
Adjust positions in real time
6. Advanced Concepts in Algorithmic Momentum Trading
6.1 High-Frequency Momentum Trading
High-frequency trading (HFT) algorithms execute thousands of trades per second. Momentum in HFT relies on:
Microstructure analysis of order books
Short-term price inefficiencies
Statistical arbitrage across correlated assets
6.2 Machine Learning and AI
Machine learning models can enhance momentum strategies by:
Predicting price trends using historical patterns
Identifying non-linear relationships in market data
Continuously learning from new market information
Popular approaches include:
Supervised learning (predict next price movement)
Reinforcement learning (optimize trading actions over time)
Natural language processing (sentiment analysis from news or social media)
6.3 Cross-Market Momentum
Some algorithms exploit momentum across markets:
Commodities → equities correlation
Forex → equity index correlation
ETFs → underlying asset correlation
By analyzing relative trends, algorithms identify opportunities beyond single-asset momentum.
7. Challenges and Risks
7.1 False Signals
Momentum algorithms can fail during:
Market reversals
Low liquidity periods
Sudden news events
7.2 Overfitting
Optimizing a model too closely to historical data can reduce future performance.
7.3 Latency and Slippage
Execution delays and price slippage can erode returns, especially in high-frequency momentum trading.
7.4 Market Regime Changes
Momentum strategies may underperform during sideways or highly volatile markets.
8. Best Practices
Diversify Across Assets and Timeframes: Avoid relying on a single market or indicator.
Regularly Monitor and Update Algorithms: Markets evolve; so should the algorithms.
Use Risk Controls Aggressively: Stop-losses, position limits, and volatility filters are crucial.
Backtest Across Multiple Market Conditions: Ensure robustness across bull, bear, and sideways markets.
Combine Momentum with Other Strategies: Hybrid strategies can enhance performance.
9. Real-World Examples
9.1 Hedge Funds
Funds like Renaissance Technologies and Two Sigma use sophisticated momentum algorithms alongside other quantitative models to generate consistent returns.
9.2 Retail Trading
Platforms like MetaTrader, TradingView, and QuantConnect allow retail traders to implement algorithmic momentum strategies using historical data and backtesting.
9.3 Cryptocurrency Markets
Due to high volatility, algorithmic momentum trading is particularly effective in crypto. Bots can exploit short-term trends across multiple exchanges with minimal manual intervention.
10. Future of Algorithmic Momentum Trading
AI-Driven Momentum: Deep learning models capable of predicting market moves with higher accuracy.
Cross-Asset and Multi-Market Integration: Unified systems analyzing equities, crypto, forex, and commodities simultaneously.
Increased Automation: Smarter risk management and adaptive algorithms responding to real-time market conditions.
Regulatory Evolution: New laws and exchange rules may shape momentum algorithm designs, especially regarding HFT and market manipulation.
11. Conclusion
Algorithmic momentum trading represents the fusion of traditional momentum strategies with modern computational power. By automating the identification of trends, executing trades rapidly, and managing risk systematically, these strategies offer a powerful tool for traders in all markets. However, they are not foolproof—market dynamics, false signals, and execution risks remain challenges. The most successful algorithmic momentum traders combine solid strategy design, rigorous backtesting, advanced technology, and robust risk management to navigate complex markets.

Risk Management in Momentum Trading1. Understanding Risk in Momentum Trading
Momentum trading relies on riding price trends, which can be unpredictable and volatile. Unlike value investing, where positions are often held long-term, momentum traders operate in shorter timeframes, making them more susceptible to sudden reversals.
1.1 Types of Risks
Market Risk: The possibility of losses due to market movements against your position. Example: A stock you bought on a bullish breakout suddenly falls due to unexpected news.
Volatility Risk: Momentum trading thrives on volatility, but extreme volatility can produce rapid reversals.
Liquidity Risk: Thinly traded stocks or assets can make it difficult to enter or exit positions without significant slippage.
News Risk: Earnings, macroeconomic data, or geopolitical events can abruptly reverse momentum.
Behavioral Risk: Emotional reactions like FOMO (fear of missing out) or panic selling can lead to poor decision-making.
2. Risk-Reward Assessment
Every momentum trade should have a clearly defined risk-reward ratio, usually at least 1:2 or higher.
Example: If you risk $100 per trade, aim for a target profit of $200 or more.
Using a favorable risk-reward ratio ensures that even if only half your trades succeed, the strategy remains profitable over time.
Momentum traders often rely on technical levels, like support/resistance, Fibonacci retracements, or trendlines, to determine profit targets.
3. Volatility Management
Momentum trading thrives on volatility, but too much volatility increases risk. Managing it requires:
3.1 Volatility Indicators
Average True Range (ATR): Measures daily price movement to adjust stop-loss and position size.
Bollinger Bands: Identify periods of high volatility where momentum can reverse.
VIX Index (for stocks): Indicates overall market fear and potential risk spikes.
3.2 Volatility-Based Position Sizing
In highly volatile markets, reduce position size to avoid large losses.
Conversely, in low-volatility environments, slightly larger positions may be acceptable because price swings are smaller.
4. Trade Planning and Discipline
Risk management in momentum trading is not just about numbers; it’s also about planning and discipline.
4.1 Pre-Trade Analysis
Identify entry points, stop-loss, and profit targets before entering a trade.
Evaluate market context, sector performance, and relative strength of the asset.
Determine acceptable loss for the trade relative to account size.
4.2 Journaling
Maintain a trading journal with entry, exit, stop-loss, profit, loss, and notes on market conditions.
Helps identify patterns, mistakes, and improve risk management decisions over time.
4.3 Avoiding Overtrading
Momentum can create excitement, but overtrading increases exposure to market risk.
Focus only on high-probability setups that meet predefined criteria.
5. Psychological Risk Management
Momentum trading requires a strong mental framework. Emotional mismanagement can lead to catastrophic losses.
5.1 Controlling Greed
Traders often hold positions too long, hoping for extra profit, risking reversal.
Discipline with profit targets and trailing stops prevents giving back gains.
5.2 Managing Fear
Fear can lead to exiting positions prematurely or hesitation to enter valid trades.
Confidence in pre-planned setups and risk rules is critical.
5.3 Avoiding FOMO
Momentum traders may feel compelled to enter trades late in a trend.
FOMO often leads to poor entry prices and inadequate stop-loss levels.
6. Hedging and Portfolio Risk
Advanced momentum traders often use hedging to manage portfolio-level risk:
Options Hedging: Using puts to protect long momentum positions in stocks.
Diversification Across Assets: Trading momentum in different markets (stocks, forex, commodities) reduces correlation risk.
Inverse ETFs or Short Positions: Can hedge downside risk during market reversals.
7. Market-Specific Risk Management
7.1 Stocks
Use stop-loss orders based on technical support/resistance levels.
Avoid thinly traded small-cap stocks to reduce liquidity risk.
Monitor market-wide news to avoid broad reversals.
7.2 Forex
Account for macroeconomic news and central bank announcements.
Use smaller position sizes during low-liquidity periods.
Consider volatility spreads and slippage in currency pairs.
7.3 Cryptocurrencies
Use tight stop-losses and smaller positions due to extreme volatility.
Avoid low-liquidity altcoins to reduce exposure to pump-and-dump schemes.
Monitor social media and news sentiment for sudden momentum shifts.
7.4 Commodities
Use futures contracts with proper margin management to avoid over-leverage.
Be aware of seasonal and geopolitical factors affecting supply-demand dynamics.
Combine trend-following indicators with volume analysis for better risk control.
8. Combining Technical Analysis with Risk Management
Technical analysis is the backbone of momentum trading. Effective risk management involves integrating technical signals with disciplined capital control:
Entry Confirmation: Only enter trades when multiple momentum indicators align.
Stop-Loss Placement: Set stops just beyond support/resistance or volatility bands.
Profit Targeting: Use Fibonacci extensions, previous highs/lows, or trendlines to lock in gains.
Exit Signals: Monitor trend weakening indicators like divergence in MACD or RSI for early exits.
9. Case Study Example
Scenario: Trading momentum in a trending stock.
Entry: Stock breaks resistance at ₹200 with high volume.
Stop-Loss: Placed at ₹195, based on ATR and recent consolidation.
Position Size: Account risk 2%, capital ₹50,000 → risk ₹1,000 → 200 shares.
Target: Risk-reward ratio 1:3 → target profit = ₹3000 → exit at ₹215.
Outcome: If stock surges to ₹215, gain ₹3,000. If reverses to ₹195, loss limited to ₹1,000.
This demonstrates capital protection, risk-reward adherence, and discipline in momentum trading.
10. Advanced Risk Management Techniques
Volatility Scaling: Adjust position sizes dynamically based on current market volatility.
Algorithmic Risk Controls: Use automated stop-losses, trailing stops, and risk alerts in high-frequency momentum trading.
Correlation Analysis: Avoid taking multiple momentum trades in highly correlated assets to reduce portfolio risk.
Stress Testing: Simulate market shocks to test the resilience of momentum strategies.
Summary
Momentum trading can generate substantial profits, but it comes with high risks. Effective risk management in momentum trading requires:
Capital allocation and position sizing to limit losses.
Stop-loss placement tailored to market volatility.
Risk-reward assessment for every trade.
Volatility management to adapt to changing market conditions.
Discipline and psychological control to prevent emotional decisions.
Market-specific adjustments for stocks, forex, cryptocurrencies, and commodities.
Advanced techniques like hedging, correlation analysis, and stress testing.
By combining these principles, momentum traders can maximize profits while minimizing potential losses, creating a sustainable trading strategy in volatile and unpredictable markets.
Part 9 Trading Master Class1. How Option Trading Works
Let’s take a practical example.
Stock: TCS trading at ₹3600
You think it will rise.
You buy a call option with strike price ₹3700, paying ₹50 premium.
Two scenarios:
If TCS goes to ₹3900 → You can buy at ₹3700, sell at ₹3900, profit = ₹200 – ₹50 = ₹150.
If TCS stays at ₹3600 → Option expires worthless, you lose only the premium ₹50.
That’s the beauty: limited loss, unlimited profit (for buyers).
For sellers (writers), it’s the opposite: limited profit (premium collected), unlimited risk.
2. Options vs Stocks
Stocks: Ownership of company shares.
Options: Rights to trade shares at fixed prices.
Differences:
Options expire, stocks don’t.
Options require less money upfront (leverage).
Options can hedge risks, stocks cannot.
3. Why Traders Use Options
Options are versatile. Traders use them for three main reasons:
Hedging – Protecting portfolios from losses.
Example: If you own Nifty stocks but fear a market fall, buy a Nifty put option. Losses in shares will be offset by gains in the put.
Speculation – Betting on price moves with limited risk.
Example: Buy a call if you think price will go up.
Income Generation – Selling (writing) options to collect premiums.
Example: Covered calls strategy.
4. Option Pricing: The Greeks & Premium
An option’s price (premium) depends on several factors:
Intrinsic Value: The real value (difference between stock price & strike price).
Time Value: Extra cost due to time left until expiry.
Volatility: Higher volatility = higher premium (more chances of big moves).
The Option Greeks measure sensitivity:
Delta: How much option moves with stock.
Theta: Time decay (options lose value as expiry nears).
Vega: Impact of volatility changes.
Gamma: Rate of change of delta.
5. Strategies in Option Trading
This is where options shine. Traders can design strategies based on market outlook.
Bullish Strategies:
Buying Calls
Bull Call Spread
Bearish Strategies:
Buying Puts
Bear Put Spread
Neutral Strategies:
Iron Condor
Butterfly Spread
Income Strategies:
Covered Calls
Cash-Secured Puts
Options allow creativity – you can profit in rising, falling, or even stagnant markets.

ICICIBANK 1D Time frameCurrent Snapshot
Price is around ₹1,402 – ₹1,420.
Stock is facing some short-term weakness, trading close to or slightly below short-term averages.
Longer-term trend is still stable as the price is well above its 200-day moving average.
⚙️ Indicators / Momentum
RSI (14): Neutral zone, not overbought or oversold.
MACD: Mixed, showing weak bearish pressure in the short term.
Moving Averages:
Short-term (5–10 day) → Mixed / sideways.
Medium-term (50–100 day) → Acting as resistance.
Long-term (200 day) → Still supportive, trend remains intact.
📌 Key Levels
Immediate Resistance: ₹1,440 – ₹1,450.
Immediate Support: ₹1,394 – ₹1,400.
Stronger Support: ₹1,340 – ₹1,350 zone.
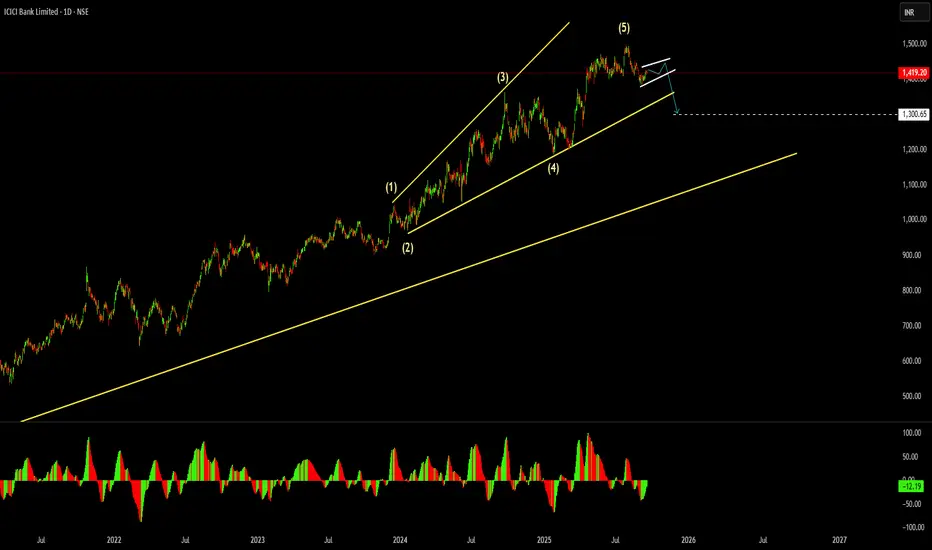
Classic Example of Expanding Ending diagonal ( Maga Phone) The visual representation suggest the Pattern have already completed its Move
some call it Expanding Ending diagonal OR Maga Phone Ending Sequence
Based on my Experience let the flag pattern complete marked in white lines
crack of flag will result momentum below the Maga Phone Cannel line
This is education content Only
Good luck
ICICIBANK 1D Time frameCurrent Stock Price
Current Price: ₹1,421.60
Day’s Range: ₹1,420.00 – ₹1,426.10
52-Week Range: ₹1,186.00 – ₹1,500.00
Market Cap: ₹10.17 lakh crore
P/E Ratio (TTM): 18.01
EPS (TTM): ₹74.05
Dividend Yield: 0.77%
Book Value: ₹436.67
📈 Trend & Outlook
Short-Term Trend: Bullish; the stock is trading near its 52-week high, indicating strong investor confidence.
Resistance Levels: ₹1,426.10 (day’s high), ₹1,500.00 (52-week high).
Support Levels: ₹1,420.00 (day’s low), ₹1,400.00 (psychological support).
Investor Sentiment: Positive, with strong institutional interest and favorable analyst outlooks.
🧭 Analyst Insights
Valuation: The stock is trading at a P/E ratio of 18.01, which is slightly below the sector average of 19.82, suggesting potential value.
Growth Prospects: The bank's strong earnings growth and robust capital position support its premium valuation.
ICICIBANK 1D Time frameCurrent Price: ₹1,422 (approx)
Previous Close: ₹1,417.70
52-Week Range: ₹1,186 – ₹1,500
🔹 Support & Resistance (Daily)
Immediate Support: ₹1,390 – ₹1,392
Next Support: ₹1,360 – ₹1,365
Immediate Resistance: ₹1,407 – ₹1,415
Next Resistance: ₹1,416+
my analysis for icici bankon daily tf price turned -ve and on ltf 1 hr price is retracing towards htf resistance areas.

Part 1 Trading Master ClassIntroduction to Options
Financial markets offer multiple instruments to trade: equities, futures, commodities, currencies, bonds, and derivatives. Among derivatives, options stand out as one of the most flexible and powerful tools available to traders and investors.
An option is not just a bet on direction. It’s a structured contract that can protect a portfolio, generate income, or speculate on volatility. Unlike buying stocks, where profits are straightforward (stock goes up, you gain; stock goes down, you lose), option trading allows for non-linear payoffs. This means you can design trades where:
You profit if the market goes up, down, or even stays flat.
You control large exposure with limited capital.
You cap your risk but keep unlimited potential reward.
Because of this flexibility, options have become an essential part of modern trading strategies across the world, from Wall Street hedge funds to Indian retail investors trading on NSE’s F&O segment.
What are Options? Basic Concepts
At its core, an option is a contract between two parties:
Buyer of the option → Pays a premium for rights.
Seller (writer) of the option → Receives the premium but takes on obligations.
Definition
An option is a financial derivative that gives the buyer the right, but not the obligation, to buy or sell an underlying asset at a predetermined price (called strike price) on or before a certain date (expiry date).
Underlying assets can be:
Stocks (Infosys, Reliance, Apple, Tesla)
Indices (Nifty, Bank Nifty, S&P 500)
Commodities (Gold, Crude oil)
Currencies (USD/INR, EUR/USD)
