Reliance Industries //1 day Support and ResistanceAs of April 29, 2025, here are the key daily support and resistance levels for Reliance Industries Ltd (NSE: RELIANCE) based on recent technical analyses:
📈 Daily Support and Resistance Levels
Level Type Value (₹)
Support 1 (S1) ₹1,191.37
Support 2 (S2) ₹1,177.43
Support 3 (S3) ₹1,153.37
Resistance 1 (R1) ₹1,229.37
Resistance 2 (R2) ₹1,253.43
Resistance 3 (R3) ₹1,267.37
These levels are derived from recent technical analyses and can serve as potential reversal or breakout zones for the stock.
📊 Additional Technical Indicators
Relative Strength Index (RSI): Approximately 48.94, indicating a neutral to slightly bearish momentum.
Moving Averages:
5-Day Simple Moving Average (SMA): ₹1,210.41
50-Day Simple Moving Average (SMA): ₹1,213.72
200-Day Simple Moving Average (SMA): ₹1,216.23
The stock is trading near its short-term moving averages, suggesting a consolidation phase.
📌 Key Observations
Resistance Levels: If Reliance Industries breaks above ₹1,229.37, it may face resistance at ₹1,253.43 and ₹1,267.37.
Support Levels: A decline below ₹1,191.37 could lead to further support at ₹1,177.43 and ₹1,153.37.
Trend Analysis: The stock is currently trading within a range, with key levels at ₹1,229.37 on the upside and ₹1,191.37 on the downside. A breakout above or below these levels could indicate the next directional move.
Please note that these levels and indicators are based on historical data and technical analysis, and actual market conditions may vary. It's advisable to conduct further research or consult with a financial advisor before making investment decisions.
Trade ideas

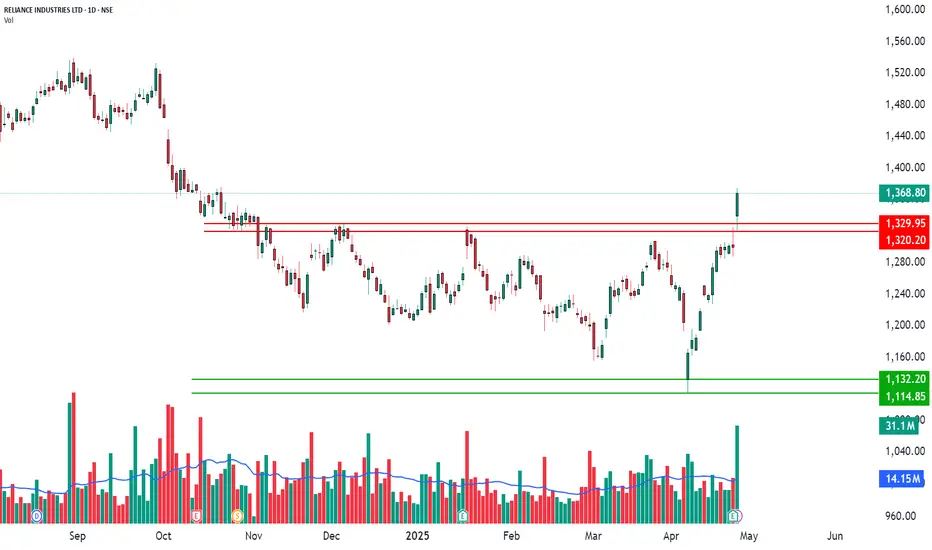
Strong Bullish Breakout! | Daily Time Frame📈 RELIANCE INDUSTRIES LTD – Strong Bullish Breakout!
📅 Date: April 28, 2025
📈 Timeframe: Daily Chart
🔍 Stock: Reliance Industries Ltd (NSE)
📌 Technical Overview:
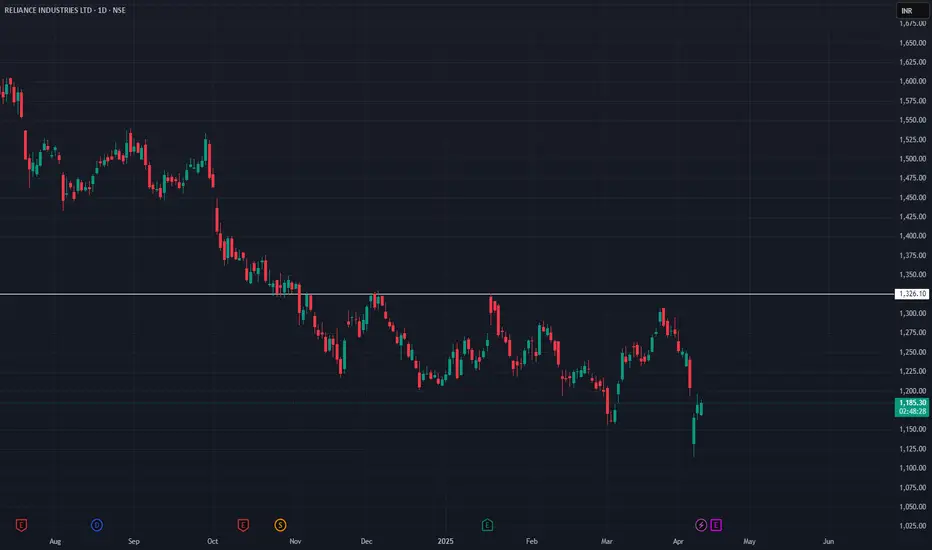
Reliance Industries has shown strong bullish momentum after breaking out above the important level of ₹1300.90.
Several indicators are supporting this breakout:
✅ RSI Breakout – Showing strong strength.
✅ Bollinger Bands Breakout – Price is breaking outside the bands, showing heavy momentum.
✅ Bullish VWAP Trend – Price is trading well above the VWAP line.
✅ TTM Squeeze Breakout – Major squeeze breakout confirms buyers' control.
🧩 Key Levels:
Major Resistance Broken: ₹1300.90 ✅
Immediate Support Now: ₹1329.95 and ₹1320.20 (red lines)
Next Possible Support: ₹1132.20 and ₹1114.85 (green lines, if reversal happens later)
📊 Volume Analysis:
Heavy spike in volume confirming strong buying activity.
🧠 Observational Bias:
As long as the price stays above ₹1300.90, the momentum remains bullish.
Small dips toward support can be seen as healthy pullbacks.
Reliance : A reliable stock in tough times#RelianceIndustries is on 🔥!
Over the weekend, Reliance Industries delivered stellar results — beating expectations and setting a strong, positive tone for the future! 📈
Today, the stock looks ready to break out after a long consolidation phase. Eyes are now set on the key resistance zone between ₹1480 - ₹1530 — a breakout above this could unlock serious upside potential! 🎯
🛡️ On the downside, ₹1200 remains a rock-solid support level, aligning with its 200-week EMA. Only a major negative event could shake it below this mark — but for now, the momentum is very much with the bulls. 🐂
📊 Valuations? The stock is trading at a P/E of ~26, exactly in line with its 5-year historical average — meaning it’s fairly priced even after the recent gains.
🌟 Plus, the much-anticipated Reliance Retail IPO is gearing up, adding an extra layer of sentimental support that could keep any major corrections in check.
Bottom Line: Having Reliance in your portfolio right now feels like playing with the trend, not against it. 🚀
#Reliance #StockMarket #Breakout #Investing #RelianceRetail #Nifty50 #Jio

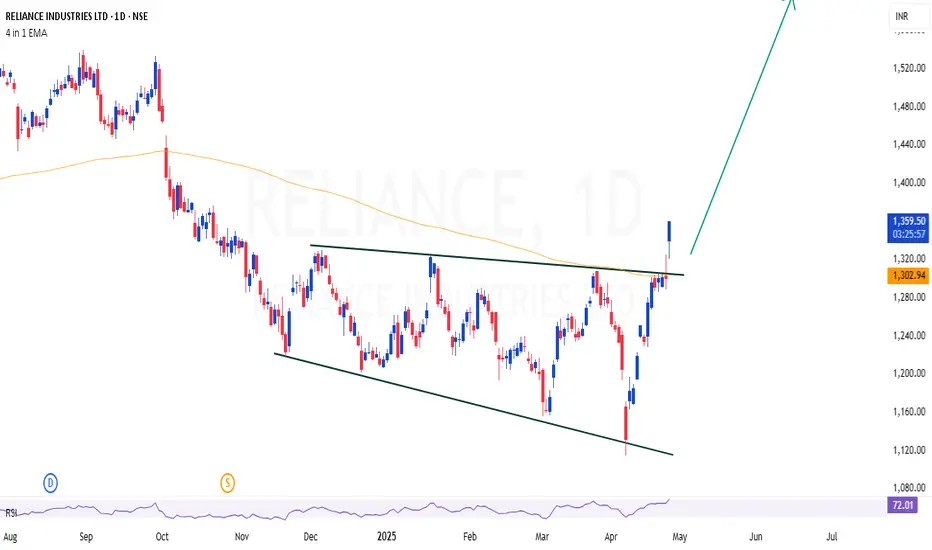
RELIANCE | Lets join hands with Ambani - Looks good for 20% shorRELIANCE | Lets join hands with Ambani - Looks good for 20% short term
Simple trendline (Channel) breakout
CMP : 1359
SL : 1250
Target : 1600
Reliance buy given near 1160-50 enjoy huge profit trail sl 1280How to take trades using Harmonic pattern projection Trade setup is explained below :-
Entry : 1st SL point : 0% is recent top or bottom.
Trailing D: 15.1% is work as trailing SL of buy or sell trade if hit then we have to book profit
.If price goes below 2nd D 22.5% to 24.5% range then early traders can make fresh reversals trade after breaking 1st D 15.1% safe traders can reversal trade after breaking Point D 22.5.4% to 24.5% range
Targets :
Target T1 : 36.1% to 38.3%
Target T3 : 49.1% to 52.5%
T3: 60.9% to 64.8% is our 3rd Target since this is reversal zone so must book profit if break then take fresh trade again
Target T4 : 76.4% to 79.7%
Next Targets are 100% , 127.2% ,141.4% and final Target 161.8%.
How to take reversal trade :
If price going upside/ downside then then buy or sell levels appear on Chart ( Automatically show when price reach any reversal zone of harmonic projection ).
Trailing SL:
After reach 1st Target trail SL to just above or below cost ( for example we are holding sell trade from 100 1st Target 110 hit then move trailing sl to 104-105 and move SL as price move upside or Downside)
Re- Entry :
For Re-entry in any pull back Point D ( 15.1% ) is used for re-entry then SL recent high or low Point SL ( 0% ) .
Blue Line is 1st support/ Resistance
Green line is 2nd support/ resistance
Red line is 3rd Support/ resistance

Option TradingIn trading, an option is a contract that gives the holder the right, but not the obligation, to buy or sell an underlying asset (like a stock) at a specified price (the strike price) by a certain date (the expiration date). This right is purchased for a premium, and the holder can choose to exercise the option, sell it before expiration, or let it expire worthless.

Candlesticks Pattern Part 2A bullish candlestick is typically green or white and means the closing price is higher than the opening price, indicating upward momentum. Inversely, a bearish candlestick, generally red or black, signals that the closing price was lower than the opening price, reflecting downward pressure.

RELIANCE BULLISHRELIANCE INUSTRIES LTD is looking strong upside.
Entry for swing trade
You can go for it after doing your own analysis.
entry price, target and stop loss has been updated in the chart.
ONLY FOR EDUCATIONAL PURPOSE..!
Candlestick PatternCandlestick patterns are a visual representation of price movements in financial markets, used in technical analysis to identify potential future price movements. Each candlestick represents price action (open, high, low, close) over a specific period, and the combination of these candlesticks forms patterns that can suggest market sentiment and potential trends.

How to Trade ?Open a Demat account. The first step is to open a Demat account, which serves as a digital repository for your stocks. ...
Understand stock terms. ...
Bids and asks. ...
Fundamental and technical knowledge of stocks. ...
Learn to set stop loss orders. ...
Seek expert advice. ...
Start with safer stocks.

Option and Database TradingAn option chain has several key characteristics that provide valuable information to traders:
Underlying asset. The first element to consider is the underlying asset itself. ...
Expiration dates. ...
Strike prices. ...
Option type. ...
Option symbols. ...
Bid and ask prices. ...
Volume and open interest. ...
In-The-Money (ITM)

RSI (Relative Strength Index)The Relative Strength Index (RSI) is a technical indicator used in financial markets to measure the speed and magnitude of price changes, typically used to identify overbought or oversold conditions. It oscillates between 0 and 100, with readings above 70 often suggesting an asset is overbought and below 30 suggesting it's oversold

Reliance Industries Limited (RIL)Reliance Industries Limited is India’s largest conglomerate by market value, it operates across energy, petrochemicals, retail, telecommunications, and digital services, driving India’s economic growth and innovation.
Key Business Segments
Energy & Petrochemicals:
Oil & Gas: Exploration, refining (Jamnagar – world’s largest refinery), and marketing.
Petrochemicals : Polymers, polyester, and specialty chemicals.
New Energy: Solar, green hydrogen, and battery storage projects (₹75,000 crore investment announced).
Retail: Reliance Retail: India’s largest retailer with 18,500+ stores (brands: JioMart, AJIO, Reliance Fresh, Trends).
Partnerships with global brands (e.g., Burberry, Tiffany, 7-Eleven).
Digital Services: Jio Platforms: Revolutionized telecom with 4G/5G services (450M+ subscribers).
Digital ecosystem: JioFiber, JioSaavn, JioCinema, and Jio Payments Bank.
Media & Entertainment: Network18 Group: TV channels (CNN-News18, Colors) and digital platforms (Moneycontrol).
Healthcare:
Reliance Life Sciences: Biopharma, medical devices, and genomics.
Global Partnerships & Investments
Strategic investors in Jio Platforms: Meta (Facebook), Google, Intel, Qualcomm, and Saudi Aramco.
Acquired global brands (e.g., Hamleys, Campa Cola).

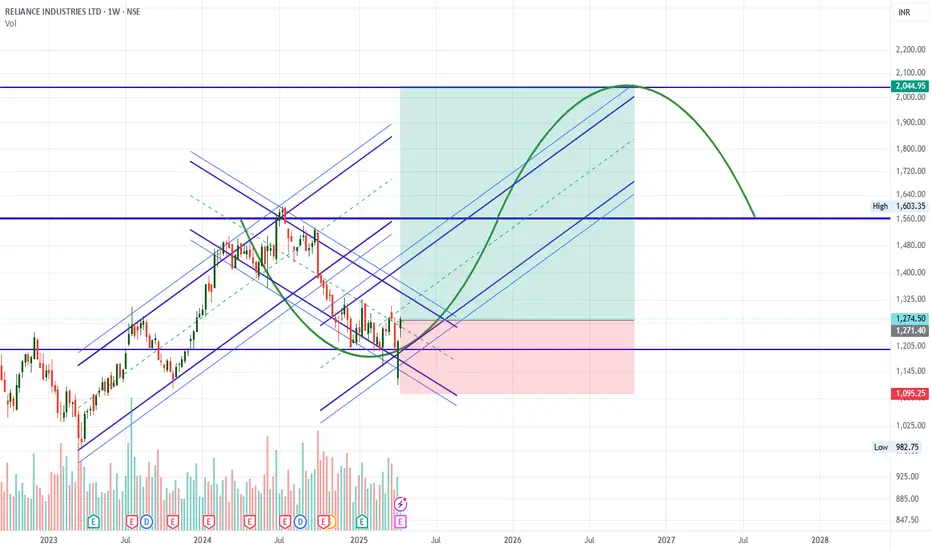
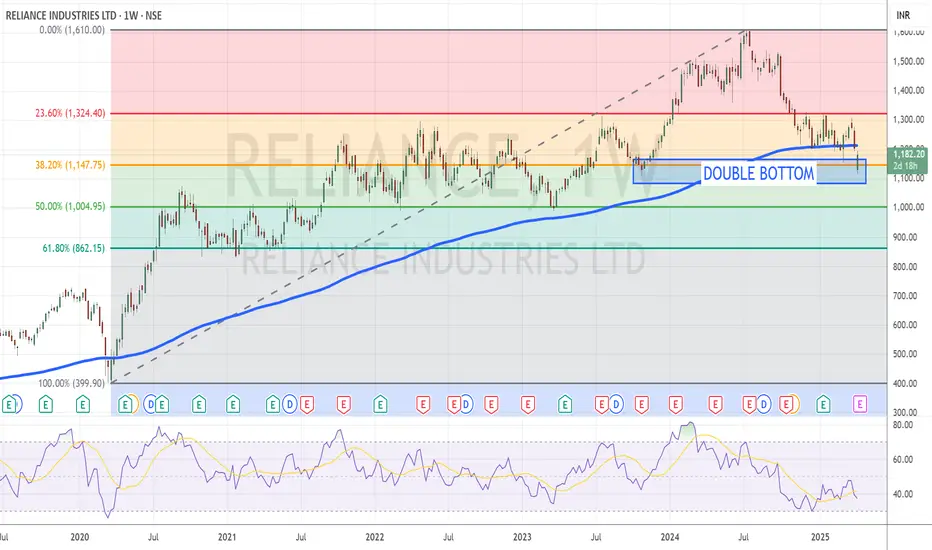
RIL Weekly Chart suggest Bottom formation done - 60% upsideRIL Weekly Chart suggest Bottom formation done - 60% upside possible in next 1.5-2 Years.
LTP - 1275
SL - 1100
Targets - 2050+
Timeframe - 1.5-2 Years.
Happy Investing.
Reliance again buy near 1170-1150 for long term 1350 1st Target How to take trades using Harmonic pattern projection Trade setup is explained below :-
Entry : 1st SL point : 0% is recent top or bottom.
Trailing D: 11.4% is work as trailing SL of buy or sell trade if hit then we have to book profit
.If price goes below 2nd D 21.4% to 23.6% range then early traders can make fresh reversals trade after breaking 1st D 11.4% safe traders can reversal trade after breaking Point D 21.4% to 23.6% range
Targets :
Target T1 : 35.1% to 38.3%
Target T3 : 49.1% to 53.2%
T3: 60.9% to 64.8% is our 3rd Target since this is reversal zone so must book profit if break then take fresh trade again
Target T4 : 76.4% to 79.7%
Next Targets are 100% , 127.2% ,141.4% and final Target 161.8%.
How to take reversal trade :
If price going upside/ downside then then buy or sell levels appear on Chart ( Automatically show when price reach any reversal zone of harmonic projection pattern based .
After showing reversal levels wait for confirmation until 21.4% or 28.3 % level not break if break then exit from current buy / sell trade and take fresh reverse trade buy/ sell .
Trailing SL:
After reach 1st Target trail SL to just above or below cost ( for example we are holding sell trade from 100 1st Target 110 hit then move trailing sl to 104-105 and move SL as price move upside or Downside)
Re- Entry :
For Re-entry in any pull back Point D ( 11.4% ) is used for re-entry then SL recent high or low Point SL ( 0% ) .
Blue Line is 1st support/ Resistance
Green line is 2nd support/ resistance
Red line is 3rd Support/ resistance

A STRADDLE COVERED CALL FOR RELIANCE Reliance is in a range for the last six months generating a zero returns Here's strategy to make money
.Since you already own RIL shares, let’s use the ₹1,190 strike for both call & put:
ATM range = 1,180–1,190)
OI chart + option chain:
Highest OI buildup is at ₹1,200 CE & PE → classic institutional interest zone
Premiums are still juicy due to high IV
Strong support visible below ₹1,150 on the chart
₹1,338 = long-term resistance (not in current play, but a stretch target)
Option Strike Premium (LTP)
Sell Call ₹1,190 ₹47.00
Sell Put ₹1,190 ₹48.00
👉 Total Premium Collected = ₹95 per share
👉 Lot Size = 500 *95-47500 💰
Breakeven Zone (on expiry)
Upper Breakeven = ₹1,285 (₹1,190 + ₹95)
Lower Breakeven = ₹1,095 (₹1,190 – ₹95)
Safety Tip (Optional Hedge)
If you want to sleep even deeper:
Buy a deep OTM ₹1,050 PE as disaster insurance (~₹10–15)
Reliance Eyes Reversal from Key SupportTopic Statement:
Reliance has undergone a healthy correction in line with the broader market and is showing signs of a potential reversal from key support levels.
Key Points:
- The stock is taking strong support at the 38.2% Fibonacci retracement level near ₹1147.
- Candlestick pattern indicates the formation of a potential double bottom.
- Price is trading below the 180-day EMA, suggesting an oversold condition.
- Weekly RSI stands at 37.5, further confirming the stock is in an oversold zone.
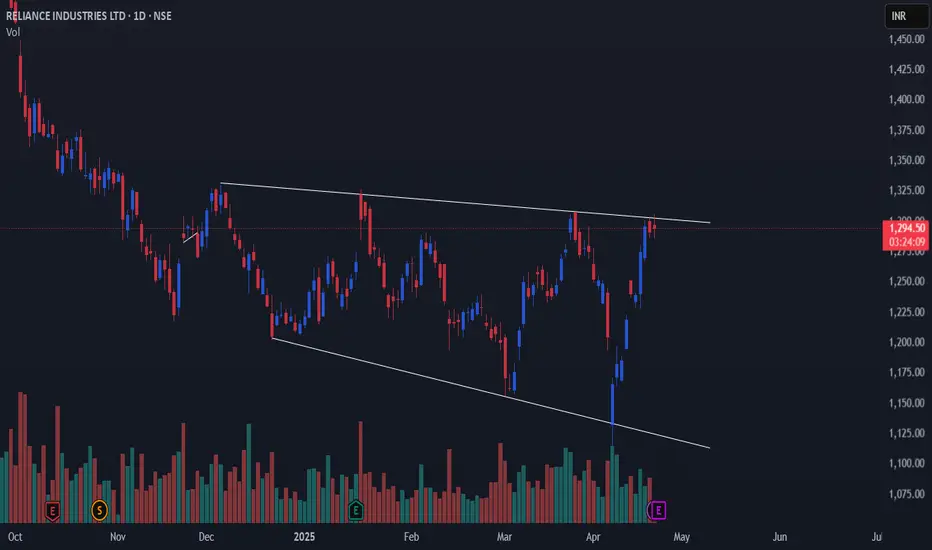
RELIANCE INDUSTRIES – Buying Zone Test with Reversal PotentialRight now, the stock is respecting a long-standing falling channel, and it has just bounced off the lower boundary of the pattern near the marked Buying Zone.
The stock has been consolidating for the past 9 months inside a downward-sloping channel, and this retest could serve as the ignition point for a trend reversal.
All important levels have been marked on the chart.
Looking at the price action and structure, there's a high probability that RELIANCE can move towards ₹1,325 in the coming weeks if the reversal holds.
Volume surged near the bottom, hinting at smart money accumulation. Entering near ₹1,110–₹1,120 zone gives a solid
Risk: Reward :: 1 : 3.3
Support Levels:
🔹 ₹1,165 – Minor demand zone
🔹 ₹1,110 – Major support and channel lower trendline
🔹 ₹1,085 – Last swing low, demand base
Resistance Levels:
🔹 ₹1,204 – First level of resistance
🔹 ₹1,280 – Mid-channel upper zone
🔹 ₹1,325 – Short-term breakout target
Reasons:
✅ 9-month falling channel
✅ Strong bounce off major support (Buying Zone)
✅ RSI rebounding from oversold territory
✅ Volume spike at support = potential smart money entry
✅ Favorable R:R for positional entry
✅ Potential early reversal before breakout
News & Sentiment:
No major negative news post-recent drop. The correction seems technical, and long-term sentiment remains optimistic especially around expected earnings and energy sector momentum.
Verdict:
Bullish
Plan of Action:
Enter on strength above ₹1,175 or on dip near ₹1,120 zone with volume confirmation.
BUY: ₹1,120–₹1,175
Stoploss: ₹1,085
Target: ₹1,325
Trailing SL: ₹25–₹30

RELIANCE READY TO FALL 30 POINTS 1%++Reliance weak below 1269
Current market price 1275
Wait for Active
Sell below 1269
Stoploss 1282........13 points
Target1................1259...10 points
Target2................1239...30 points
Disclaimer - This level only for educational purpose and papertrade Do ur own analysis

RELIANCE🔹 RELIANCE – Short-Term/Intraday Outlook 🔹
👀 Keep an eye on the Fib support zone near 1267.
🔻 Staying below this level may lead to further price erosion toward the 1237-1235 zone.

My Favorite Reversal Candle Pattern (Works Like Magic!)Hello Traders!
What if I told you that one single candlestick pattern could give you an 80% win rate — when traded with the right context and strategy? That’s right! Today, we’re talking about the powerful Engulfing Candlestick Pattern — backed by data, tested across timeframes, and loved by price action traders.
Let’s break it down properly so you can spot it, trade it, and win with it.
The Candle Setup: Bullish & Bearish Engulfing Patterns
Bullish Engulfing Pattern:
This forms at the end of a downtrend or pullback . A strong green candle completely engulfs the previous red candle’s body, signaling a shift from sellers to buyers.
This setup is most effective at key support zones, trendline bounces, or bullish reversals with volume confirmation .
Bearish Engulfing Pattern:
Seen after an uptrend or rally . A solid red candle engulfs the previous green candle’s body, showing a shift from buyers to sellers.
Best used near resistance levels, psychological zones, or after a parabolic price move .
Check the chart above to understand better!
Note: I’ve used real chart examples from the past to demonstrate Bullish & Bearish Engulfing patterns exactly as they appear in price action textbooks — so you can recognize them with clarity and confidence.
How to Trade the Engulfing Candle Effectively
Entry:
Enter above the bullish engulfing candle’s high (long) or below the bearish engulfing candle’s low (short) after the candle closes.
Stop Loss:
Place SL just below the bullish engulfing candle's low or above the bearish candle’s high.
Target:
Use a 1:2 or 1:3 risk-reward ratio, or set targets based on nearby support/resistance or Fibonacci levels.
When to Use:
Only trade engulfing patterns when they form at a confluence zone — such as support/resistance, trendlines, moving averages, or breakout retests .
Backtesting Insights
When tested across Nifty 50, Bank Nifty, and large-cap stocks on the 15 min, 1H, and Daily charts , the Engulfing pattern — when combined with structure — showed up to 80% success rate with proper risk management and discipline.
Rahul’s Tip
Don’t blindly trade the pattern—trade the location! Context is everything. Always confirm with structure and volume. Engulfing candles are powerful, but only when they appear where it actually matters.
Conclusion
The Engulfing Candle is one of the most reliable patterns if traded with patience and planning. Combine it with key zones and risk control , and it can become a high-probability weapon in your trading arsenal.
Have you used this pattern before? Share your success (or lessons) in the comments — let’s grow together!

Reliance | Upcoming Possible MovementsCurrently stock trading at support area (multiple time frames) of 1280
A small upside possible from here
But as we can see it has broken a trend line / channel, so any pullback on upside may trigger a fresh selling for the downside strong support area of 1260 (as it also happens to be a flip zone)
1260 can be considered as a strong support area
Any sideways accumulation on that area will possible trigger a strong upside movement
Lower time frame confirmation must be taken before entering at any levels

Bullish reversal in #RelianceThere is a formation of Bullish Head and Shoulders pattern on the daily chart of Reliance. The left shoulder and the head are already formed. The right shoulder is also half complete. There are good chances that the shoulder will complete.
The neckline is at 1320 which is around 100 Rs far from CMP of 1225.
#reliance #bullish
