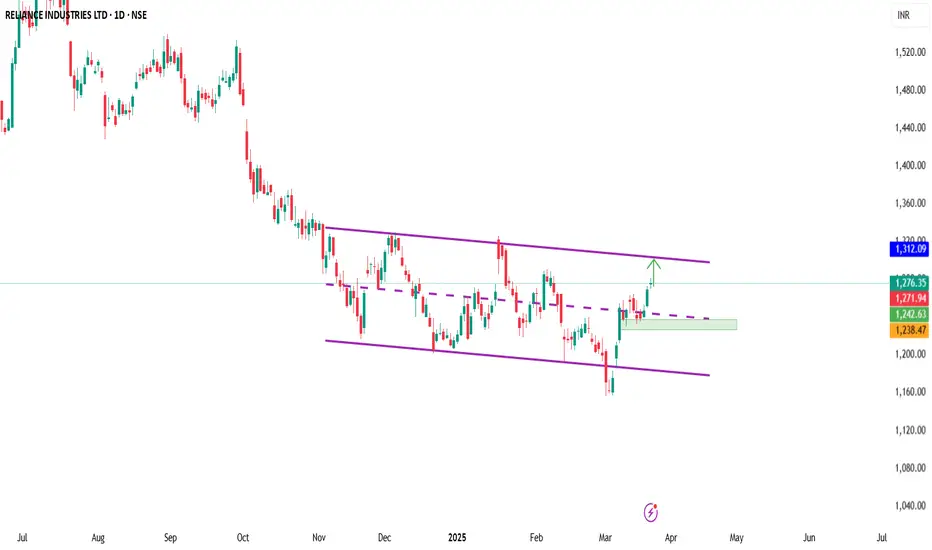
view on reliancereliance can do 1290-1310-1328 if it sustains above 1270-1280. if failed to do so back to 1260-1247.
Trade ideas
BUY RELIANCE FOR MID TO LONG TERM
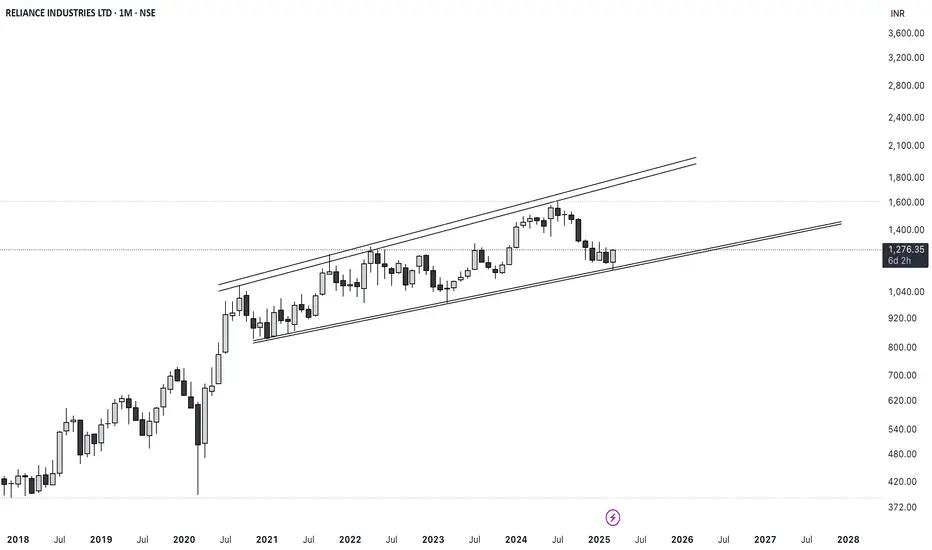
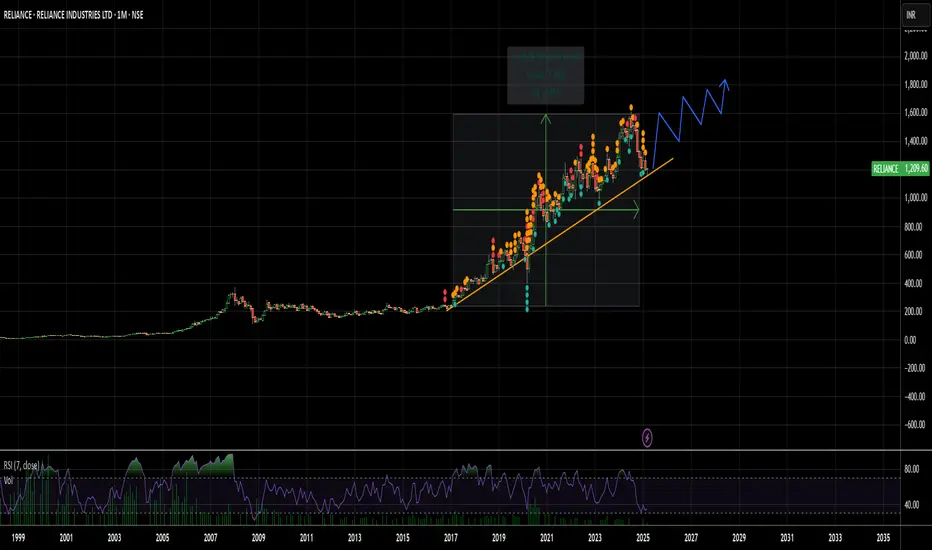
• The stock is trading within an upward channel, showing a long-term bullish trend.
• It has recently touched the lower trendline of the channel, suggesting a potential support level.
• The current price is 1,276.35, which is near the lower boundary of the trendline, making it a possible buying opportunity.
• A bullish candle at this level could confirm a reversal.
• Stop-loss: Below the lower trendline (around 21,150 to 21,200). Short-term target: 1,400 - 1,500 (if it bounces from support).
2. Medium-term target: 1,600 - 1,700
(previous high).
3. Long-term target: 1,900 - 2,000
(upper channel resistance).
Reliance industries holding buy from 1180 ,1315 to 1330 Target If we have profit above 300 points in gold and 500-600 points on silver always trail sl to cost so we can't get any loss in profitable trades .
This is applicable for all trades if we fave more than 0.5% points profit then always trail sl to cost
WHERE DOES RELIANCE INDUSTRIES STAND AS OF 13th MARCH 2025we are about to complete Wave e of Wave 4 and we still have long way to go before we see some sunshine, what this means we still have wave 5 to complete. Please refer the below charts which I posted in the past.
Disclaimer: I am not SEBI registered member and these ideas are meant only for educational purposes only

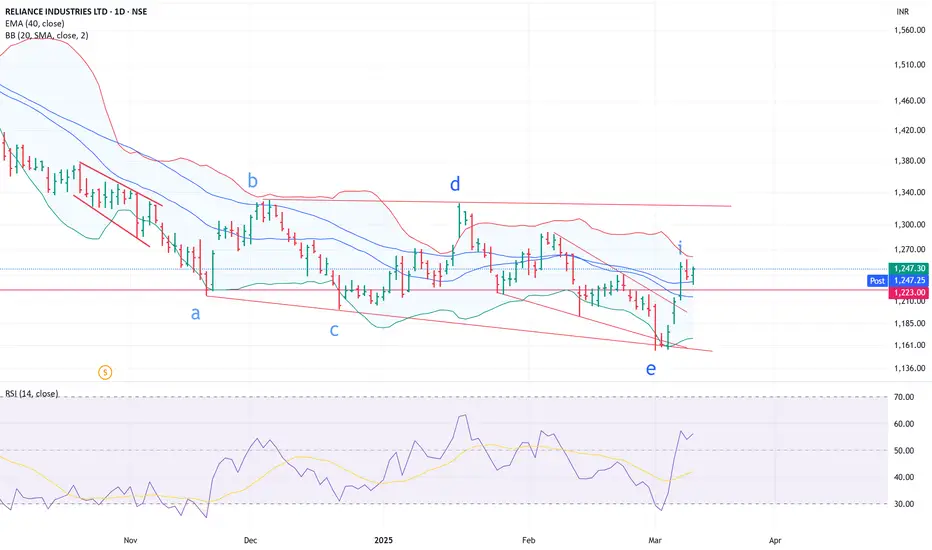
Reliance Industries Daily chart and Wave CountRIL can look like an expanding triangle - triangles are five wave structures that are usually marked as a-b-c-d-e. Triangles can be trend continuation and trend reversal patterns.
Reliance Industries: Bullish Momentum with Strong Support LevelsTechnical Analysis:
The Reliance stock has exhibited an insatiable bullish trend in the last three decades. In particular, in 2020, the stock witnessed a strong resistance level around ₹1000-₹1050, which was tested repeatedly during 2020-2021. However, in August 2021, this resistance level was broken, becoming a powerful support level in 2022-2023.
The stock then developed a new resistance of ₹1250-₹1285, which was broken in December 2023, resulting in an all-time high of ₹1608 in July 2024. Post this high, the market went into a correction, falling to ₹1156. Even in the fall, the stock kept developing a series of higher lows, which is a positive signal. The series of higher lows are:
₹830 (initial higher low)
₹871 (second higher low)
₹989 (third higher low)
₹1156 (latest higher low)
The stock has given a strong pullback from ₹1156 and is currently at ₹1251. The ₹1250-₹1285 range is a key resistance. If the stock takes out this resistance and confirms support with bullish candlestick patterns, it may result in a retest of the all-time high levels.
The recent sharp pullback from ₹1156 is in line with recent market trends and improving investor sentiment. Traders need to watch out for a breakout above ₹1285, as it may lead to more bullishness.
Fundamental Analysis:
Reliance announced strong Q3 FY25 financials, reflecting steady growth in income and profits. The following are the major financial numbers (figures in ₹ crore):
Total Income: ₹2,43,865 in Q3 FY25, ₹2,34,956 in Q2 FY25, ₹2,27,970 in Q3 FY24.
Total Expenses: ₹2,13,257 in Q3 FY25, ₹2,06,573 in Q2 FY25, ₹2,00,217 in Q3 FY24.
Profit Before Tax: ₹30,608 in Q3 FY25, ₹28,383 in Q2 FY25, ₹27,753 in Q3 FY24.
Profit After Tax: ₹18,540 in Q3 FY25, ₹17,394 in Q2 FY25, ₹17,265 in Q3 FY24.
The overall revenue of the company went up 3.8% QoQ from ₹2,34,956 crore in Q2 FY25 and 7% YoY from ₹2,27,970 crore in Q3 FY24. Profit before tax has grown steadily, up 7.8% QoQ and 10.3% YoY. So has profit after tax, affirming Reliance's robust financial position.
Current Market News and Investments
Reliance Industries Ltd has recently made a significant investment proposal of ₹50,000 crore in Assam within the next five years, underlining its focus on local development. The investment was underscored at the Advantage Assam Summit, where Reliance's top leadership reaffirmed their priority on Assam's development during Prime Minister Narendra Modi's tenure.
The major themes of the announcement are:
Strategic investment in Assam to enhance economic growth and employment.
"Act East, Act Fast, Act First" slogan, making Assam a center of opportunities in Southeast and East Asia.
Enhanced connectivity in Assam, physical, digital, and emotional connections with the rest of India.
The dream of turning Assam from the "Tea Paradise" to a technology and innovation hub of the world.
This announcement has further strengthened investor confidence, contributing to the recent pullback from ₹1156. Investors and traders should closely watch how these developments impact Reliance’s future financials and stock movement.
Conclusion:
Reliance remains bullish in nature with the help of higher lows and robust finances. If the stock breaches the resistance zone of ₹1250-₹1285, it may approach all-time highs. Traders and investors can watch the breakout point closely along with important support points for risk management.
Disclaimer: This analysis is for educational purposes only. Investors should make their own decisions prior to any trading.

macd trading# **MACD Trading Strategy**
MACD (**Moving Average Convergence Divergence**) is a momentum indicator used to identify **trend strength, reversals, and entry-exit points**.
## **1️⃣ Key Components**
✅ **MACD Line:** Difference between the 12-day and 26-day EMA.
✅ **Signal Line:** 9-day EMA of the MACD line (triggers buy/sell signals).
✅ **Histogram:** Shows the gap between MACD and Signal Line (momentum strength).
## **2️⃣ Trading Strategies**
✅ **MACD Crossover:**
🔹 **Bullish:** MACD crosses above the Signal Line → Buy.
🔹 **Bearish:** MACD crosses below the Signal Line → Sell.
✅ **MACD Divergence:**
🔹 **Bullish Divergence:** Price makes lower lows, MACD makes higher lows → Uptrend reversal.
🔹 **Bearish Divergence:** Price makes higher highs, MACD makes lower highs → Downtrend reversal.
### **Conclusion**
MACD is a reliable tool for **trend confirmation and momentum analysis**. Combining it with **support-resistance and volume** enhances trade accuracy. 🚀

Reliance Industries LtdReliance was founded by Dhirubhai Ambani and is now promoted and managed by his elder son, Mukesh Dhirubhai Ambani. Ambani's family has about 50% shareholding in the conglomerate.
Key Points:-
OIL-TO-CHEMICALS SEGMENT (~57% of revenues)
Under the segment, the company primarily refines crude oil to manufacture/ extract transportation fuels, polymers and elastomers, intermediates and polyesters. It has plants and manufacturing assets located across India in Jamnagar, Hazira, Dahej, Nagothane, Vadodara and others. It has a crude refining capacity of 1.4 million barrels per day. It also has the largest single site refinery complex globally. It had a total throughput of ~77 million metric tonnes in FY22 out of which ~89% was meant for sale.
RETAIL SEGMENT (~23% of revenues)
The company is the largest retailer in India with various store concepts selling consumer electronics, fashion & lifestyle, groceries, pharma and connectivity. It operates ~15,200 retail stores and has a customer base of ~19 crore customers.Its store brands include Reliance fresh, digital, smart, Hamleys, Jio Outlets, netmeds, resQ, etc. It also operates various digital commerce platforms including JioMart, milkbasket, Reliance Digital, Ajio, zivame, urban ladder, netmeds and others. Some of its acquisitions under the segment include Justdial, 7-Eleven, milkbasket, Manish Malhotra, Clovia, Dunzo, etc.
Expansion - Reliance Retail undertook significant expansion in FY22 adding on avg. 7 stores every day and crossed the milestone of 15,000 stores.
DIGITAL SERVICES BUSINESS (Jio) (~11% of revenues)
Jio Digital is India's largest digital services platform with a total subscriber base of ~41 crore subscribers and a market share of 36% in India. It offers wireless connectivity, home broadband and enterprise and SMB broadband under its digital connectivity business. It carried ~10% of the global mobile data traffic in 2021.
Broadband Expansion - The company became the largest broadband provider in India with a market share of 50% within just 2 years of launch.
Shareholders of Jio - The company holds ~67% stake in Jio Platforms while the rest was sold by Reliance to major multinational corporates such as Meta (Facebook), Google, KKR, Vista Equity and others.
OIL & GAS E&P BUSINESS(~1% of revenues)
RIL as an integrated E&P Operator is India’s leading Deepwater Operator. Its domestic portfolio comprises of conventional oil and gas blocks in Krishna Godavari and Mahanadi basins and two Coal Bed Methane (CBM) blocks, Sohagpur (East) and Sohagpur (West) in Madhya Pradesh. The business saw a significant increase in gas production due to ramp-up of production from KGD6 block located in the Krishna-Godawari Basin. It went from producing 2% of India's total gas in Q3FY21 to ~20% in FY22.
Media & Entertainment Business
The company owns Network 18 Media which has presence across full spectrum of content genres such as news, entertainment, sports, movies and live entertainment. Its portfolio includes CNBC TV, Colors, MTV, nick, History tv and others. It also owns digital platforms such as moneycontrol, News 18, CNBC, firstpost, voot and bookmyshow.
Right now Indian Market is not supporting any long position at this moment, but the chart looks very attractive. however I am sharing with you all.I hope you will like & share this publication. Thanks for watching, follow us for more updates visiting again.

"Reliance on the Move: Is This the Start of a Major Reversal?"📢 Market Sentiment Poll: Where Do You See Reliance Industries Heading?
🔘 Bullish – Potential upside towards ₹1,400+ 🚀
🔘 Neutral – Likely to consolidate 📊
🔘 Bearish – Could dip below ₹1,200 📉
💬 Share your market insights in the comments! This poll is for educational purposes only and does not constitute financial advice. Always conduct your own research before making investment decisions.

MOTABHAI - First leg of Correction is over?TF: Daily
Looks like 5 wave impulse is complete (Blue)
Subwaves within each of the motive waves are marked in black
5th being Diagonal abcde
Awaiting breakout confirmation (the falling trendline - Red)

options and database trading# **Options and Database Trading**
Combining **Options Trading** with **Database Trading** can improve decision-making by leveraging **historical data, AI models, and statistical patterns** for better trade execution.
## **1️⃣ Options Trading Basics**
✅ **Call Options:** Right to buy at a fixed price (bullish view).
✅ **Put Options:** Right to sell at a fixed price (bearish view).
✅ **Key Strategies:** Covered calls, straddles, iron condors for different market conditions.
## **2️⃣ How Database Trading Enhances Options Trading**
✅ **Backtesting Strategies:** Uses **historical data** to test option strategies before execution.
✅ **Volatility Analysis:** Predicts market movements using **IV (Implied Volatility) & HV (Historical Volatility)**.
✅ **Real-Time Data Execution:** AI-driven models analyze **OI (Open Interest) and PCR (Put-Call Ratio)** for optimal trade entry.
## **3️⃣ Key Benefits of This Approach**
✅ **Data-Driven Trades:** Reduces emotional bias and improves accuracy.
✅ **Pattern Recognition:** Identifies high-probability setups based on past performance.
✅ **Automated Execution:** Faster decision-making using algorithmic models.
### **Conclusion**
Merging **database-driven insights** with **options trading** creates an **efficient, risk-managed, and profitable trading approach**. 🚀

PositionalNSE:RELIANCE looks like it's corrected a bit
The biggest stock is down
Can add on such levels if holding period is decades
Reliance Industries Long Term Chart Analysis 53% Upside PossibleHello everyone, i hope you all would be doing good in your life and your trading as well. Today i have brought an stock which is a ELEPHANT of indian market yes your guess is right, i am talking about Reliance Stock and it is trading inside the long-term trend within an upward rising channel. The price has tested both the upper resistance band and lower support band multiple times, confirming the channel's reliability. Currently, the stock is near the lower support band (1185-1155), making it a high-probability support zone for potential upside moves. A stop loss is placed at ₹986 in case of a breakdown.
The projected targets are set as follows: Short-term target: 1285, Second target: 1400, Medium-term target: 1532, and the Final long-term target: 1800. The analysis suggests a 53% potential upside if the stock respects the lower band and continues its bullish trajectory. Keep an eye on price action for confirmation before entry.
Disclaimer: This analysis is for educational purposes only. Please consult a financial advisor before making investment decisions.
If you Found this helpful? Don’t forget to like, share, and drop your thoughts in the comments below.

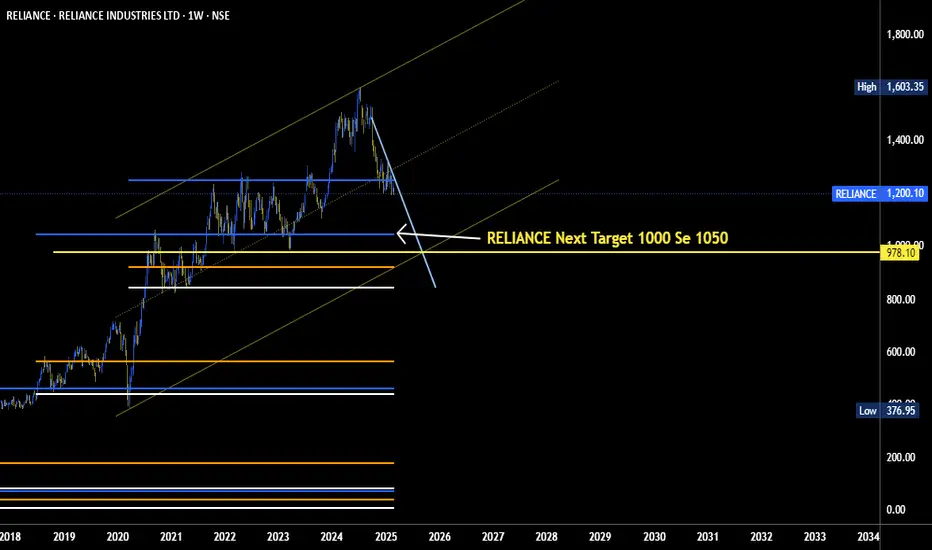
Reliance industries LTDReliance stock running in downtrend , Looking for Weekly and Monthly demand zone Rs 950

Reliance: Leading the Market Correction & Nearing Strong SupportTopic Statement:
Reliance has undergone a sharp correction in recent months, significantly influencing the broader market downturn, but key technical levels suggest a potential stabilization.
Key points:
1. The stock has corrected to the 38.2% retracement level, receiving strong support.
2. Price is now below the 180-day exponential moving average, indicating oversold conditions.
3. Weekly RSI stands at 34, marking an oversold zone from a long-term perspective.

RelianceDate : 03.03.2025
Relaince
Timeframe : Weekly
Remarks :
1 Broke resistance cum support trendline starting since 2018
2 Broke 200 weekly exponential moving average after 2020 covid crash
3 At present at 38.2% which is make or break for stock
4 fresh short only below 38.2% & keep that as stoploss either side trades long/short
Regards,
Ankur

Reliance : Good Entry Point🚨 #Reliance Share – Opportunity or Caution? 🚨
📉 Why the Dip today ? Reliance shares are under pressure today, largely due to a potential ₹125 Cr fine for not setting up the battery unit.
📊 Key Levels to Watch:
🔻 Support: The stock is trading in a strong monthly demand zone of ₹1110-₹1180, with another support zone below. If it can hold ₹1000 in the coming months, a potential reversal rally could be on the cards.
🔺 Resistance: On the upside, ₹1330-₹1360 is a critical supply zone, aligned with the 20W EMA—a breakout above this could signal a trend reversal.
🚀 What’s the Catalyst?
The highly anticipated Reliance Retail IPO in 2025 could act as a strong fundamental support, reducing the chances of a major sell-off.
📌 Bottom Line: If Reliance defends key support levels, this dip could be an accumulation opportunity for long-term investors!
💬 What’s your take—Buy the dip or wait for confirmation? ⬇️
#learn_at_stoxsense #Learntradingwithsudhir #StockMarketIndia #Optiontrading #learntrading #sebiregisteredra #reliance

view on Reliance IndustriesStock name: Reliance Industries
current price: 1200
current support at 1200-1180, it can retest 1220-1240 and may remain in 1240-11800 range.
below 1180 stock can see more fall to 1150-1110
If it breaks resistance above 1240, upside target would be 1290+

Reliance Closed Below Danger level Now Time To Create New Short As of the latest available data, Reliance Industries Limited (RIL) is trading at approximately ₹1,199.60 per share, reflecting a 0.62% decline from the previous close. citeturn0news28 The stock remains 25.44% below its 52-week high of ₹1,608.95, reached on July 8, 2024. citeturn0search6
In recent developments, RIL's subsidiary, Jio Platforms, is developing a cloud-based AI personal computer accessible on any device, aiming to facilitate compute-intensive AI applications at low cost. citeturn0search3 Additionally, Reliance Retail has launched the Shein India Fast Fashion app, marking Shein's return to the Indian market after a previous ban. citeturn0news38
These initiatives underscore RIL's commitment to innovation and market expansion, potentially influencing its stock performance in the near future.
navlistRecent Developments in Reliance Industriesturn0news29,turn0news38,turn0news39
Reliance Target After Monthly Negative Closing is 1031**Reliance Industries Limited (RIL)** is India's largest conglomerate, with diversified businesses in **energy, petrochemicals, retail, telecommunications, and digital services**. It is one of the most valuable companies in India and among the world's largest corporations.
---
### **Key Facts About Reliance Industries:**
- **Founded:** 1958 (by Dhirubhai Ambani)
- **Founder:** Dhirubhai Ambani
- **Chairman & MD:** Mukesh Ambani
- **Headquarters:** Mumbai, India
- **Revenue:** Over **₹9 lakh crore ($110+ billion)** (varies yearly)
- **Stock Listing:** **NSE & BSE** (Ticker: **RELIANCE**)
- **Market Cap:** Among India's highest (over $200 billion)
---
### **Major Business Segments:**
#### **1. Energy & Petrochemicals**
- **Reliance O2C (Oil-to-Chemicals):** One of the world’s largest **refining & petrochemical** businesses.
- **Jamnagar Refinery:** World’s largest refining complex.
- **Renewable Energy:** Investments in **green hydrogen, solar, and battery storage** (Reliance New Energy).
#### **2. Reliance Jio (Telecom & Digital Services)**
- **Jio 4G & 5G:** India’s largest telecom provider.
- **Jio Platforms:** Digital services (JioFiber, JioCinema, JioCloud, etc.).
#### **3. Reliance Retail**
- India’s **largest retail company**, covering:
- **Grocery (Reliance Fresh, Smart Bazaar)**
- **Fashion (Trends, Ajio)**
- **Electronics (Reliance Digital, JioMart)**
#### **4. Media & Entertainment**
- Owns **Network18, Viacom18, JioCinema** (OTT platform).
#### **5. New Energy (Green Investments)**
- Investing **$75 billion** in green energy, hydrogen, and solar power.
---
### **Competitors:**
- **Telecom:** Airtel, Vodafone Idea
- **Retail:** Amazon, Flipkart, Tata Group
- **Energy:** Adani Group, ONGC, IOC
Reliance is constantly expanding into new sectors like **EV battery production, AI, and data centers**. Are you looking for stock insights, latest news, or specific business details? 🚀

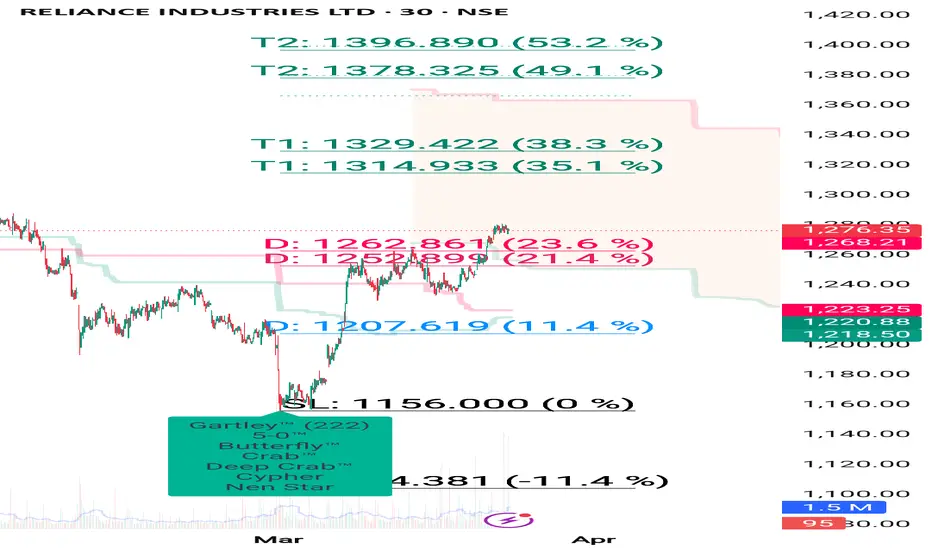
Reliance buy 1200 near for long term sl 1140 target 1340-60How to take trades using Harmonic pattern projection Trade setup is explained below :-
Entry : 1st SL point : 0% is recent top or bottom.
Trailing D: 11.4% is work as trailing SL of buy or sell trade if hit then we have to book profit
.If price goes below 2nd D 21.4% then early traders can make fresh reversals trade after breaking 1st D 11.4% safe traders can reversal trade after breaking 2nd D 21.4%
Targets :
Target T1 : 28.3% ( early trade if entry at 11.4% )
Target T1 : 35.1% to 38.2%
Target T3 : 50.1% to 53.2%
T3: 61.8% to 65.1% is our 3rd Target since this is reversal zone so must book profit if break then take fresh trade again
Target T4 : 76.4% to 79.7%
Next Targets are 100% , 127.2% ,141.4% and final Target 161.8%.
How to take reversal trade :
If price going upside/ downside then then buy or sell levels appear on Chart ( Automatically show when price reach any reversal zone of harmonic projection pattern based .
After showing reversal levels wait for confirmation until 21.4% or 28.3 % level not break if break then exit from current buy / sell trade and take fresh reverse trade buy/ sell .
Trailing SL:
After reach 1st Target trail SL to just above or below cost ( for example we are holding sell trade from 100 1st Target 110 hit then move trailing sl to 104-105 and move SL as price move upside or Downside)
Re- Entry :
For Re-entry in any pull back Point D ( 11.4% ) is used for re-entry then SL recent high or low Point D ( 0% ) .
Target is same as early 21.4% , 28.3 , 35.1 and so on
Blue Line is 1st support/ Resistance
Green line is 2nd support/ resistance
Red line is 3rd Support/ resistance

candlestick patterns **SkyTradingZone** is your go-to source for educational content on trading, covering market insights, strategies, and in-depth analysis. Our goal is to empower traders and investors with knowledge to navigate the markets effectively.
---
# **Candlestick Patterns – Part 1: Basics and Key Reversal Patterns**
Candlestick patterns are one of the most powerful tools in **technical analysis**. They help traders understand market sentiment and predict future price movements based on past price action.
📌 **Why Use Candlestick Patterns?**
✅ They provide **visual insights** into price action.
✅ They help identify **market reversals, trend continuations, and breakouts**.
✅ They work well when combined with **support & resistance, volume, and indicators** like RSI or MACD.
---
## **1️⃣ Understanding Candlestick Structure**
A candlestick consists of **four key components**:
📌 **Open** – The price at which the candle starts.
📌 **Close** – The price at which the candle ends.
📌 **High** – The highest price reached during the timeframe.
📌 **Low** – The lowest price reached during the timeframe.
🔹 **Bullish Candle (Green/White):** When the **closing price** is higher than the **opening price**, showing buyers are in control.
🔹 **Bearish Candle (Red/Black):** When the **closing price** is lower than the **opening price**, showing sellers are in control.
---
## **2️⃣ Types of Candlestick Patterns**
Candlestick patterns can be broadly classified into **two types**:
✅ **Reversal Patterns** – Indicate a possible change in trend.
✅ **Continuation Patterns** – Indicate that the trend will likely continue.
---
## **3️⃣ Key Reversal Candlestick Patterns**
### 📍 **A) Bullish Reversal Patterns**
1️⃣ **Hammer**
🔹 A small body with a **long lower wick** (shadow).
🔹 Appears after a **downtrend**, signaling a potential reversal.
🔹 **Indicates buyers have entered the market aggressively.**
📌 **Confirmation:** The next candle should be bullish with high volume.
🔹 **Example:** If Nifty 50 forms a hammer at a key **support level**, it could signal a trend reversal.
---
2️⃣ **Bullish Engulfing**
🔹 A **large green candle** completely engulfs the previous **red candle**.
🔹 Shows **strong buying pressure**, often leading to an **uptrend**.
📌 **Confirmation:** Must occur at a **support level or after a downtrend**.
🔹 **Example:** If a stock forms a **bullish engulfing pattern near a 200-day moving average**, it’s a strong buy signal.
---
3️⃣ **Morning Star**
🔹 A **three-candle pattern** appearing after a **downtrend**:
✅ First Candle – Large **red candle** (sellers in control).
✅ Second Candle – Small **indecisive candle** (doji/spinning top).
✅ Third Candle – Large **green candle**, confirming reversal.
📌 **Confirmation:** The third candle should close above the first candle’s midpoint.
🔹 **Example:** A **Morning Star on Bank Nifty's daily chart** at a key support zone can indicate a bullish rally ahead.
---
### 📍 **B) Bearish Reversal Patterns**
1️⃣ **Shooting Star**
🔹 A small body with a **long upper wick**.
🔹 Appears after an **uptrend**, signaling a potential reversal.
🔹 Shows that **buyers tried to push prices higher but failed, and sellers took control**.
📌 **Confirmation:** The next candle should be bearish with strong volume.
🔹 **Example:** If **Reliance stock** forms a **shooting star** near resistance, it could indicate a **sell-off**.
---
2️⃣ **Bearish Engulfing**
🔹 A **large red candle** completely engulfs the previous **green candle**.
🔹 Indicates **strong selling pressure** and potential **trend reversal**.
📌 **Confirmation:** Must occur at a **resistance level or after an uptrend**.
🔹 **Example:** A **Bearish Engulfing pattern on the Nifty 50 weekly chart** near a **key resistance level** signals weakness in the index.
---
3️⃣ **Evening Star**
🔹 A **three-candle pattern** appearing after an **uptrend**:
✅ First Candle – Large **green candle** (buyers in control).
✅ Second Candle – Small **indecisive candle** (doji/spinning top).
✅ Third Candle – Large **red candle**, confirming reversal.
📌 **Confirmation:** The third candle should close below the first candle’s midpoint.
🔹 **Example:** An **Evening Star on HDFC Bank’s chart** near all-time highs may signal a bearish reversal.
---
## **4️⃣ How to Trade Candlestick Reversal Patterns?**
📌 **Step 1:** Identify the pattern at a **key support or resistance level**.
📌 **Step 2:** Wait for **confirmation** from the next candle.
📌 **Step 3:** Use **indicators like RSI, MACD, or Volume** for extra confirmation.
📌 **Step 4:** Enter a trade with a **stop-loss below/above the pattern’s wick**.
📌 **Example Trade Setup:**
✅ If a **Hammer pattern forms at a support level with increasing volume**, go **long**.
✅ Place **stop-loss** below the candle’s wick.
✅ Target **previous resistance levels** for profit-taking.
---
## **5️⃣ Common Mistakes to Avoid When Using Candlestick Patterns**
❌ **Trading Patterns in Isolation** – Always combine with support/resistance and indicators.
❌ **Ignoring Volume Confirmation** – A strong reversal needs high volume support.
❌ **Entering Without Confirmation** – Wait for a confirming candle before taking a trade.
❌ **Using Too Many Patterns** – Stick to **high-probability setups** like Engulfing, Hammer, and Shooting Star.
📌 **Pro Tip:** The best traders use **candlestick patterns along with market structure, trendlines, and momentum indicators** for higher accuracy.
---
## **Final Thoughts – Why Candlestick Patterns Are Important?**
🚀 **Candlestick patterns provide an edge in understanding market psychology and potential price movements.**
📌 **To Master Candlestick Trading:**
✅ Learn to identify **reliable reversal and continuation patterns**.
✅ Combine with **key support/resistance levels**.
✅ Backtest patterns to see which works best in different market conditions.
By mastering **Candlestick Analysis**, traders can significantly improve their decision-making and **increase profitability in the stock market!** 📈💰
---
📌 **Coming Up Next in Part 2:** **Continuation Candlestick Patterns (Doji, Spinning Tops, Three Soldiers, etc.) and How to Use Them in Trading.**
🔹 **Disclaimer**: This content is for educational purposes only. *SkyTradingZone* is not SEBI registered and does not provide financial or investment advice. Please conduct your own research before making any trading decisions.

RelianceH&S pattern observed on 125 mins
Nifty index also looks weak and Rel in weak condition make it a confirmation
Brace yourself from fresh buy
