Part 6 Learn Institutional Trading How Option Trading Works
When you trade options, there are two sides to every contract: the buyer and the seller.
Option Buyer: Pays the premium for the right to exercise the option. Their risk is limited to the premium paid but potential profit is unlimited (in calls) or substantial (in puts).
Option Seller (Writer): Receives the premium upfront but assumes an obligation if the buyer exercises the option. Their potential loss can be large, depending on market movement.
For example:
Let’s say stock XYZ is trading at ₹100.
You buy a call option with a strike price of ₹105, paying a premium of ₹3.
If XYZ rises to ₹115 before expiry, your profit = (115 – 105) – 3 = ₹7 per share.
If it stays below ₹105, your loss is limited to ₹3 (the premium paid).
Trade ideas

Intraday and Scalping Strategies: Mastering Short-Term Trading1. Introduction
In the fast-paced world of stock trading, two of the most active and adrenaline-filled approaches are intraday trading and scalping. These trading styles revolve around capturing small price movements within the same trading session—without holding positions overnight. Traders using these methods aim to exploit market volatility, volume spikes, and short-term trends to generate profits.
While both intraday and scalping share the same principle—quick trades—they differ in timeframes, position sizes, and profit expectations. Intraday traders hold positions for minutes to hours, while scalpers operate on a much shorter horizon, often seconds or a few minutes. Success in these methods requires discipline, technical analysis mastery, and a deep understanding of market structure and momentum.
2. Understanding Intraday Trading
Definition
Intraday trading, also known as day trading, involves buying and selling financial instruments—such as stocks, indices, commodities, or forex—within a single trading day. Traders aim to profit from short-term price fluctuations without carrying overnight risk.
Objective
The core objective of intraday trading is to capitalize on daily volatility. Traders focus on price action, news-driven moves, and liquidity zones to identify opportunities.
Timeframe
Intraday traders typically use charts ranging from 1-minute to 15-minute intervals for entries and exits, while analyzing higher timeframes like the 1-hour or 4-hour chart for overall trend direction.
3. The Mechanics of Intraday Trading
a. Market Selection
Intraday traders prefer stocks or instruments that have:
High liquidity (easy entry and exit)
Volatility (to create meaningful price movements)
Strong volume participation
For example, large-cap stocks, index futures (like NIFTY, BANK NIFTY), and active currency pairs (like EUR/USD) are common choices.
b. Time of Entry
The most volatile and profitable intraday periods are:
Opening hour (9:15–10:30 AM IST) – when overnight news is absorbed.
Closing hour (2:30–3:30 PM IST) – as institutional traders adjust their positions.
c. Leverage
Intraday traders often use margin trading, which magnifies both profits and risks. For instance, with 5x leverage, a 1% move can yield a 5% profit—or loss.
d. Tools and Indicators
Some of the most popular technical tools used by intraday traders include:
Moving Averages (MA): Identifying short-term trend direction.
VWAP (Volume Weighted Average Price): Used as an intraday benchmark.
MACD & RSI: Momentum indicators signaling strength or weakness.
Support and Resistance Levels: Key zones where price often reacts.
Volume Profile: To identify price levels with maximum trading activity.
4. Popular Intraday Trading Strategies
a. Momentum Trading
Momentum traders seek stocks that are moving strongly in one direction with high volume. The goal is to “ride the momentum” until signs of reversal appear.
Example:
If a stock breaks above a key resistance with high volume, a trader may buy with a stop-loss below the breakout level.
b. Breakout Trading
This strategy focuses on entering positions when the price breaks through well-defined support or resistance levels.
Entry: When price closes above resistance or below support.
Stop-loss: Just outside the breakout zone.
Target: Based on previous swing or risk-reward ratio (often 1:2).
c. Reversal Trading
Contrarian traders look for signs that a trend is about to reverse, such as:
Divergences in RSI or MACD
Candlestick reversal patterns (e.g., hammer, shooting star)
Volume exhaustion
d. Gap Trading
Traders exploit price gaps created by overnight news, earnings, or global cues. For example:
Gap-up open: Short if the stock fails to hold early gains.
Gap-down open: Buy if the price recovers with strong volume.
e. VWAP Strategy
The VWAP line acts as a fair value indicator for intraday traders.
Above VWAP: Indicates bullish bias.
Below VWAP: Indicates bearish bias.
Institutional traders often use VWAP to execute large orders efficiently.
5. Understanding Scalping
Definition
Scalping is the fastest form of trading, involving dozens—or even hundreds—of trades within a single session. Scalpers aim to capture tiny profits (5–10 paise or a few ticks) multiple times throughout the day.
Objective
The goal is to exploit micro-price movements and order flow inefficiencies. Scalpers rely on high liquidity and rapid execution rather than large price swings.
Timeframe
Scalpers operate in seconds to a few minutes. They rely heavily on 1-minute charts, tick charts, and order book depth for decision-making.
6. Key Principles of Scalping
a. Speed and Precision
Scalpers depend on fast execution and tight spreads. Even a few seconds of delay can turn a winning trade into a loss.
b. Small Targets, Strict Stops
A scalper might target 0.05–0.2% profit per trade with equally small stop-losses.
The focus is on high accuracy and consistency rather than big gains.
c. High Trade Frequency
Scalpers execute many trades in a session. For example, if a trader makes 50 trades with a ₹100 average profit, total profit = ₹5,000.
d. Leverage Usage
Because profits per trade are small, scalpers often use higher leverage—but this also magnifies risk.
e. Market Depth Analysis
Scalpers monitor Level II data (order book) to anticipate short-term imbalances in buying and selling pressure.
7. Popular Scalping Techniques
a. Bid-Ask Spread Scalping
Traders take advantage of the small difference between the bid and ask prices.
This method requires ultra-fast execution and often direct market access (DMA) platforms.
b. Moving Average Cross Scalping
Uses two short-term moving averages (e.g., 9 EMA and 21 EMA):
Buy signal: When shorter EMA crosses above longer EMA.
Sell signal: When it crosses below.
c. Price Action Scalping
Relies purely on candlestick patterns and support/resistance zones without indicators. Traders look for micro-trends or breakout candles for quick entries.
d. News-Based Scalping
During economic releases (like inflation data, RBI announcements, or Fed decisions), markets become volatile. Scalpers exploit rapid price moves right after such events.
e. Range Scalping
When markets move sideways, scalpers buy at the bottom of the range and sell near the top repeatedly—profiting from oscillations.
8. Tools and Platforms for Scalping and Intraday Trading
Both strategies demand real-time precision, so traders rely on:
Advanced charting platforms: TradingView, MetaTrader, ThinkorSwim, Zerodha Kite, etc.
Fast order execution: Brokers offering low-latency trading.
Level II data & market depth: To analyze liquidity zones.
Hotkeys and algorithms: For instant order placement.
High-speed internet and dual-screen setups are common among serious intraday traders.
9. Risk Management: The Heart of Short-Term Trading
Both intraday and scalping strategies can yield consistent returns—but only with strict risk control.
Key Rules:
Use Stop-Losses: Never trade without predefined exits.
Position Sizing: Risk only 1–2% of total capital per trade.
Avoid Overtrading: Stick to your setup; don’t chase losses.
Set Daily Limits: Stop trading after hitting max loss or profit goals.
Control Emotions: Greed and fear are the biggest threats in short-term trading.
Risk-Reward Example:
If your stop-loss is ₹2 and target is ₹4, you maintain a 1:2 ratio. Even with 50% accuracy, you remain profitable.
10. Psychology Behind Short-Term Trading
Scalping and intraday trading test a trader’s discipline and emotional control. Success depends not only on strategy but also on mindset:
Patience: Waiting for perfect setups.
Emotional neutrality: No excitement after wins or frustration after losses.
Focus: Constant screen time and attention to detail.
Adaptability: Changing tactics as market conditions shift.
A calm, rule-based approach outperforms impulsive decision-making every time.
11. Best Practices for Successful Execution
Start Small: Begin with small capital and low-risk trades.
Backtest Strategies: Analyze performance on historical data.
Journal Every Trade: Record reasons, outcomes, and emotions.
Avoid News Noise: Focus on technical levels, not random headlines.
Improve Continuously: Refine setups based on win-rate analysis.
12. Combining Scalping and Intraday Approaches
Some professional traders blend both:
Use scalping during volatile periods (opening or news hours).
Use intraday swing trades during calmer, trend-driven phases.
This hybrid model balances frequency and profitability—allowing flexibility based on volatility and market mood.
Conclusion
Intraday and scalping strategies offer exciting opportunities to profit from short-term market movements. They demand speed, discipline, and sharp technical skills. Unlike long-term investing, where time cushions errors, intraday and scalping reward precision and risk management.
The secret to mastering these techniques lies not in trading more, but in trading smart—with a consistent plan, strict stops, and psychological balance. For those willing to put in the effort, the art of short-term trading can become both a profitable skill and a professional edge.
The Rise of Jane Street in Global Finance1. Origins: A Humble Beginning with a Big Vision
Jane Street was founded in 2000 by a small group of traders — Tim Reynolds, Rob Granieri, Marc Gerstein, and Michael Jenkins — with a bold idea: to apply quantitative methods and technology-driven strategies to global trading. What set them apart from the start was their belief that trading was not just about speculation, but about solving complex mathematical problems efficiently.
Starting from a single office in New York City, the firm initially focused on exchange-traded funds (ETFs) — a market that was then in its infancy. ETFs were relatively new instruments, combining the flexibility of stock trading with the diversification of mutual funds. Many financial institutions did not yet understand their pricing complexities, but Jane Street’s founders recognized a goldmine of opportunity in the arbitrage and market-making potential of ETFs.
Through deep statistical analysis, coding expertise, and mathematical precision, Jane Street became one of the first firms to specialize in ETF arbitrage, helping create fair prices and efficient markets for these instruments.
2. Building the Quantitative Core
While most traditional Wall Street firms relied on intuition, experience, and aggressive speculation, Jane Street built its identity around quantitative rigor. Every trading decision was backed by data, models, and algorithms rather than mere hunches.
The firm recruited heavily from top universities, hiring mathematicians, physicists, and computer scientists instead of traditional finance professionals. This helped create a culture that was more akin to a research lab than a typical trading floor.
The use of probabilistic modeling, machine learning, and statistical arbitrage allowed Jane Street to find small inefficiencies in markets across thousands of instruments — equities, bonds, currencies, and derivatives — and trade them profitably.
What truly distinguished Jane Street was its technology-first philosophy. The company built nearly all its systems in-house, ensuring tight control, low latency, and adaptability. Its trading infrastructure allowed for lightning-fast execution — critical in markets where prices change in microseconds.
3. Mastering ETF Trading and Market Making
Jane Street’s early specialization in ETFs paid off enormously. As ETFs exploded in popularity worldwide, the firm became one of the largest ETF liquidity providers globally.
By constantly quoting buy and sell prices, Jane Street played a key role in ensuring that ETFs traded smoothly, even during volatile market conditions. It became the “invisible hand” behind countless trades — earning small margins but at massive volume.
During major market events, such as the 2008 financial crisis and the COVID-19 pandemic, Jane Street’s market-making capabilities were crucial in maintaining stability and liquidity. While many financial institutions pulled back, Jane Street stepped in — buying when others were fearful, providing prices when markets froze, and helping ensure continuous trading.
Their performance during crises cemented their reputation as a reliable backbone of modern markets.
4. Expansion into Global Markets
After conquering ETF trading, Jane Street expanded aggressively into new asset classes and regions. Offices were established in London, Hong Kong, and Amsterdam, transforming the firm into a truly global powerhouse.
The firm’s trading universe now includes:
Equities and ETFs across every major exchange
Fixed income instruments such as bonds and treasuries
Commodities and energy derivatives
Currencies (FX) and cryptocurrencies
Options and futures across various asset classes
Despite this diversification, Jane Street maintained a disciplined approach — only entering markets where its data-driven methods could yield a sustainable edge.
The company also became known for its cross-asset trading strategies — using correlations between asset classes to identify opportunities. For instance, changes in bond yields could signal moves in currencies or equity sectors, allowing Jane Street to capture value across interconnected markets.
5. The Technology Advantage
Technology is the beating heart of Jane Street’s rise. The firm’s internal systems are highly sophisticated, capable of handling massive data volumes in real-time. Every aspect — from pricing models and risk management to communication tools — is custom-built.
Jane Street uses the programming language OCaml for most of its systems, which is unusual in finance. OCaml allows for functional programming, helping the firm maintain robust, error-resistant, and efficient codebases. This gives them a stability advantage over competitors using more traditional financial software stacks.
Moreover, the firm’s automation and low-latency trading systems enable it to make decisions and execute orders faster than the human eye can blink. Yet, unlike many high-frequency trading (HFT) firms, Jane Street avoids reckless speed races. Instead, it uses technology strategically — focusing on smart execution, risk-adjusted returns, and long-term sustainability rather than pure velocity.
6. Culture: Collaboration and Intellectual Rigor
One of Jane Street’s most defining characteristics is its culture. Unlike the cutthroat environment typical of Wall Street, Jane Street emphasizes collaboration, transparency, and intellectual curiosity.
There are no large egos or “star traders” — everyone is encouraged to question, debate, and improve processes collectively. Meetings are analytical discussions rather than emotional arguments. Success is attributed to teams, not individuals.
The firm also has a flat organizational structure, where even junior employees are encouraged to contribute ideas. This approach fosters creativity and innovation — allowing new strategies to emerge from any level of the company.
Employees describe the culture as “academic yet pragmatic,” where curiosity is celebrated, and errors are treated as learning opportunities. This philosophy has helped Jane Street maintain consistency even as it scaled into a global enterprise.
7. The Role in Modern Market Liquidity
In today’s interconnected global markets, liquidity providers like Jane Street play an indispensable role. They ensure that buyers and sellers can transact efficiently without large price disruptions.
Jane Street’s algorithms continuously analyze order books, macroeconomic trends, and microstructure signals to offer tight bid-ask spreads — meaning better pricing for all market participants.
As markets have become more fragmented, with trades spread across dozens of exchanges, Jane Street’s ability to aggregate and balance liquidity across them gives it an enormous competitive advantage.
It’s estimated that the firm now trades trillions of dollars’ worth of securities annually, often accounting for a significant share of ETF trading volume globally.
8. Moving into Fixed Income and Cryptocurrencies
While equities and ETFs remain its backbone, Jane Street has successfully diversified into fixed income and digital assets — two of the most complex trading domains.
In fixed income markets, the firm became a major player in US Treasuries, corporate bonds, and interest rate derivatives. Its data-driven methods allow it to handle the opacity and illiquidity typical of bond markets more efficiently than many traditional banks.
Jane Street’s move into cryptocurrencies was another milestone. Unlike many firms that viewed crypto as speculative, Jane Street approached it with the same quantitative precision it applies to any asset. By becoming an early market maker for Bitcoin ETFs and crypto derivatives, it helped bring institutional stability to digital asset markets.
This adaptability — the ability to understand and trade emerging asset classes — showcases why Jane Street continues to stay ahead of the curve.
9. Risk Management and Discipline
For all its success, Jane Street’s longevity is built on one thing above all: risk control.
The firm operates on the principle that surviving bad days is more important than maximizing profits on good ones. Every trade is evaluated not just for potential return, but for its risk-adjusted value.
Sophisticated real-time risk management systems continuously monitor the firm’s positions across all markets, ensuring exposure stays within carefully defined limits.
Jane Street famously avoids “directional bets.” It doesn’t try to predict where markets will go — instead, it focuses on relative value trading, capturing small inefficiencies that exist between related securities. This disciplined, non-speculative philosophy has kept the firm stable even during turbulent times.
10. Jane Street’s Role in the 21st-Century Market Ecosystem
Today, Jane Street is more than a trading firm — it is a systemic player in global finance. Its algorithms help maintain efficient pricing across continents, its liquidity keeps ETFs and bonds flowing smoothly, and its risk discipline serves as a model for modern financial engineering.
Unlike investment banks, Jane Street doesn’t advise clients or manage portfolios; its business model is purely trading-based. Yet its impact rivals that of major banks.
As markets become increasingly electronic, data-driven, and cross-asset, firms like Jane Street are shaping the future architecture of global finance — where human intuition and machine intelligence coexist in harmony.
11. The Legacy and the Road Ahead
Jane Street’s rise reflects a broader transformation in finance — the shift from intuition-driven trading to algorithmic precision. It represents how intellectual humility, technological excellence, and a focus on long-term sustainability can outperform greed and speculation.
As artificial intelligence, blockchain, and decentralized finance (DeFi) evolve, Jane Street’s future will likely involve deeper integration of AI-powered models, quantum computing simulations, and global regulatory engagement.
But if its history is any guide, the firm will continue to adapt — quietly, intelligently, and effectively — without the need for flashy publicity or loud declarations.
Conclusion
The story of Jane Street is not just the story of a trading firm; it’s a story about the evolution of modern finance itself.
From its origins in ETF arbitrage to becoming one of the most dominant forces in global liquidity, Jane Street has shown that success in markets today comes not from speculation but from discipline, technology, collaboration, and continuous learning.
It stands as a testament to what finance can achieve when math meets markets, when data meets discipline, and when humility meets innovation.
In a world that often celebrates noise, Jane Street thrives in silence — executing billions in trades daily, quietly shaping the very structure of the global financial system.

Part 4 Learn Instiutitonal Trading Intrinsic and Time Value
An option’s premium has two parts:
Intrinsic Value: The amount by which an option is “in the money.”
For a call option, it’s the difference between the current price and the strike price.
For a put option, it’s the difference between the strike price and the current price.
Time Value: Represents the potential for the option to gain more value before expiration. The longer the time to expiry, the higher the time value.
Example:
If a stock is trading at ₹1,200 and a call option with a strike price of ₹1,000 is priced at ₹220, then:
Intrinsic Value = ₹200 (₹1,200 - ₹1,000)
Time Value = ₹20 (₹220 - ₹200)

Financial Future Plan: A Roadmap to Sustainable ProsperityIntroduction
In today’s dynamic and unpredictable world, financial planning is not merely a choice—it is a necessity. The global economy constantly evolves with technological innovation, inflationary pressures, changing job markets, and shifting investment opportunities. Against this backdrop, a financial future plan acts as a guiding framework to achieve financial stability, security, and long-term wealth creation. It provides clarity about one’s income, expenses, savings, investments, and risk management strategies. A well-crafted financial plan enables individuals and families to meet their short-term needs while securing their future aspirations such as education, retirement, home ownership, and legacy planning.
1. Understanding Financial Planning
Financial planning refers to the process of managing one’s finances to achieve life goals systematically. It involves assessing current financial conditions, identifying objectives, and developing strategies to meet those goals through savings, investments, insurance, and debt management.
A financial future plan is both proactive and adaptive. It not only addresses current needs but also anticipates future uncertainties like medical emergencies, job loss, or economic downturns. It provides a sense of control and peace of mind, ensuring that financial decisions are made with a long-term perspective rather than short-term impulses.
2. Importance of Financial Future Planning
The significance of planning for the financial future cannot be overstated. It provides multiple benefits, including:
Goal Achievement:
Financial planning transforms dreams into achievable goals—whether it’s buying a home, starting a business, or ensuring a comfortable retirement.
Budget Discipline:
It instills financial discipline by tracking income and expenses, helping avoid unnecessary spending and encouraging consistent saving.
Crisis Preparedness:
By building an emergency fund and obtaining insurance, a financial plan shields individuals from unexpected financial shocks.
Wealth Creation:
Strategic investments across asset classes like equities, bonds, and real estate ensure capital appreciation and income generation.
Tax Efficiency:
Proper planning helps minimize tax liability through legal avenues like deductions, exemptions, and investment-linked benefits.
Financial Independence:
Ultimately, a sound plan enables individuals to live life on their own terms without depending on others for financial support.
3. Core Components of a Financial Future Plan
A comprehensive financial plan integrates multiple elements that work together to build long-term financial health. These components include:
a) Goal Setting
Every financial journey begins with goal setting. Goals must be SMART — Specific, Measurable, Achievable, Relevant, and Time-bound. Examples include:
Saving ₹20 lakhs for a child’s education within 10 years
Buying a home worth ₹80 lakhs in 15 years
Accumulating ₹1 crore for retirement by age 60
Setting clear goals helps determine the investment amount, time horizon, and risk appetite.
b) Budget Management
Budgeting forms the foundation of financial control. It involves listing monthly income sources, categorizing expenses, and ensuring savings are prioritized. The 50-30-20 rule serves as a useful guideline — allocating 50% to needs, 30% to wants, and 20% to savings or debt repayment.
c) Emergency Fund
An emergency fund acts as a financial cushion against unforeseen circumstances such as job loss, hospitalization, or urgent repairs. Ideally, it should cover 6–12 months of essential expenses and be parked in a liquid, low-risk instrument such as a savings account or money market fund.
d) Debt Management
Debt, if unmanaged, can derail financial progress. A strong plan involves reducing high-interest loans first (like credit card dues or personal loans) and maintaining a healthy credit score. Strategic borrowing for productive assets such as education or housing can be beneficial when aligned with repayment capacity.
e) Insurance and Risk Protection
Insurance is a critical risk-mitigation tool. Life, health, and asset insurance ensure financial security in case of unforeseen events. Term life insurance provides income replacement for dependents, while health insurance covers escalating medical costs, which are often financially draining.
f) Investment Planning
Investment planning transforms savings into wealth. Diversification across asset classes—equities, mutual funds, bonds, real estate, gold, and alternative assets—balances risk and return. Asset allocation should match the investor’s goals, time horizon, and risk tolerance.
Short-term goals may use fixed deposits or short-duration funds.
Medium-term goals may favor balanced or hybrid mutual funds.
Long-term goals can leverage equity mutual funds or direct equity for higher returns.
g) Retirement Planning
Retirement planning ensures financial independence during non-earning years. Early planning leverages the power of compounding, allowing small, regular contributions to grow substantially. Instruments such as the National Pension System (NPS), Public Provident Fund (PPF), and Employee Provident Fund (EPF) serve as reliable long-term savings avenues.
h) Tax Planning
Tax optimization enhances returns by reducing liabilities. Investors can utilize deductions under Sections 80C, 80D, and 80G of the Indian Income Tax Act through investments in ELSS mutual funds, insurance premiums, and health coverage. Efficient tax planning aligns with overall financial goals without compromising liquidity.
i) Estate and Legacy Planning
This ensures a smooth transfer of wealth to the next generation. Drafting a will or creating a trust prevents legal disputes and preserves wealth continuity. It reflects responsible financial stewardship and secures the family’s future.
4. Steps to Create a Financial Future Plan
Crafting an effective financial plan involves a structured, step-by-step approach:
Step 1: Assess Your Current Financial Position
Analyze income, expenses, assets, and liabilities to understand your financial baseline. This assessment reveals strengths, weaknesses, and areas for improvement.
Step 2: Define Clear Objectives
List your short-term (1–3 years), medium-term (3–10 years), and long-term (10+ years) financial goals. Prioritize them based on urgency and importance.
Step 3: Evaluate Risk Appetite
Every investor’s risk tolerance differs based on age, income, and financial obligations. Younger investors can take higher equity exposure, while older individuals may prefer stable income instruments.
Step 4: Design an Investment Strategy
Create a diversified portfolio that aligns with your time horizon and goals. Review and rebalance periodically to adapt to market or personal changes.
Step 5: Build an Emergency Fund
Set aside a dedicated corpus for unexpected expenses before aggressively investing in growth assets.
Step 6: Protect with Insurance
Ensure adequate life and health coverage. For dependents, term insurance with a sum assured 10–15 times the annual income is advisable.
Step 7: Implement and Monitor
Execution is the bridge between planning and success. Regularly review your plan—annually or after significant life events—to ensure alignment with changing circumstances.
5. The Role of Technology in Financial Planning
Digital transformation has revolutionized personal finance management. Today, individuals can track expenses, analyze investments, and plan for goals using fintech platforms, robo-advisors, and mobile applications.
Robo-advisory platforms provide algorithm-driven portfolio suggestions based on individual risk profiles.
Investment apps enable systematic investing through SIPs (Systematic Investment Plans).
AI-driven analytics offer insights into spending patterns, credit behavior, and tax-saving opportunities.
Technology has made financial planning more accessible, transparent, and data-driven, even for beginners.
6. Challenges in Financial Future Planning
Despite its importance, many individuals face hurdles in developing a robust financial plan:
Lack of Awareness:
Many people underestimate the value of long-term planning, focusing instead on immediate needs.
Inflation and Lifestyle Creep:
Rising costs erode purchasing power, while lifestyle upgrades often outpace income growth.
Market Volatility:
Fluctuating markets can test investors’ patience and confidence, leading to impulsive decisions.
Over-Reliance on Debt:
Easy credit availability can create long-term liabilities, restricting future financial flexibility.
Inconsistent Saving Habits:
Irregular savings and lack of budgeting discipline delay wealth creation.
Addressing these challenges requires awareness, education, and a disciplined approach to money management.
7. Financial Future Planning Across Life Stages
Financial priorities evolve over time. Hence, the plan must adapt to life stages:
Early Career (20s–30s):
Focus on budgeting, building emergency funds, and starting early investments. Opt for aggressive asset allocation (higher equity exposure) to leverage compounding.
Mid-Life (30s–50s):
Balance growth and stability. Prioritize child education, home loans, and insurance coverage while maintaining consistent retirement contributions.
Pre-Retirement (50s–60s):
Shift towards capital preservation. Rebalance portfolios toward fixed income, annuities, and low-risk instruments.
Retirement and Beyond:
Emphasize steady income streams, healthcare coverage, and estate management. Avoid risky investments and focus on liquidity and stability.
8. The Psychological Aspect of Financial Planning
Money management is as much about mindset as mathematics. Emotional biases—such as overconfidence, fear of loss, or herd behavior—can distort rational decision-making. Successful financial planning requires emotional intelligence, patience, and goal-focused discipline. Adopting a long-term view helps investors ride through volatility and resist impulsive behavior.
9. Role of Financial Advisors
Professional financial advisors play a crucial role in designing, executing, and monitoring financial plans. They offer expertise in portfolio diversification, tax efficiency, and estate management. With regulatory oversight and fiduciary responsibility, advisors ensure that strategies align with clients’ best interests.
10. Conclusion
A financial future plan is the blueprint for achieving stability, growth, and independence in an uncertain world. It combines analytical rigor with practical wisdom—balancing today’s needs with tomorrow’s aspirations. Whether one earns modestly or abundantly, financial success ultimately depends on discipline, consistency, and informed decision-making.
By budgeting wisely, investing intelligently, and preparing for risks, individuals can secure not only their financial well-being but also the peace of mind that comes with control over their economic destiny. As the saying goes, “A goal without a plan is just a wish.” A financial plan transforms that wish into reality—building a secure, prosperous, and confident future.

Derivatives Hedge RisksIntroduction
In the intricate and volatile world of finance, risk management stands as a central pillar for investors, corporations, and financial institutions alike. Among the most sophisticated tools available for mitigating financial uncertainty are derivatives. These financial instruments derive their value from an underlying asset, such as stocks, bonds, commodities, currencies, or interest rates. Derivatives have evolved over the decades from simple forward agreements between merchants into a complex ecosystem of futures, options, swaps, and other innovative contracts. Their fundamental purpose remains the same — to hedge risks and ensure stability in uncertain market environments.
This essay explores how derivatives hedge risks, the various types of derivatives used for hedging, real-world applications, and the benefits and challenges of their use in modern financial systems.
1. Understanding Derivatives
A derivative is a financial contract whose value depends on, or is “derived” from, the value of an underlying asset or benchmark. The main types of underlying assets include:
Equities (Stocks)
Commodities (Oil, Gold, Wheat, etc.)
Interest rates
Foreign currencies
Market indices (Nifty, S&P 500, etc.)
The most common types of derivatives are forwards, futures, options, and swaps. Each type serves a unique purpose in risk management.
2. The Concept of Hedging
Hedging is a strategy designed to protect against potential losses from adverse price movements. It is akin to purchasing insurance. Just as an individual buys health or car insurance to reduce exposure to personal financial loss, investors or companies use derivatives to insure against financial risks.
For example, a farmer expecting to harvest wheat in three months worries that wheat prices might drop. By entering a futures contract to sell wheat at a predetermined price, the farmer locks in the selling price today, thus hedging against future price declines. Similarly, an airline company worried about rising jet fuel prices might use derivatives to lock in current fuel costs.
3. Types of Derivatives Used for Hedging
3.1 Forwards
A forward contract is a customized agreement between two parties to buy or sell an asset at a specified future date for a price agreed upon today.
Example: A coffee exporter expects to sell 1,000 kilograms of coffee beans in six months. To protect against a potential fall in coffee prices, the exporter enters into a forward contract with a buyer to sell the coffee at ₹250 per kg in six months.
Hedging Impact: Regardless of future price fluctuations, the exporter knows exactly how much revenue will be received, eliminating uncertainty.
However, forwards carry a counterparty risk, as there is no centralized exchange to guarantee contract fulfillment.
3.2 Futures
Futures contracts are standardized versions of forward contracts, traded on regulated exchanges like the NSE or BSE in India. They obligate the buyer and seller to transact the underlying asset at a fixed price and date.
Example: A gold jewelry manufacturer expects to buy 10 kg of gold in two months. To hedge against potential price increases, the manufacturer buys gold futures today at ₹60,000 per 10 grams. If gold prices rise to ₹65,000, the manufacturer benefits because the futures contract offsets the increased cost.
Key Advantage: Futures contracts eliminate counterparty risk through exchange clearing houses, which act as intermediaries guaranteeing the trade.
3.3 Options
An option provides the right, but not the obligation, to buy or sell an asset at a predetermined price (called the strike price) before or at expiration.
Call Option: Gives the right to buy the underlying asset.
Put Option: Gives the right to sell the underlying asset.
Example (Put Option for Hedging):
A stock investor holding shares of Infosys worries that its price might fall. The investor buys a put option with a strike price of ₹1,500. If Infosys drops to ₹1,300, the investor can sell at ₹1,500, limiting losses.
Example (Call Option for Hedging):
An importer expecting to pay in U.S. dollars in three months can buy a call option on USD/INR. If the dollar strengthens, the importer exercises the option and locks in a favorable exchange rate.
Options are highly flexible tools and are widely used for both portfolio protection and speculative strategies.
3.4 Swaps
Swaps are contracts between two parties to exchange cash flows or other financial instruments. The most common forms are interest rate swaps and currency swaps.
Interest Rate Swap Example:
A company with a variable-rate loan fears rising interest rates. It enters an interest rate swap to convert its floating payments into fixed payments, thus stabilizing its interest expenses.
Currency Swap Example:
An Indian firm borrowing in U.S. dollars but earning revenue in rupees may enter into a currency swap with a U.S. firm that needs rupees, effectively exchanging currency obligations and reducing exchange rate exposure.
Swaps are primarily used by corporations and financial institutions to manage interest rate and currency risks.
4. How Derivatives Hedge Specific Types of Risk
4.1 Price Risk
Price risk refers to the uncertainty of future market prices for commodities, securities, or other assets.
Hedging with Futures: Farmers, manufacturers, and commodity traders lock in prices to protect against unfavorable movements.
Example: Oil producers sell crude oil futures to hedge against a potential decline in oil prices.
4.2 Currency Risk
Currency or foreign exchange risk arises when transactions or investments involve multiple currencies.
Hedging with Forwards or Options: Exporters and importers use currency forwards or options to fix exchange rates.
Example: An Indian IT firm expecting dollar revenue may hedge by selling USD-INR forwards to avoid losses from a depreciating dollar.
4.3 Interest Rate Risk
Interest rate fluctuations can impact loan costs, bond prices, and investment returns.
Hedging with Swaps or Futures: Companies convert floating-rate debt to fixed-rate using swaps or use interest rate futures to stabilize borrowing costs.
Example: A bank holding fixed-rate loans but funding them with variable-rate deposits can use an interest rate swap to balance its risk exposure.
4.4 Credit Risk
Credit derivatives, such as credit default swaps (CDS), hedge against the risk of borrower default.
Example: A bank holding corporate bonds buys a CDS to receive compensation if the issuer defaults, thus transferring credit risk to another party.
4.5 Portfolio Risk
Investors use index options and futures to hedge entire portfolios.
Example: A mutual fund anticipating short-term market volatility sells Nifty futures to protect its holdings from a potential downturn. When prices fall, profits from the futures offset losses in the portfolio.
5. Real-World Applications of Derivative Hedging
1. Corporate Sector
Airlines: Hedge against fuel price volatility using oil futures.
Exporters: Protect against foreign exchange fluctuations using currency forwards.
Manufacturers: Lock input costs with commodity futures to stabilize production costs.
2. Banking and Financial Institutions
Banks and mutual funds use derivatives to manage interest rate, credit, and market risks. Derivatives allow them to protect profit margins and maintain asset-liability stability.
3. Investors and Portfolio Managers
Investors use derivatives to hedge positions or reduce volatility. For instance, a fund manager may use put options on indices to safeguard portfolios during uncertain markets.
6. Advantages of Using Derivatives for Hedging
Risk Reduction:
Derivatives minimize exposure to adverse market movements, providing financial stability.
Cost Efficiency:
Derivative contracts often require less capital compared to holding physical assets.
Flexibility:
Options and swaps can be customized to specific risk needs, offering tailored protection.
Liquidity:
Major derivatives markets (like NSE, CME, or LME) offer high liquidity, making entry and exit easy.
Global Integration:
Derivatives enable international firms to manage risks across multiple markets and currencies seamlessly.
7. Risks and Challenges in Using Derivatives
While derivatives serve as powerful hedging instruments, they come with their own set of risks:
Leverage Risk:
Small price changes in the underlying asset can lead to large losses because derivatives often involve high leverage.
Counterparty Risk:
In over-the-counter (OTC) derivatives like forwards or swaps, one party may default on obligations.
Complexity:
Some derivatives are highly complex, requiring advanced understanding and monitoring. Misuse can lead to significant losses.
Speculative Misuse:
Although derivatives are designed for hedging, they can be used for speculation, amplifying market volatility.
Regulatory and Legal Risks:
Changes in regulations or lack of oversight may affect contract enforceability and transparency.
8. Case Studies of Derivative Hedging
1. Southwest Airlines (U.S.)
Southwest famously hedged against rising oil prices by using long-term crude oil futures. When oil prices surged in the 2000s, Southwest’s fuel costs remained low, giving it a major competitive edge.
2. Infosys Technologies (India)
Infosys, a major exporter of software services, uses currency derivatives to hedge against rupee appreciation. By locking in exchange rates, Infosys protects its dollar revenues from currency volatility.
3. Tata Steel
Tata Steel uses commodity derivatives to hedge against fluctuations in iron ore and coal prices, stabilizing input costs and ensuring consistent profitability.
9. The Indian Derivatives Market
India’s derivatives market has expanded rapidly since the early 2000s, driven by the National Stock Exchange (NSE) and the Bombay Stock Exchange (BSE).
The NSE introduced index futures in 2000, followed by index options and stock derivatives.
Commodity derivatives are traded through exchanges such as the Multi Commodity Exchange (MCX).
Currency and interest rate derivatives have enabled corporations and investors to hedge efficiently in a globally connected economy.
Regulatory oversight by SEBI ensures transparency, standardization, and risk management practices in derivative trading.
10. The Future of Derivative Hedging
The future of derivatives lies in technological innovation, blockchain-based smart contracts, and AI-driven risk management. With globalization, financial products are increasingly interconnected, and derivatives will continue to evolve as essential instruments for financial stability.
Emerging areas include:
Environmental Derivatives: For hedging carbon credits and climate risks.
Crypto Derivatives: Managing risks in digital asset markets.
AI-Enhanced Hedging Models: Predictive analytics improving hedge accuracy.
Conclusion
Derivatives are indispensable tools in modern finance for hedging and managing risks. They empower corporations, investors, and governments to stabilize cash flows, lock in prices, and protect portfolios from adverse market movements. Whether it’s a farmer securing crop prices, a multinational corporation mitigating currency fluctuations, or an investor guarding against market downturns, derivatives act as the financial world’s safety net.
However, their power must be wielded with caution. When used responsibly, derivatives strengthen financial resilience and promote global economic stability. When misused, they can amplify systemic risks, as seen during past financial crises.
In essence, derivatives are not inherently risky — it is how they are managed that determines their impact. When effectively structured and properly regulated, derivatives remain one of the most potent instruments for hedging risks and ensuring long-term financial security in an unpredictable world.

RELIANCE (Swing trade Idea)Reliance Industries Ltd. (RELIANCE) - Energy/Refining
Current Futures Price & Key Levels: Futures (28-Oct expiry) at ₹1,470 (spot ₹1,451); Support: ₹1,440 (200-DMA), Resistance: ₹1,500 (recent high); Swing Targets: ₹1,520-₹1,550.
Technical Setup: Double bottom breakout confirmed on weekly chart, price above 50/200 EMA crossover (bullish golden cross). RSI (14) at 62 (neutral-bullish, room to rise), MACD histogram expanding positively. Volume surge 20% above 20D avg (11.7M shares), price action shows momentum continuation post-consolidation.
Derivatives Data: OI build-up +15% in calls (long formation), PCR 0.76 (bullish, puts unwinding). IV down 2% to 16.75 (favorable for longs), roll-over 78% (strong carry-forward interest). Futures volume 1.1 Cr lots.
Fundamental/News Catalysts: Q2 earnings beat on retail/telecom growth; Jio 5G expansion news boosting sentiment.
Swing View: Bullish.
Entry Zone: ₹1,455-₹1,465.
Stop-Loss: ₹1,435 (below support).
Target Zone: ₹1,520 (initial), ₹1,550 (extended).
Risk-Reward Ratio: 1:2.2 (risk ₹20, reward ₹70-95).
Preferred Instrument: Futures (high liquidity, direct leverage).

Mastering Options Trading Strategies1. Understanding Options Basics
Options are derivative contracts that give the holder the right, but not the obligation, to buy or sell an underlying asset at a predetermined price (strike price) before or at expiration. There are two main types of options:
Call Options: Give the buyer the right to purchase the underlying asset.
Put Options: Give the buyer the right to sell the underlying asset.
Key components include:
Strike Price: The pre-agreed price at which the asset can be bought or sold.
Expiration Date: The date when the option contract becomes void.
Premium: The price paid to acquire the option.
Underlying Asset: The stock, index, commodity, or currency on which the option is based.
Options derive their value from intrinsic and extrinsic components. Intrinsic value reflects the option’s real value if exercised today, while extrinsic value represents the time value and implied volatility.
2. The Greeks – Risk and Reward Management
To master options, traders must understand the Greeks, which measure sensitivity to various risk factors:
Delta (Δ): Measures the rate of change of an option’s price relative to the underlying asset. Calls have positive delta, puts negative.
Gamma (Γ): Measures the rate of change of delta with respect to the underlying price.
Theta (Θ): Measures the time decay of options; critical for understanding how option value erodes over time.
Vega (V): Measures sensitivity to implied volatility.
Rho (ρ): Measures sensitivity to interest rate changes.
Mastering the Greeks allows traders to optimize positions, hedge risks, and understand profit/loss dynamics.
3. Basic Options Strategies
Beginners often start with simple strategies:
a) Long Call
Buying a call option is a bullish strategy. The trader anticipates that the underlying asset will rise above the strike price plus the premium paid. Risk is limited to the premium, while profit potential is theoretically unlimited.
b) Long Put
Buying a put is a bearish strategy. Profit increases as the asset price declines, with risk again limited to the premium.
c) Covered Call
This involves holding the underlying stock while selling a call option. It generates premium income but caps upside potential. Ideal for generating income in neutral to slightly bullish markets.
d) Protective Put
Holding the stock while buying a put protects against downside risk. It’s essentially insurance for your stock holdings, limiting losses while allowing for upside gains.
4. Intermediate Options Strategies
Once traders understand basic strategies, they can explore combinations that manage risk and reward more effectively.
a) Spreads
Vertical Spreads: Buying and selling options of the same type (calls or puts) with different strike prices. Examples:
Bull Call Spread: Buy a lower strike call, sell a higher strike call. Limited risk and profit potential.
Bear Put Spread: Buy a higher strike put, sell a lower strike put for a bearish but controlled position.
Horizontal/Calendar Spreads: Buy and sell options of the same strike price but different expirations, benefiting from time decay and volatility shifts.
Diagonal Spreads: Combination of vertical and calendar spreads, offering flexibility in directional bias, time decay, and volatility management.
b) Straddles
A straddle involves buying a call and a put at the same strike price and expiration. It profits from large price movements in either direction, making it ideal for events like earnings or economic announcements. Risk is limited to the combined premiums paid.
c) Strangles
Similar to straddles, but with different strike prices. It’s cheaper but requires larger price movement to profit.
d) Iron Condor
Selling an out-of-the-money call and put while buying further out-of-the-money options to limit risk. Ideal for range-bound markets, offering limited profit with controlled risk.
e) Butterfly Spread
Involves buying and selling multiple options to profit from minimal price movement. Combines a bull spread and bear spread to create a defined risk/reward profile.
5. Advanced Options Strategies
Professional traders employ advanced strategies to exploit market inefficiencies and volatility patterns.
a) Ratio Spreads
Buying and selling options in unequal ratios. It’s used for volatility plays or directional bias but requires careful risk monitoring.
b) Calendar Diagonal Adjustments
Adjusting existing spreads as the market moves, managing delta and theta exposure dynamically.
c) Volatility Arbitrage
Traders exploit differences between implied and historical volatility. Strategies like long straddles or strangles are used when implied volatility is mispriced.
d) Synthetic Positions
Creating equivalent positions using combinations of options and underlying assets:
Synthetic Long Stock: Buy call + sell put.
Synthetic Short Stock: Buy put + sell call.
These mimic stock exposure but require less capital.
6. Options Risk Management
Successful options trading hinges on effective risk control:
Position Sizing: Never risk more than a small percentage of capital on one trade.
Diversification: Spread options trades across sectors, expirations, and strategies.
Hedging: Use protective puts or inverse positions to limit downside.
Stop-Loss Orders: Predefine exit levels to prevent emotional decisions.
Volatility Awareness: Avoid buying expensive options during peak implied volatility.
7. Timing and Market Conditions
Options strategies depend heavily on market conditions:
Bullish Markets: Favor long calls, bull spreads, and covered calls.
Bearish Markets: Favor long puts, bear spreads, protective puts.
Range-Bound Markets: Favor iron condors, butterflies, and credit spreads.
High Volatility: Buy straddles or strangles to capitalize on large moves.
Low Volatility: Sell premium strategies like credit spreads or covered calls.
8. Execution and Trading Discipline
Mastery involves more than strategy knowledge. Execution and discipline are equally vital:
Plan Trades in Advance: Define entry, exit, and risk parameters.
Avoid Emotional Trading: Stick to strategies and rules.
Track Performance: Maintain a journal to analyze mistakes and successes.
Continuous Learning: Markets evolve; stay updated on new strategies and economic factors.
9. Tools for Options Traders
Modern traders leverage tools for analytics:
Options Pricing Models: Black-Scholes, Binomial, and Monte Carlo simulations for pricing and Greeks.
Options Scanners: Identify unusual activity, volatility spikes, and profitable spreads.
Backtesting Platforms: Test strategies on historical data before committing capital.
Broker Platforms: Must offer fast execution, risk management tools, and margin calculations.
10. Psychological and Strategic Edge
Options trading is as much psychological as mathematical:
Patience and Discipline: Wait for optimal setups; avoid chasing trades.
Adaptability: Adjust positions as market dynamics shift.
Understanding Market Sentiment: Technical and fundamental cues impact volatility and options pricing.
Risk-Reward Assessment: Always evaluate maximum loss versus potential gain before initiating trades.
11. Common Pitfalls to Avoid
Ignoring Greeks: Leads to unexpected losses from time decay or volatility changes.
Overleveraging: Options can magnify losses; excessive size can wipe accounts.
Lack of Strategy: Random trades without plan often fail.
Chasing Premiums: High volatility premiums may be overpriced; patience is key.
Neglecting Exit Plans: Without clear exit rules, profits can evaporate, and losses can magnify.
12. Path to Mastery
Mastering options trading requires:
Strong Foundation: Understand options mechanics, Greeks, and market behavior.
Structured Learning: Progress from basic calls and puts to spreads, straddles, and synthetic positions.
Practice: Use paper trading or simulated accounts to build experience without financial risk.
Continuous Analysis: Study past trades, track volatility patterns, and adapt strategies.
Discipline: Follow trading rules strictly, avoid impulsive decisions, and respect risk management principles.
Conclusion
Options trading offers unmatched flexibility and leverage, but it is complex and requires disciplined learning. Mastery comes from understanding the interplay of market conditions, volatility, and strategic positioning. By combining solid fundamentals, risk management, strategic execution, and psychological discipline, traders can convert options into a powerful tool for wealth creation and portfolio management. Whether aiming for conservative income strategies or aggressive directional bets, a structured approach to options trading ensures long-term success while minimizing unnecessary risks.

RELIANCE: At Crucial Levels! Expecting to bounce back!⚡ Price Analysis:
1️⃣ Price structure is still not bullish need confirmation.
2️⃣ Strong candle formation near the demand zone.
3️⃣ Price needs to HOLD above 1,310 for a strong bull rally to kick in!
⭐ Key Observations:
➡️ Major support area so expecting the price is start bounce back
➡️ Aggressive entry can be planned since confirmation is still pending
➡️ PERFECT Risk-Reward Ratio (RRR) with a very small risk – golden chance!
⚠️ Disclaimer: This is NOT a buy/sell recommendation. For learning ONLY. Views are personal. Please, do your due diligence before investing.⚠️
🍀Cheers! 🔥

RELIANCE Structure Analysis & Trade Plan
🔍 Chart Analysis
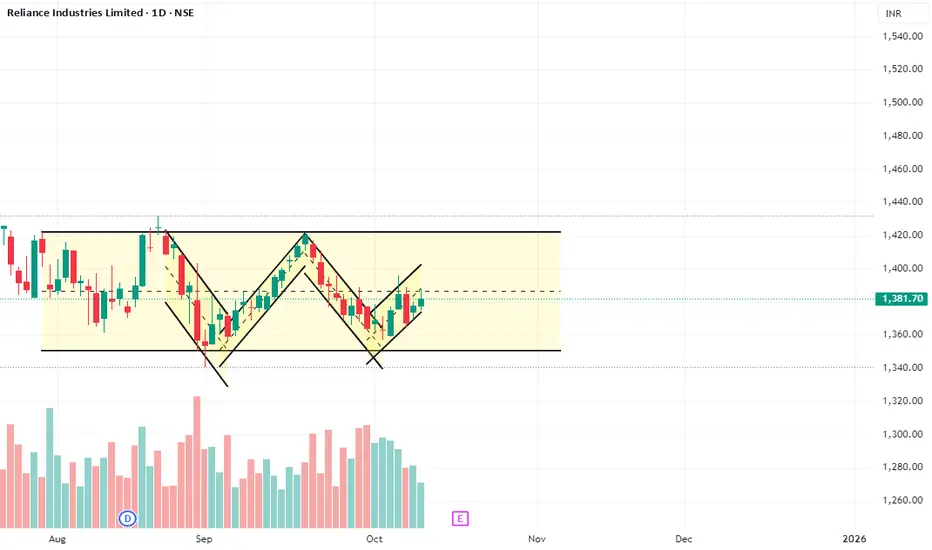
The chart for Reliance Industries Ltd. (RELIANCE) on the Daily timeframe shows the stock trading within a horizontal consolidation range since early August.
Pattern: The price is trapped in a Rectangle Pattern (consolidation range). Within this range, a visible 'W' pattern (Double Bottom) is forming between September and October.
Range Boundaries:
Resistance (Supply Zone): The upper boundary is around ₹1,420 - ₹1,430.
Support (Demand Zone) : The lower boundary is around ₹1,345 - ₹1,355.
'W' Pattern Neckline: The neckline for the small 'W' pattern (the high between the two bottoms in September/October) is approximately at ₹1,400.
Current Position: The stock is currently trading just under the 'W' neckline at ₹1,381.70, near the midpoint of the larger consolidation range (indicated by the dashed line).
The Market Structure Shift (MSS) for the overall range would only be confirmed upon a decisive break of the main Resistance or Support. The small 'W' pattern suggests a potential short-term bullish move within the range, aiming for the upper boundary.
📈 Trade Plan (Range Trading & Short-Term Bullish Bias)
The plan has two components: a short-term move based on the 'W' pattern and a longer-term plan for the range breakout.
1. Short-Term Bullish Scenario (Within the Range)
This trade is based on the small 'W' (Double Bottom) pattern completing and pushing the price towards the main range resistance.
Entry Condition: A decisive close (Daily) ABOVE the 'W' Neckline of ₹1,400.
Stop Loss (SL): Place the stop loss below the recent swing low that forms the second bottom of the 'W', for example, around ₹1,365.
Target (T): Target the upper boundary of the main consolidation range at ₹1,420 - ₹1,430.
2. Breakout Plan (MSS Confirmation)
The most significant moves will occur when the stock breaks the main consolidation range.
Confirmed MSS to the Upside (Trend Continuation):
Entry Condition: A Daily close and sustained trade ABOVE ₹1,430 on strong volume. This would confirm the Market Structure Shift (MSS) to the upside.
Target: The minimum measured move would be the height of the range (₹1,430 - ₹1,350 = ₹80) projected upwards, yielding a Target ≈ ₹1,510.
Confirmed MSS to the Downside (Trend Reversal):
Entry Condition: A Daily close and sustained trade BELOW ₹1,350 on strong volume. This would confirm the Market Structure Shift (MSS) to the downside.
Target: The minimum measured move would be the height of the range (₹80) projected downwards, yielding a Target ≈ ₹1,270.
⚠️ Risk Management
Trading at the current price of ₹1,381.70 is risky as it is in the middle of the range.
Priority should be given to waiting for either the 'W' neckline (₹1,400) to break for the short-term target, or for the main range boundaries (₹1,430 or ₹1,350) to break for the larger trend trade. Wait for volume confirmation on all major breakouts.
Trading Volume Spiking: Understanding Market Dynamics1. Causes of Trading Volume Spikes
Trading volume spikes are generally triggered by market-moving events, investor psychology, or technical market dynamics. These causes can be grouped into several categories:
a) Fundamental News Events
Fundamental news is one of the primary reasons for sudden spikes in trading volume. Market participants react to new information about a company, industry, or economy, leading to increased buying and selling activity. Key examples include:
Earnings Reports: When a publicly traded company releases quarterly or annual earnings, deviations from market expectations can trigger heavy trading. A strong earnings beat may cause buying volume to surge, while disappointing earnings can provoke panic selling.
Corporate Announcements: Mergers, acquisitions, dividends, or stock splits can trigger spikes as traders adjust positions based on anticipated impacts.
Economic Data Releases: Broader economic indicators such as unemployment rates, GDP growth, or inflation numbers can impact trading volume across sectors.
Policy Changes: Central bank rate announcements, government regulations, or geopolitical developments can also induce sudden spikes.
b) Technical Triggers
Many traders rely on technical analysis, using charts, indicators, and historical price patterns to make decisions. Certain price movements or indicator signals often trigger high-volume trades:
Breakouts and Breakdowns: When the price breaks through significant resistance or support levels, it often triggers a rush of orders from both retail and institutional traders.
Moving Averages and Indicators: Crossing key technical levels, such as the 50-day or 200-day moving average, can prompt automated or algorithmic trading to enter or exit positions.
Volume Confirmation Signals: Traders often look for volume spikes as confirmation of trend strength. A price move accompanied by unusually high volume is considered more reliable.
c) Market Sentiment and Psychology
Human behavior plays a large role in volume spikes. Fear, greed, and herd behavior can amplify trading activity:
Panic Selling or Buying Frenzy: Market participants may act collectively during periods of fear or exuberance, creating sudden surges in volume.
Speculation and Rumors: Even unverified news or market rumors can prompt significant spikes, as traders try to capitalize on potential opportunities.
d) Algorithmic and High-Frequency Trading
Modern markets are heavily influenced by algorithmic trading, which can amplify volume spikes. High-frequency trading (HFT) algorithms react in milliseconds to market signals, leading to bursts of buying or selling activity that may not reflect fundamental changes.
2. Interpreting Trading Volume Spikes
Volume spikes are not merely numerical anomalies; they carry deep implications for market participants. Understanding what a volume spike signifies is crucial for strategy development.
a) Confirmation of Price Movement
A spike in volume often confirms the strength of a price movement. For example:
A price surge with high volume indicates strong buying interest, suggesting the uptrend may continue.
Conversely, a price drop with high volume reflects strong selling pressure and can indicate a genuine downtrend.
Without significant volume, price movements may lack conviction and can be more prone to reversals.
b) Potential Trend Reversals
While high volume can confirm trends, extreme spikes can sometimes indicate trend exhaustion:
A rapid surge in volume after a prolonged price move may suggest that the market is overextended.
In some cases, this leads to a reversal, as traders take profits and new participants step in to bet against the trend.
c) Liquidity Insights
Volume spikes provide insight into market liquidity:
Higher volume generally improves liquidity, allowing larger trades to execute without significant price slippage.
Low volume during a spike, however, may indicate market thinness and volatility, making it riskier to trade large positions.
d) Institutional Activity
Unusually high volume often reflects institutional participation, such as hedge funds, mutual funds, or pension funds entering or exiting positions. These large trades can significantly influence price levels, especially in less liquid stocks.
3. Strategies for Traders During Volume Spikes
Traders and investors can use volume spikes strategically. Here are key approaches:
a) Momentum Trading
Momentum traders thrive on high-volume moves. A sudden increase in volume coupled with a breakout or breakdown can signal a strong directional trade opportunity. Traders often enter in the direction of the volume surge, expecting follow-through.
b) Volume-Based Confirmation
Technical analysts often use volume spikes as confirmation tools. For example:
Breakout Confirmation: A breakout above resistance accompanied by higher-than-average volume is more likely to sustain.
Trend Validation: Sustained trends confirmed by rising volume tend to be stronger and more reliable.
c) Contrarian Approach
Contrarian traders may interpret extreme volume spikes as signals of market exhaustion. After intense buying or selling, the market may be ripe for a pullback. This approach requires careful risk management.
d) Risk Management Adjustments
Volume spikes often coincide with higher volatility. Traders should adjust stop-loss levels, position sizes, and entry points to accommodate rapid price swings. Ignoring volume-related risk can result in significant losses.
4. Tools and Indicators for Monitoring Volume Spikes
Modern trading platforms provide a range of volume indicators to detect spikes and guide decisions:
Volume Bars: Basic histogram bars show volume per period and highlight anomalies relative to average volume.
On-Balance Volume (OBV): OBV measures cumulative buying and selling pressure, helping identify accumulation or distribution trends.
Volume Moving Averages: Traders often compare current volume against a 10-day or 20-day average to spot unusual spikes.
Volume-Price Trend (VPT): VPT combines volume and price changes to assess whether volume supports the direction of the trend.
These tools help traders distinguish between meaningful volume spikes and random market noise.
5. Case Studies of Trading Volume Spikes
Historical examples illustrate the significance of volume spikes:
Tech Stocks during Earnings Season: Companies like Apple or Microsoft often experience 3–5x average daily volume on earnings days, reflecting investor reaction to profits, guidance, or product announcements.
Market Crashes: During the 2020 COVID-19 market crash, trading volumes surged as investors panicked, providing liquidity but also amplifying volatility.
Cryptocurrency Market Events: Cryptocurrencies like Bitcoin often experience volume spikes during regulatory news or large institutional trades, resulting in rapid price swings.
6. Potential Pitfalls and Misinterpretations
While volume spikes are useful, traders must avoid over-reliance:
False Signals: Not all spikes indicate a trend continuation; some are caused by short-term speculative activity.
Thin Markets: Volume spikes in low-liquidity markets can exaggerate price moves and mislead traders.
Algorithmic Distortions: HFT can generate temporary spikes without any fundamental significance.
Proper analysis requires combining volume with other indicators such as price action, moving averages, and market news.
7. Conclusion
A trading volume spike is a key market signal reflecting a surge in trading activity, often triggered by fundamental events, technical movements, market sentiment, or institutional participation. For traders, volume spikes provide vital insights into the strength, liquidity, and sustainability of price movements. High volume confirms trends, signals potential reversals, and highlights institutional activity. However, spikes also bring risks due to higher volatility and potential market noise.
By integrating volume analysis into trading strategies, using technical indicators, and monitoring market news, traders can make more informed, strategic decisions. Whether you are a momentum trader, contrarian investor, or risk-conscious portfolio manager, understanding volume spikes is essential for navigating modern financial markets effectively.
Reliance eyes breakout as bulls return post earningsTopic Statement:
Reliance has gained bullish momentum following strong earnings and a market rally, now approaching a key resistance zone with breakout potential.
Key Points:
1. The stock is climbing toward a triple top formation, which carries a high probability of a bullish breakout
2. It is trading above both the 50-day and 200-day EMAs, indicating strength but also making it relatively expensive in the short term
3. Price continues to move comfortably within its established up-trending channel, maintaining a well-supported bullish structure

Divergence SecretsOption Greeks: Measuring Sensitivity
The Option Greeks are metrics that measure how different factors affect an option’s price. The key Greeks include:
Delta: Change in option price relative to the underlying asset’s price.
Theta: Time decay effect.
Vega: Sensitivity to volatility changes.
Gamma: Rate of change of Delta.
Rho: Sensitivity to interest rates.
These Greeks help traders understand risk exposure and manage positions scientifically. For example, a trader might use Theta to manage time decay in short-term options or Vega to hedge against volatility spikes. Mastery of Greeks is crucial for professional option traders who aim for consistency and precision.

RELIANCE📊 Monthly Technical Levels (October 2025)
Based on standard pivot point calculations, the key support and resistance levels for Reliance Industries Ltd on a 1-month timeframe are:
Pivot Point: ₹1,375.53 (neutral zone)
Resistance Levels:
R1: ₹1,410.47
R2: ₹1,456.93
R3: ₹1,491.87
Support Levels:
S1: ₹1,329.07
S2: ₹1,294.13
S3: ₹1,247.67
These levels are derived from standard pivot point calculations, which are commonly used to identify potential support and resistance zones

SME IPO Buzz for Huge ProfitsUnderstanding SME IPOs
An SME IPO is an offering where small and medium-sized enterprises list their shares on a stock exchange specifically designed for SMEs. Unlike the main board of stock exchanges such as NSE or BSE, SME platforms provide an alternative for companies that may not meet the rigorous requirements of the main board. For instance, the BSE SME platform and NSE Emerge cater exclusively to SMEs, offering a regulated space for capital-raising while giving investors a chance to enter early-stage growth companies.
SME IPOs serve multiple purposes for companies:
Raising Capital for Expansion: SMEs often require funds for scaling operations, launching new products, or entering new markets.
Enhancing Visibility and Credibility: Listing on a stock exchange enhances transparency and corporate governance, boosting investor confidence.
Providing Liquidity for Founders: Early investors and promoters gain an exit route or partial liquidity.
Attracting Institutional and Retail Investors: SME listings bring in a wider investor base, including retail, institutional, and high-net-worth individuals.
Why SME IPOs are Attractive for Investors
Investors are drawn to SME IPOs for several compelling reasons:
1. Early-Stage Growth Potential
SMEs typically operate in niche markets with high growth trajectories. Investing at an early stage allows investors to ride the growth curve before the company becomes a large-cap entity. If the SME successfully scales operations and captures market share, the returns can be significant.
2. Price Discovery Advantage
SME IPOs are often priced at lower levels compared to established companies. This provides investors the chance to buy shares at a relatively affordable valuation, amplifying potential upside if the company performs well.
3. Portfolio Diversification
Including SME stocks in a portfolio introduces diversity by sector, size, and growth profile. Many SMEs operate in innovative sectors such as fintech, healthtech, renewable energy, and manufacturing, providing exposure beyond conventional blue-chip stocks.
4. Potential for High Listing Gains
A well-performing SME IPO can witness immediate listing gains, creating short-term profit opportunities for investors. Investors often see a surge in stock price upon listing due to the novelty and excitement surrounding these companies.
Risks Associated with SME IPO Investments
While SME IPOs hold the promise of huge profits, they also come with inherent risks that investors must understand:
1. Limited Track Record
Many SMEs have a short operating history and limited financial data, making it challenging to evaluate long-term sustainability. Investors rely heavily on management quality, business model, and market potential rather than historical performance.
2. Liquidity Concerns
SME stocks often have lower trading volumes compared to mainboard stocks. This limited liquidity can result in price volatility and difficulties in buying or selling large quantities without impacting the stock price.
3. High Volatility
Due to small market capitalization and sensitivity to business performance, SME stocks can be highly volatile. A single news event, earnings report, or market sentiment shift can significantly affect stock prices.
4. Regulatory and Compliance Risks
Though SME exchanges provide regulatory oversight, SMEs may be more prone to operational or governance challenges. Investors must scrutinize financial statements, management credibility, and compliance with listing norms.
5. Market Sentiment Dependency
SME IPO performance is often heavily influenced by investor sentiment and market trends. A bearish market or economic slowdown can dampen IPO performance irrespective of the company’s fundamentals.
The Regulatory Framework for SME IPOs in India
The Securities and Exchange Board of India (SEBI) has established clear guidelines to protect investors while enabling SMEs to raise capital efficiently. Key features include:
Eligibility Criteria:
Minimum net worth requirements for promoters.
Track record of profitability for a specific period.
Minimum post-IPO capital to ensure sustainability.
Disclosure Norms:
SMEs must submit a detailed prospectus (Offer Document) including:
Business overview and expansion plans.
Financial statements audited by certified professionals.
Risks and uncertainties associated with operations.
Listing Norms:
SME shares can be listed on SME exchanges with less stringent norms compared to the main board.
Mandatory compliance with SEBI regulations regarding corporate governance, reporting, and investor protection.
Investor Protection:
Retail investors often receive a preferential allotment.
SEBI mandates transparency to reduce fraudulent practices and enhance trust.
Strategies to Maximize Profits from SME IPOs
Investing in SME IPOs requires a blend of research, timing, and strategy. Here are some approaches:
1. Research the Company Thoroughly
Before investing, study the SME’s business model, revenue streams, management team, competitive advantage, and sector growth potential. Understanding the company’s market positioning can help identify whether it has the potential for long-term profits.
2. Evaluate the IPO Valuation
Analyze the price-to-earnings (P/E) ratio, price-to-book (P/B) ratio, and industry benchmarks. SMEs with reasonable valuations relative to their growth prospects tend to offer better returns.
3. Focus on Management Quality
The credibility, vision, and track record of promoters and key management personnel play a critical role in determining success. Experienced and visionary leadership increases the likelihood of sustainable growth.
4. Diversify Investments
Investing in multiple SME IPOs can mitigate risk. Diversification reduces dependence on the performance of a single company and increases the chances of capturing profitable opportunities.
5. Timing of Exit
Decide whether to pursue short-term listing gains or long-term growth. Some SME IPOs provide immediate listing gains due to high initial demand, while others may take months or years to realize their full potential.
6. Monitor Post-Listing Performance
After listing, monitor quarterly earnings, operational performance, and market trends. Consistent growth and positive news flow often lead to sustained price appreciation.
Sector Trends Driving SME IPOs
Several sectors are fueling the SME IPO buzz:
Technology and IT Services: SMEs in software development, fintech, and cloud solutions are attracting investors due to exponential growth potential.
Healthcare and Pharmaceuticals: Healthtech and pharma SMEs benefit from rising healthcare demands and innovation in diagnostics and therapeutics.
Renewable Energy: With global emphasis on sustainability, SMEs in solar, wind, and green technologies are capturing investor interest.
Consumer Goods and Retail: SMEs catering to niche markets in FMCG, e-commerce, and specialty products show promising revenue growth.
Manufacturing and Infrastructure: SMEs in specialized manufacturing and infrastructure contribute to India’s industrial growth, providing strong profit potential.
The Investor Psychology Behind SME IPO Buzz
The excitement around SME IPOs is partly driven by investor psychology. Early investors are drawn to stories of rapid growth, innovation, and market disruption. Media coverage, social buzz, and peer discussions often create a sense of urgency, amplifying demand. Additionally, success stories of SME IPOs delivering massive returns reinforce optimism and speculation. While this buzz can lead to profitable opportunities, it can also inflate valuations and increase short-term volatility.
Case Studies of Profitable SME IPOs
Several SMEs have generated significant returns post-IPO:
Company A (IT SME): Listed at ₹50 per share and scaled rapidly in cloud services. Within two years, the share price appreciated fivefold.
Company B (Healthcare SME): A diagnostics company leveraged innovative technology to capture market share, yielding substantial listing gains for early investors.
Company C (Renewable SME): Focused on solar energy solutions and benefited from government incentives, leading to consistent stock appreciation post-IPO.
These examples illustrate that careful selection, backed by research and market understanding, can translate SME IPO investments into substantial profits.
Conclusion
SME IPOs represent a dynamic and profitable segment of the Indian capital market, offering investors a chance to participate in early-stage growth companies. The potential for huge profits stems from affordable valuations, high growth potential, and market excitement. However, these opportunities are accompanied by risks such as limited track record, volatility, and liquidity challenges.
A successful SME IPO investment strategy requires thorough research, careful evaluation of management quality, diversification, and monitoring post-listing performance. By balancing risk and reward, investors can capitalize on the SME IPO buzz while contributing to the growth of India’s vibrant entrepreneurial ecosystem.
Ultimately, SME IPOs are not just investment vehicles—they are gateways to participating in the nation’s growth story, offering both financial returns and the satisfaction of supporting innovative enterprises that shape the future of the economy.

Part 7 Trading Master ClassOption Greeks: Measuring Sensitivity
The Option Greeks are metrics that measure how different factors affect an option’s price. The key Greeks include:
Delta: Change in option price relative to the underlying asset’s price.
Theta: Time decay effect.
Vega: Sensitivity to volatility changes.
Gamma: Rate of change of Delta.
Rho: Sensitivity to interest rates.
These Greeks help traders understand risk exposure and manage positions scientifically. For example, a trader might use Theta to manage time decay in short-term options or Vega to hedge against volatility spikes. Mastery of Greeks is crucial for professional option traders who aim for consistency and precision.

Part 1 Candle Stick Pattern Option Buyers vs. Sellers
In every option trade, there’s a buyer and a seller (writer). The buyer pays a premium for the right to exercise the contract, while the seller earns that premium but takes on potential obligations. Buyers face limited loss (premium paid) and unlimited profit potential (for calls). Sellers, however, face limited profit (premium received) but unlimited potential loss if the market moves against them. Therefore, option writing demands experience, strong risk control, and margin support. Understanding this balance of risk and reward is central to effective option trading.

RELIANCE 1 Day Time Frame 📈 Daily Support & Resistance Levels
Immediate Support: ₹1,399.10
Key Resistance: ₹1,417.80
Pivot Point: ₹1,407.53
These levels are based on standard pivot point calculations and indicate that the stock is trading just below the immediate resistance level, suggesting potential for upward movement.
🔧 Technical Indicators
RSI (14-day): 62.51 — Neutral to slightly bullish
MACD: 0.730 — Positive momentum
Moving Averages:
5-day SMA: ₹1,373.00 — Buy signal
50-day SMA: ₹1,350.00 — Buy signal
200-day SMA: ₹1,300.00 — Buy signal
Stochastic Oscillator: 75.00 — Overbought, indicating potential for a pullback
Supertrend: ₹1,414.07 — Mildly bearish
Parabolic SAR: ₹1,357.52 — Mildly bullish
These indicators suggest a generally positive trend, with some caution due to overbought conditions.
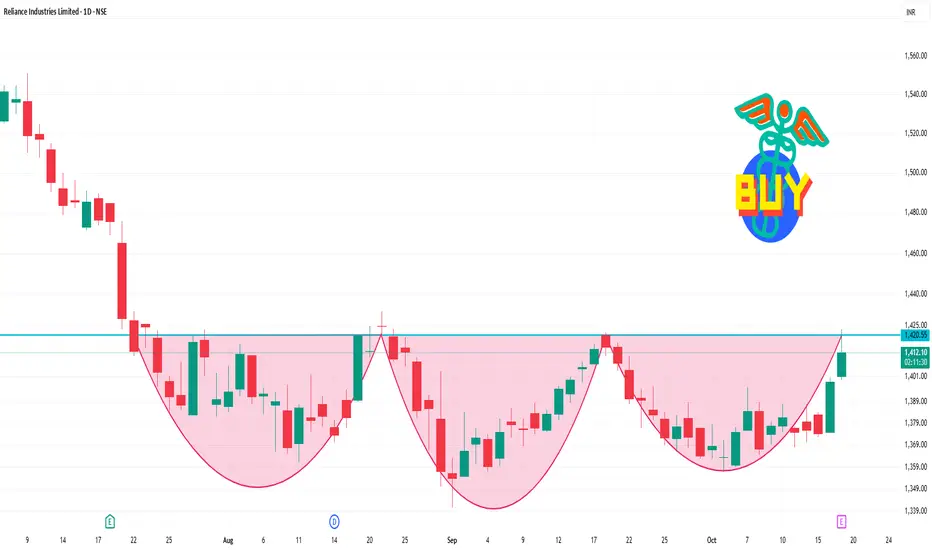
Role of Institutional Traders in Financial Markets1. Understanding Institutional Traders
Institutional traders are large entities that trade securities in significant volumes. Unlike retail investors, who typically invest their own money, institutional traders manage pooled funds on behalf of clients or members. These institutions include:
Mutual Funds: Manage portfolios for individual and institutional investors.
Hedge Funds: Employ sophisticated strategies to generate high returns.
Pension Funds: Invest retirement savings to ensure long-term growth.
Insurance Companies: Allocate funds to meet future liabilities.
Investment Banks: Facilitate trading and market-making activities.
Institutional traders differ from retail traders in terms of scale, resources, and strategies. Their transactions often involve large volumes of securities, which can move markets and influence price trends.
2. Contribution to Market Liquidity
One of the most significant roles of institutional traders is enhancing market liquidity. Liquidity refers to the ease with which an asset can be bought or sold without significantly affecting its price. Institutional traders contribute to liquidity in several ways:
High Trading Volumes: Large transactions by institutional traders increase the overall volume in the market, making it easier for other participants to buy and sell assets.
Market-Making Activities: Some institutions act as market makers, offering buy and sell prices for securities, which stabilizes markets and reduces bid-ask spreads.
Diversified Portfolios: Institutions often hold a mix of equities, bonds, and derivatives, which encourages continuous trading across various asset classes.
By improving liquidity, institutional traders make financial markets more efficient, enabling smoother price discovery and reducing transaction costs for all participants.
3. Price Discovery and Market Efficiency
Institutional traders are crucial to the price discovery process, the mechanism by which markets determine the fair value of an asset based on supply and demand. Their extensive research, analytical models, and access to information allow them to identify mispriced assets and correct market inefficiencies. Key aspects include:
Research-Driven Trading: Institutional traders rely on macroeconomic analysis, company fundamentals, and quantitative models to guide investment decisions.
Information Asymmetry Reduction: By acting on available information, they help reduce information gaps, leading to more accurate asset pricing.
Market Stabilization: Large institutions can dampen extreme price fluctuations by executing trades that align assets closer to their intrinsic values.
Without institutional participation, markets could become more volatile, and asset prices might not reflect true economic values.
4. Influence on Market Trends
Institutional traders often have the power to shape market trends due to the size of their transactions. When an institutional investor buys or sells a significant position, it can trigger movements that other market participants follow. This phenomenon, sometimes referred to as “herding behavior,” can amplify trends:
Momentum Creation: Large-scale purchases or sales can generate momentum, attracting retail investors and other institutions.
Sector Impact: Institutional focus on specific sectors can lead to substantial price changes in those industries.
Market Sentiment: Institutional activity often signals confidence or concern about market conditions, influencing overall investor sentiment.
However, their influence also requires careful risk management, as misjudgments by institutional traders can exacerbate market volatility.
5. Risk Management and Stability
Institutional traders implement sophisticated risk management practices that contribute to financial market stability. Their strategies include:
Diversification: Spreading investments across multiple asset classes and regions to mitigate risk.
Hedging: Using derivatives, options, and futures to protect portfolios against adverse market movements.
Asset-Liability Matching: Particularly for pension funds and insurance companies, aligning assets with expected liabilities ensures long-term solvency.
These practices not only protect institutional portfolios but also reduce systemic risk in the broader market. Large-scale defaults or mismanaged portfolios could destabilize markets, but prudent institutional risk management acts as a stabilizing force.
6. Contribution to Capital Formation
Institutional traders play a vital role in capital formation, providing funds that fuel business expansion and economic growth. By investing in equities, bonds, and other financial instruments, they enable companies to raise capital efficiently. Key contributions include:
Equity Investments: Buying stocks provides companies with capital for growth, research, and innovation.
Debt Financing: Purchasing corporate bonds allows businesses to fund operations without diluting ownership.
Infrastructure Development: Institutional capital often supports large-scale projects such as transportation, energy, and technology initiatives.
Without institutional investors, companies would face higher costs of raising capital, slowing economic development and reducing opportunities for growth.
7. Long-Term Investment Perspective
Unlike retail investors who may focus on short-term gains, many institutional traders adopt a long-term investment horizon. This perspective provides several advantages:
Market Stability: Long-term positions reduce short-term speculative volatility.
Sustainable Growth: Investing in fundamentally strong companies supports steady economic progress.
Strategic Influence: Institutional investors can engage with company management to encourage better governance and operational efficiency.
By maintaining a long-term view, institutional traders contribute to a more stable and efficient financial ecosystem.
8. Technological and Analytical Edge
Institutional traders leverage cutting-edge technology and analytics to gain a competitive advantage. These tools enable faster and more accurate trading, research, and risk assessment:
Algorithmic Trading: Automated strategies execute trades at optimal prices and volumes.
Big Data Analytics: Analyzing large datasets allows institutions to identify trends and opportunities.
Artificial Intelligence (AI): AI models enhance predictive accuracy for market movements and portfolio optimization.
Their technological prowess often sets the benchmark for market innovation, indirectly benefiting retail investors by improving market efficiency.
9. Regulatory Influence and Market Integrity
Institutional traders operate under stringent regulatory frameworks that promote market integrity. Their compliance with reporting standards, risk management requirements, and governance rules ensures transparency and accountability. Additionally:
Market Oversight: Regulators monitor institutional activities closely due to their market impact.
Ethical Practices: Institutional adherence to fiduciary responsibilities ensures that clients’ interests are prioritized.
Crisis Management: In times of financial stress, institutions can work with regulators to stabilize markets, preventing systemic collapse.
Through these mechanisms, institutional traders help maintain investor confidence and a fair playing field in financial markets.
10. Challenges and Criticisms
Despite their significant contributions, institutional traders face challenges and criticisms:
Market Manipulation Concerns: Large trades can influence prices, leading to perceptions of unfair advantage.
Systemic Risk: The collapse of a major institution can trigger widespread financial instability.
Short-Termism Pressure: Some institutional funds prioritize quarterly performance, which may conflict with long-term economic growth.
Addressing these challenges requires effective regulation, transparency, and ethical conduct.
11. Case Studies of Institutional Influence
Several historical events illustrate the influence of institutional traders:
2008 Financial Crisis: The collapse of major institutional players like Lehman Brothers highlighted systemic risks associated with large-scale institutional trading.
Quantitative Easing Response: Post-crisis, institutional investors played a crucial role in channeling central bank liquidity into productive sectors.
Tech Sector Boom: Large institutional investments in technology companies drove rapid growth and innovation in the sector.
These examples underscore the dual nature of institutional influence—both stabilizing and potentially destabilizing.
12. Future of Institutional Trading
The landscape of institutional trading is evolving rapidly due to technological advancements, regulatory changes, and global interconnectedness. Key trends include:
Increased Algorithmic and AI Trading: Enhancing efficiency and predictive capabilities.
Sustainable Investing: Growing focus on Environmental, Social, and Governance (ESG) criteria.
Global Diversification: Expanding investments across emerging markets and alternative assets.
Blockchain and Digital Assets: Exploring opportunities in decentralized finance (DeFi) and cryptocurrencies.
As these trends unfold, institutional traders will continue to shape the structure, efficiency, and direction of financial markets.
Conclusion
Institutional traders are indispensable to financial markets. Their contributions span liquidity provision, price discovery, risk management, capital formation, and market stability. By leveraging scale, research, technology, and a long-term perspective, they not only influence market trends but also facilitate broader economic growth. However, their power also comes with responsibility; effective regulation and ethical practices are essential to prevent systemic risks and maintain market integrity.
In essence, institutional traders act as both market stabilizers and catalysts, driving efficiency, innovation, and growth in the global financial system. Understanding their role is crucial for anyone seeking to navigate the complexities of modern financial markets.
RELIANCE 1 Month Time Frame📊 Monthly Pivot Levels (October 2025)
Based on monthly pivot point analysis, key technical levels are as follows:
Pivot Point: ₹1,375.53
Resistance Levels: ₹1,410.47 (R1), ₹1,456.93 (R2), ₹1,491.87 (R3)
Support Levels: ₹1,329.07 (S1), ₹1,294.13 (S2), ₹1,247.67 (S3)
The pivot point of ₹1,375.53 indicates a neutral sentiment. Trading above this level may suggest bullish momentum, while trading below it could indicate bearish pressure.
📈 Technical Indicators Summary
RSI (14-day): Approximately 50.55, indicating a neutral market condition.
MACD: 0.190, suggesting a mild bullish trend.
Moving Averages: Neutral outlook with equal buy and sell signals across various timeframes.
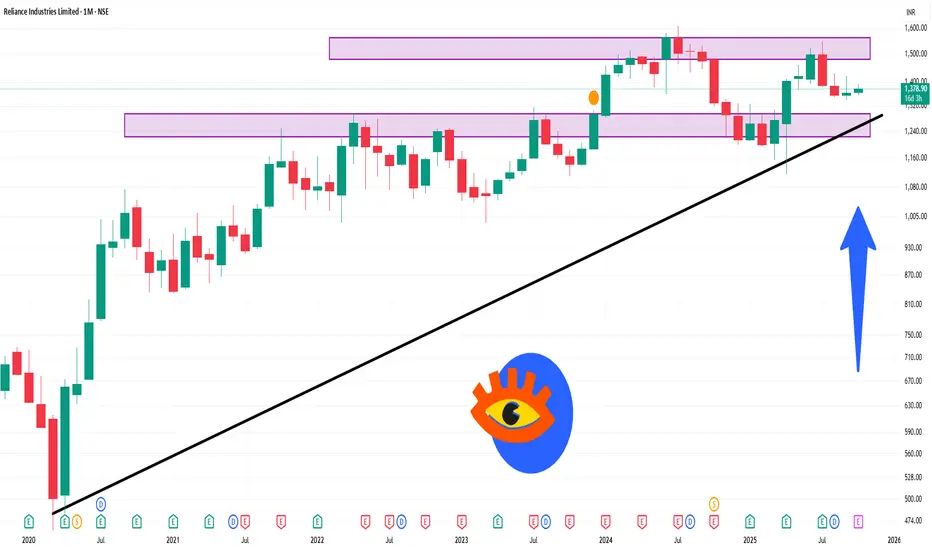
Part 1 Ride The Big Moves Hedging with Options
One of the most practical uses of options is hedging, which means reducing risk exposure in an existing portfolio.
For example, suppose you own 1,000 shares of Reliance Industries at ₹2,500 each. You worry about short-term market declines. You can buy put options with a strike price near ₹2,450.
If the price drops, your stock loses value — but the put option gains value, reducing your overall loss.
Similarly, farmers, exporters, and institutions often use options to lock in prices and protect against adverse moves in commodities, currencies, or interest rates.

Divergence SecretsThere are two main types of options: Call Options and Put Options.
A Call Option gives the buyer the right to buy an asset at a predetermined price, called the strike price, before the expiry date. Investors buy calls when they expect the price of the underlying asset to rise.
A Put Option, on the other hand, gives the buyer the right to sell an asset at the strike price before expiry. Traders buy puts when they expect the asset’s price to fall.

Advanced Trading Methods: Mastering Modern Market Strategies1. The Foundation of Advanced Trading
Before diving into the methods, it’s essential to understand what makes a trading approach “advanced.” Advanced trading involves:
Complex analytical frameworks: Using mathematical and statistical models to identify opportunities.
Data-driven decision-making: Reliance on historical and real-time market data.
Algorithmic execution: Automating trades for efficiency and precision.
Risk-adjusted performance: Focusing on consistent, sustainable returns rather than speculative profits.
Behavioral mastery: Understanding and managing human emotions and biases.
An advanced trader combines multiple dimensions — strategy, analysis, risk management, and psychology — into a cohesive trading system.
2. Algorithmic and Quantitative Trading
a. Algorithmic Trading
Algorithmic trading (or “algo trading”) uses computer programs to automatically execute trades based on predefined criteria such as price, volume, and timing. Algorithms help eliminate emotional bias and execute trades faster than human capability.
Key types of algorithmic strategies:
Trend-following algorithms: Identify momentum patterns using moving averages or breakouts.
Mean reversion algorithms: Assume prices will revert to historical averages after deviations.
Arbitrage strategies: Exploit temporary price differences between related instruments.
Market-making algorithms: Provide liquidity by continuously quoting buy and sell prices.
Statistical arbitrage: Use statistical models to detect short-term mispricings between correlated assets.
Algorithmic trading dominates global market volumes, with institutions using complex systems that analyze thousands of data points in milliseconds.
b. Quantitative Trading
Quantitative (quant) trading relies on mathematical modeling and statistical analysis to forecast price movements. Quant traders design models that identify high-probability trade setups.
Quantitative models include:
Factor models: Evaluate stocks based on fundamental factors like earnings, growth, or volatility.
Machine learning models: Use AI to detect nonlinear relationships in large datasets.
Time-series models: Predict future price movements from historical trends using ARIMA, GARCH, or Kalman filters.
Quantitative trading requires programming knowledge (Python, R, MATLAB) and a strong grasp of probability, calculus, and econometrics.
3. Technical Mastery: Advanced Charting and Indicators
a. Multi-Time Frame Analysis
Professional traders analyze price behavior across multiple time frames to align long-term trends with short-term setups. For instance, a trader may confirm an uptrend on the weekly chart and then enter trades on the 1-hour chart to optimize timing.
b. Advanced Indicators
Ichimoku Cloud: Combines support, resistance, and momentum in one view.
Volume Profile: Analyzes traded volume at each price level to identify high-liquidity zones.
Fibonacci Extensions: Predict potential price targets during strong trends.
Bollinger Band Width: Measures volatility expansion or contraction phases.
Average True Range (ATR): Quantifies market volatility for dynamic stop-loss placement.
c. Harmonic Patterns and Elliott Wave Theory
Advanced traders often use harmonic patterns (like Gartley, Bat, and Butterfly) to identify high-probability reversal zones based on Fibonacci ratios. Similarly, Elliott Wave Theory interprets market psychology through wave structures, forecasting long-term cycles of optimism and pessimism.
4. Price Action and Market Structure
While indicators are helpful, many professional traders rely heavily on price action — pure price movement without lagging indicators.
Key components include:
Supply and Demand Zones: Identify institutional order blocks where price reacts strongly.
Liquidity Pools: Areas where stop-losses cluster, often targeted by large players.
Break of Structure (BOS): A shift in market trend confirmed by price breaking a significant high or low.
Order Flow Analysis: Uses volume and bid-ask data to visualize market participant behavior.
By mastering market structure, traders can anticipate institutional activity instead of reacting to it.
5. Derivative-Based Trading Methods
Advanced traders frequently use derivatives — such as options, futures, and swaps — to manage risk and enhance returns.
a. Options Trading
Options offer strategic flexibility through structures like:
Delta-neutral strategies: Profiting from volatility (e.g., straddles, strangles).
Spreads: Combining multiple options to manage directional exposure and cost.
Covered Calls and Protective Puts: Hedging long-term investments.
b. Futures and Hedging
Futures allow traders to speculate on or hedge against price movements in commodities, indices, and currencies. Advanced traders manage leverage, margin requirements, and roll-over costs to maintain efficient positions.
c. Volatility Trading
Volatility is an asset in itself. Advanced traders use instruments like the VIX index, volatility ETFs, or implied volatility analysis to construct trades that profit from market uncertainty.
6. Statistical and Probabilistic Methods
Trading success depends on probability, not certainty. Advanced traders apply statistical techniques to quantify and manage uncertainty.
Core techniques include:
Monte Carlo simulations: Model potential trade outcomes over thousands of iterations.
Backtesting: Testing strategies on historical data to evaluate robustness.
Optimization and curve fitting: Fine-tuning parameters without overfitting.
Risk-reward ratio and expectancy: Measuring expected profit per trade over time.
Sharpe and Sortino ratios: Evaluating risk-adjusted returns.
Probability-based thinking helps traders focus on edge and consistency rather than outcome-driven emotions.
7. Automated Trading and Artificial Intelligence
AI-driven trading is the frontier of modern finance. Machine learning models can adapt and learn from new data, identifying patterns human traders might miss.
Applications of AI in trading:
Natural Language Processing (NLP): Analyzing news sentiment and social media for market signals.
Reinforcement learning: Algorithms that self-improve through simulated environments.
Neural networks: Detecting nonlinear price relationships and predicting future volatility.
Robo-advisors: Automated portfolio management systems optimizing asset allocation.
AI allows for dynamic, adaptive systems that continuously refine themselves based on performance metrics.
8. Risk Management and Position Sizing
Even the best strategy fails without proper risk control. Advanced traders use sophisticated models to preserve capital.
Risk control techniques include:
Value at Risk (VaR): Estimates potential loss under normal conditions.
Kelly Criterion: Determines optimal bet size to maximize long-term growth.
Drawdown control: Limiting capital losses through daily, weekly, or cumulative limits.
Diversification and correlation analysis: Reducing systemic risk by balancing asset exposure.
Position sizing based on volatility, confidence level, and account equity ensures consistent performance and psychological stability.
9. Behavioral Finance and Trading Psychology
Human emotions — fear, greed, overconfidence, and loss aversion — are the greatest obstacles to advanced trading success.
Advanced traders master:
Cognitive discipline: Following systems regardless of emotional impulses.
Journaling: Tracking trades to analyze patterns and improve decision-making.
Mindfulness and focus: Maintaining calm under market pressure.
Probabilistic mindset: Accepting uncertainty as part of the process.
Professional performance depends not only on technical skill but also on emotional intelligence and mental resilience.
10. Global and Macro Trading Approaches
Global markets are interconnected — interest rates, currency movements, and geopolitical events all impact prices. Advanced traders use macro trading strategies to exploit these relationships.
Examples include:
Interest rate arbitrage: Trading based on central bank policy differentials.
Currency carry trade: Borrowing in low-interest currencies to invest in high-yield ones.
Commodities and inflation plays: Using gold or oil to hedge against inflationary trends.
Intermarket analysis: Studying how equities, bonds, and commodities influence each other.
A strong understanding of macroeconomics enhances timing, positioning, and portfolio management across global markets.
11. Portfolio Construction and Risk Parity
Advanced traders think beyond individual trades — they manage portfolios as integrated ecosystems.
Modern portfolio techniques include:
Risk parity models: Allocating capital based on volatility rather than nominal value.
Dynamic rebalancing: Adjusting exposure as market conditions evolve.
Correlation clustering: Ensuring diversification across uncorrelated assets.
Performance attribution: Measuring which strategies contribute most to returns.
This systematic approach maximizes risk-adjusted growth over the long term.
12. The Role of Technology and Infrastructure
Modern trading success depends on robust infrastructure.
Advanced tools include:
Low-latency servers for high-frequency execution.
API integrations for data feeds and brokerage automation.
Backtesting platforms such as QuantConnect or MetaTrader.
Data visualization tools like Tableau or Python dashboards.
Access to real-time data, high-quality execution, and cloud-based analytics transforms strategy into actionable performance.
13. Continuous Learning and Strategy Evolution
Markets evolve — and so must traders. The best professionals constantly refine their systems.
Steps to long-term mastery:
Research: Stay updated with financial innovation and emerging technologies.
Experimentation: Test new strategies under controlled environments.
Mentorship and community: Learn from experienced traders and data scientists.
Performance review: Regularly evaluate metrics and adapt.
Trading is a lifelong pursuit of improvement and adaptation.
Conclusion
Advanced trading is not about complexity for its own sake — it’s about building a structured, data-driven, risk-managed, and psychologically stable approach to the markets. The journey from intermediate to advanced trader involves mastering the synergy between technology, analysis, and human behavior.
By combining algorithmic precision, quantitative modeling, disciplined psychology, and continuous learning, traders can transform their craft into a professional, scalable, and sustainable enterprise.
In the modern financial landscape, knowledge truly is the most powerful form of capital — and advanced trading methods are the foundation upon which lasting success is built.