AI Trading Profits: Unlocking the Future of Smart Market Gains1. Understanding AI Trading
AI trading refers to the use of machine learning, natural language processing, and advanced algorithms to make trading decisions. Unlike traditional trading, which relies on human intuition, AI trading analyzes massive datasets in real-time, identifies patterns, and executes trades with precision. AI systems are capable of learning from historical data, adapting to changing market conditions, and continuously improving their performance.
Key components include:
Data acquisition: Collecting historical and real-time financial data.
Pattern recognition: Using machine learning to identify profitable trends.
Execution algorithms: Automatically placing trades based on AI predictions.
Risk management: Monitoring positions and adjusting strategies dynamically.
2. Sources of AI Trading Profits
AI trading profits come from multiple sources, often simultaneously:
a. Arbitrage Opportunities
AI can identify price discrepancies across markets faster than humans. For example, slight differences in currency pairs or stock prices between exchanges can be exploited within milliseconds, yielding small but highly consistent profits.
b. Predictive Market Analysis
AI models can forecast price movements using historical data, news sentiment, macroeconomic indicators, and social media trends. By predicting short-term or long-term trends, traders can enter and exit positions at optimal moments.
c. High-Frequency Trading (HFT)
AI enables high-frequency trading, executing thousands of trades per second. This leverages micro-movements in asset prices to generate cumulative profits over time.
d. Sentiment Analysis
Modern AI models analyze news articles, social media, and financial reports to gauge market sentiment. Positive or negative sentiment can trigger AI-based trading strategies that anticipate market reactions.
3. AI Trading Strategies That Drive Profits
AI trading profits are heavily influenced by the strategies employed:
Trend-Following Algorithms: AI detects upward or downward price trends and automatically adjusts positions.
Mean Reversion Models: Identifying when an asset is overbought or oversold and betting on a return to the mean.
Reinforcement Learning Systems: AI learns optimal trading actions through trial-and-error simulations.
Neural Network Predictive Models: Deep learning models analyze complex data patterns to predict future price movements.
Portfolio Optimization Algorithms: AI balances risk and return by continuously reallocating assets across diverse instruments.
4. Advantages of AI in Trading Profits
Speed and Accuracy: AI can analyze vast data in milliseconds, far faster than human traders.
Emotionless Trading: AI removes emotional biases that often lead to trading mistakes.
24/7 Market Monitoring: AI can operate continuously in global markets.
Adaptive Learning: Machine learning models improve over time, refining strategies.
Scalability: AI can simultaneously trade multiple markets and instruments.
5. Challenges and Risks in AI Trading
While AI offers significant profit potential, risks remain:
Data Quality Issues: Poor or biased data can lead to incorrect predictions.
Overfitting: AI models may perform well in simulations but fail in live markets.
Market Volatility: Sudden market shocks can overwhelm AI systems.
Regulatory Constraints: Certain jurisdictions impose rules on automated trading.
Ethical Concerns: AI-driven market manipulation risks exist if not properly monitored.
6. Case Studies of AI Trading Profits
Hedge Funds: Quantitative hedge funds like Renaissance Technologies and Two Sigma generate billions annually using AI-driven strategies.
Retail Traders: Platforms using AI-assisted trading tools allow retail traders to capture profitable signals.
Cryptocurrency Markets: AI is used extensively in crypto trading to exploit high volatility and sentiment-driven price swings.
7. Future Outlook of AI Trading Profits
The future of AI trading promises even greater profitability as technology advances:
Integration of Alternative Data: Satellite imagery, social trends, and IoT data will refine AI predictions.
AI-Driven Risk Management: Advanced AI models will optimize risk-adjusted returns.
Global Market Connectivity: AI will seamlessly trade across borders, currencies, and asset classes.
Hybrid Human-AI Models: Traders will increasingly use AI as an assistant, combining human intuition with machine precision.
Conclusion
AI trading profits represent a paradigm shift in financial markets. By leveraging speed, accuracy, predictive capabilities, and advanced strategies, AI transforms how profits are generated. However, success depends on high-quality data, robust algorithms, and continuous monitoring. For traders, institutions, and investors, AI is no longer optional—it is the key to achieving consistent, scalable, and intelligent market gains.
Trade ideas
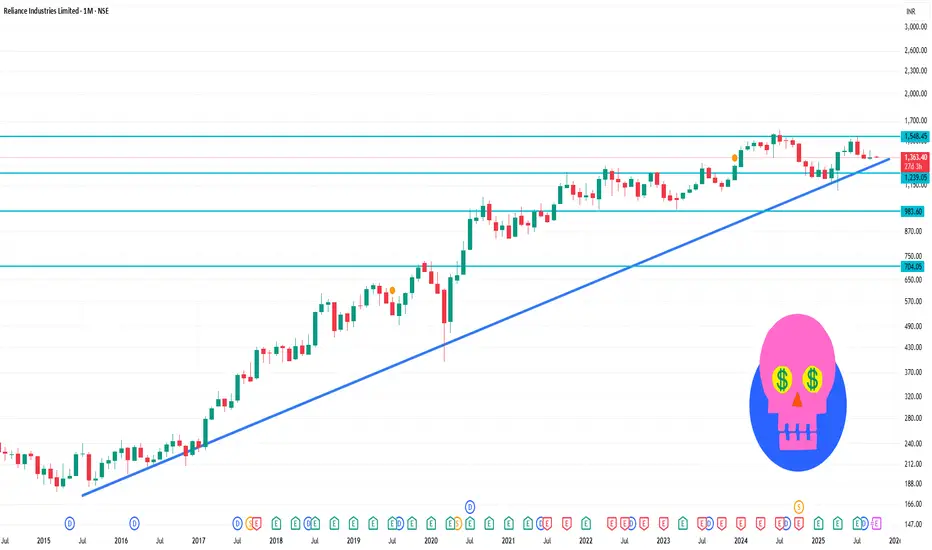
RELIANCE 1 Month Time Frame 📊 Monthly Pivot Levels (Standard)
Pivot Point: ₹1,375.53
Support Levels:
S1: ₹1,329.07
S2: ₹1,294.13
S3: ₹1,247.67
Resistance Levels:
R1: ₹1,410.47
R2: ₹1,456.93
R3: ₹1,491.87
These levels are derived from standard pivot point calculations, which are commonly used to identify potential support and resistance zones.
🔄 Technical Indicators Overview
Relative Strength Index (RSI): Approximately 41.5, indicating a neutral to slightly bearish condition.
Moving Averages: The stock is trading below its 50-day and 200-day moving averages, suggesting a bearish trend.
MACD: Currently negative, reinforcing the bearish momentum.
Option Chain Terms – Comprehensive Explanation1. Strike Price
The strike price (also called exercise price) is the fixed price at which the buyer of an option can buy (call option) or sell (put option) the underlying asset upon expiry.
For call options, it is the price at which the underlying asset can be purchased.
For put options, it is the price at which the underlying can be sold.
Example:
If a stock trades at ₹5,000 and the call option has a strike price of ₹5,100:
Buying the call allows you to buy the stock at ₹5,100, regardless of the market price.
Buying the put allows you to sell the stock at ₹5,100, even if the market falls to ₹4,800.
Strike prices are usually set at regular intervals, known as strike intervals, e.g., ₹50, ₹100, ₹500 depending on the underlying asset.
2. Expiry Date
The expiry date is the date on which the option contract ceases to exist. Options in India typically expire on the last Thursday of the contract month.
European-style options can only be exercised on the expiry date.
American-style options can be exercised any time before or on the expiry date.
Expiry influences option premiums:
Longer expiries usually have higher premiums due to increased time value.
Short-dated options experience faster time decay (theta).
3. Option Type (Call / Put)
Options are classified into Call Options and Put Options:
Call Option: Right to buy the underlying at the strike price. Traders buy calls when expecting price increase.
Put Option: Right to sell the underlying at the strike price. Traders buy puts when expecting price decline.
The option chain displays both call and put options for each strike price side by side for easy comparison.
4. Premium / Last Traded Price (LTP)
The premium is the price paid by the buyer to purchase the option. On an option chain, this is displayed as the Last Traded Price (LTP).
Premium consists of Intrinsic Value (IV) and Time Value (TV):
Intrinsic Value: The difference between current underlying price and strike price (only if in-the-money).
Call Option: Current Price - Strike Price (if positive)
Put Option: Strike Price - Current Price (if positive)
Time Value: Extra value due to remaining time till expiry and volatility.
Options closer to expiry have lower time value.
Premium is highly influenced by volatility, time decay, and demand-supply.
5. Open Interest (OI)
Open Interest is the total number of outstanding contracts that have not been squared off (closed) or exercised.
High OI indicates liquidity and potential support/resistance levels at that strike.
Increasing OI along with rising prices may indicate bullish sentiment; decreasing OI may indicate weak trend.
Example:
If 5,000 call option contracts at strike ₹5,000 are outstanding, it means traders have taken positions worth 5,000 contracts, reflecting market interest in that price point.
6. Volume
Volume indicates the number of contracts traded during a particular session.
High volume reflects active trading and market participation.
Comparing volume with open interest helps gauge whether new positions are being initiated or closed.
Interpretation:
Rising price + rising volume = Strong bullish trend
Falling price + rising volume = Strong bearish trend
7. Implied Volatility (IV)
Implied Volatility (IV) is the market’s expectation of future volatility of the underlying asset.
Higher IV leads to higher premiums.
Lower IV means cheaper options, reflecting market stability.
IV is crucial for traders using strategies like straddles, strangles, and spreads because these depend on expected volatility movements.
Example:
If stock X has IV of 25%, traders expect the stock price to move significantly; if IV is 10%, minimal movement is anticipated.
8. Greeks (Delta, Gamma, Theta, Vega, Rho)
Greeks quantify risk and sensitivity of option prices to various factors:
Delta (Δ) – Measures change in option price per ₹1 change in underlying.
Call Delta ranges 0–1; Put Delta ranges 0 to -1.
Gamma (Γ) – Measures rate of change of delta.
Higher gamma = option more sensitive to price changes.
Theta (Θ) – Measures time decay; negative for long options.
Vega (V) – Measures sensitivity to implied volatility.
Rho (ρ) – Measures sensitivity to interest rates.
Greeks allow traders to hedge risks and plan multi-leg strategies effectively.
9. Bid and Ask
Bid Price: Price buyers are willing to pay for an option.
Ask Price (Offer Price): Price sellers are asking.
Bid-Ask Spread: Difference between bid and ask, reflecting liquidity.
A tight spread indicates active trading, while a wide spread indicates illiquid options.
10. In-The-Money (ITM), At-The-Money (ATM), Out-Of-The-Money (OTM)
ITM: Option has intrinsic value.
Call: Strike < Underlying Price
Put: Strike > Underlying Price
ATM: Strike price ≈ Underlying Price
OTM: Option has no intrinsic value.
Call: Strike > Underlying Price
Put: Strike < Underlying Price
These classifications help traders choose options based on risk appetite and strategy (speculation vs hedging).
Conclusion
An option chain is more than just numbers; it is a market sentiment map showing where traders are positioning themselves, potential support/resistance zones, and volatility expectations. Understanding terms like strike price, premium, open interest, volume, IV, Greeks, bid/ask, and moneyness enables traders to make informed decisions, structure strategies, and manage risk effectively.
By combining quantitative data (LTP, OI, volume) with qualitative interpretation (IV, Greeks), an option chain becomes an indispensable tool for both speculative and hedging strategies in the financial markets.
BUY RELIANCEONLY FOR EDUCATIONAL PURPOSE. Only For SWING. This post is meant for learning purposes only. Invest your capital at your own risk.

Regulatory & Policy Developments1. Introduction to Regulatory and Policy Developments
At the core, regulation refers to rules and directives issued by governing bodies to control, manage, or guide the conduct of businesses, markets, and economic participants. Policy, on the other hand, represents a broader framework of principles, strategies, and guidelines that guide decision-making in government, financial institutions, and corporations.
Key Objectives of Regulations and Policies
Market Stability: Regulations prevent market volatility and systemic risk, ensuring investor confidence.
Consumer Protection: Policies safeguard consumers from fraudulent practices, misleading information, and financial exploitation.
Transparency and Accountability: Regulatory frameworks require disclosure of financial information, promoting trust in institutions.
Economic Growth and Innovation: Policies can stimulate sectors, attract investments, and encourage innovation through incentives or guidelines.
Risk Management: Regulations manage risks in banking, finance, and corporate sectors, reducing chances of crises.
Regulations and policies are intertwined, often evolving with changing economic environments, technological advancements, and societal needs. Their impact is felt across every segment of the economy, from financial markets and corporate governance to labor markets and international trade.
2. Historical Evolution of Regulatory and Policy Frameworks
Global Perspective
The evolution of regulations globally has been shaped by crises, technological advancements, and policy reforms. Key milestones include:
Early 20th Century: Following financial panics like the 1907 crisis in the U.S., regulatory mechanisms emerged to stabilize markets.
The Great Depression (1929): The collapse of stock markets led to the Securities Act of 1933 and Securities Exchange Act of 1934 in the United States, establishing the SEC (Securities and Exchange Commission).
Post-War Era: Economic rebuilding prompted regulatory frameworks focusing on industrial development, labor rights, and social welfare.
Late 20th Century: Globalization and technological progress led to reforms in trade, banking, and securities markets.
Post-2008 Financial Crisis: The crisis highlighted risks in financial derivatives, complex banking products, and inadequate oversight, resulting in stringent reforms like Dodd-Frank Act (USA) and Basel III (Global Banking Standards).
Indian Regulatory History
India’s regulatory and policy framework has evolved gradually to balance growth and stability:
Pre-Independence: Limited formal regulations; trade largely unregulated with colonial economic policies.
Post-Independence Era (1947-1990): Emphasis on industrial licensing, import substitution, and financial control through entities like RBI, SEBI, and IRDAI.
Economic Liberalization (1991 Onwards): Liberalization, privatization, and globalization (LPG reforms) spurred regulatory modernization.
Recent Decades: Introduction of Goods and Services Tax (GST), Insolvency and Bankruptcy Code (IBC, 2016), and fintech regulations reflects India’s adaptation to global standards.
3. Types of Regulatory and Policy Developments
Regulations and policies vary across sectors, targeting specific objectives. Broadly, they can be classified into the following categories:
a. Financial Market Regulations
Securities Regulations: Governing stock exchanges, mutual funds, IPOs, and listed companies.
Example: SEBI regulations for market intermediaries and investor protection.
Banking and Finance Regulations: Ensuring capital adequacy, liquidity, and prudent lending.
Example: RBI’s Basel III implementation for Indian banks.
Insurance and Pension Policies: Protecting policyholders and promoting long-term savings.
Example: IRDAI regulations for insurance products.
b. Corporate Governance Policies
Disclosure Requirements: Mandating periodic reporting of financial statements.
Board Composition and Ethical Standards: Ensuring accountability in corporate management.
Fraud Prevention Measures: Detecting and preventing insider trading and market manipulation.
c. Trade and Economic Policies
Industrial Policies: Encouraging investment and promoting priority sectors.
Foreign Direct Investment (FDI) Regulations: Defining limits and approvals for international investments.
Export-Import Policies: Facilitating global trade and ensuring balance-of-payments stability.
d. Technological and Digital Regulations
Data Protection Policies: Protecting consumer privacy and personal information.
Example: Personal Data Protection Bill (India)
Fintech Regulations: Governing digital payments, cryptocurrencies, and blockchain adoption.
Cybersecurity Policies: Ensuring safe digital infrastructure in banking and corporate sectors.
e. Environmental and Sustainability Policies
Environmental Regulations: Reducing carbon emissions, pollution, and promoting clean technologies.
Sustainability Reporting: Mandating ESG (Environmental, Social, Governance) disclosures by corporates.
Renewable Energy Incentives: Policies promoting green energy and sustainable investments.
4. Key Regulatory Developments Globally
a. United States
Dodd-Frank Wall Street Reform (2010): Post-2008 financial crisis reform aimed at reducing systemic risk.
Sarbanes-Oxley Act (2002): Strengthened corporate governance and transparency after corporate scandals (Enron, WorldCom).
Federal Reserve Policies: Monetary regulations influencing liquidity, interest rates, and bank supervision.
b. European Union
MiFID II (2018): Financial market transparency, investor protection, and trading standards.
GDPR (2018): Comprehensive data protection and privacy regulations.
EU Sustainable Finance Regulations: ESG disclosures, green finance taxonomy, and risk assessments.
c. Asia-Pacific
China’s Financial Market Reforms: Liberalization of stock exchanges, fintech regulations, and digital currency issuance.
Japan’s Corporate Governance Code (2015): Focused on board independence, shareholder rights, and sustainable growth.
5. Key Regulatory Developments in India
a. Financial Market Reforms
SEBI (Securities and Exchange Board of India) Regulations
IPO norms, insider trading prevention, mutual fund oversight.
Emphasis on investor protection and market integrity.
RBI Banking Reforms
Basel III norms, asset quality review, and digital banking initiatives.
Insurance Sector
IRDAI’s solvency regulations and customer grievance redressal frameworks.
b. Corporate Governance and Compliance
Companies Act 2013
Mandates board independence, audit committees, CSR activities, and disclosure norms.
Insider Trading Regulations
Strengthened to deter market manipulation and unethical practices.
c. Trade and Economic Policies
FDI Policy Reforms
Liberalized norms across sectors, including defense, telecom, and retail.
GST Implementation (2017)
Unified indirect tax system improving ease of doing business.
Make in India Initiative
Policy to boost domestic manufacturing and attract global investors.
d. Technology and Digital Regulations
Fintech and Digital Payments
NPCI (National Payments Corporation of India) overseeing UPI, digital wallets, and payments security.
Cryptocurrency Policy
RBI and government regulations balancing innovation with risk containment.
Data Privacy and Protection
Draft bills addressing consumer data security and corporate responsibilities.
e. Environmental and ESG Policies
Mandatory CSR Reporting
Companies above a threshold must allocate profits for social development.
Green Finance Policies
Encouraging investment in renewable energy, clean technology, and sustainable infrastructure.
Carbon Emission Norms
Industries must comply with emission limits, promoting low-carbon technologies.
6. Impact of Regulatory and Policy Developments
a. Positive Impacts
Market Confidence and Stability
Strong regulations reduce uncertainty, attracting both domestic and foreign investments.
Consumer Protection
Policies prevent exploitation, fraud, and unfair practices.
Promoting Innovation
Incentives and supportive policies encourage startups, fintech, and green technology.
Global Integration
Alignment with global standards boosts international trade and capital inflows.
b. Challenges and Limitations
Regulatory Overreach
Excessive compliance costs can stifle small businesses.
Lag Between Policy and Implementation
Enforcement gaps often reduce effectiveness.
Technological Disruption
Rapid fintech, AI, and blockchain developments require constant regulatory adaptation.
Global Uncertainties
Trade wars, geopolitical tensions, and international regulatory divergence can impact domestic policies.
Conclusion
Regulatory and policy developments are essential pillars of modern economies. They ensure market stability, protect consumers, foster innovation, and integrate domestic economies with the global framework. The landscape of regulations is continuously evolving, influenced by crises, technological advancements, and societal needs. Countries like India are modernizing their regulatory architecture to promote transparency, efficiency, and sustainability while balancing growth and innovation.
Looking forward, the key to effective regulation lies in adaptability, technology integration, and a balance between control and freedom. Policymakers, regulators, businesses, and investors must collaborate to ensure a robust framework that fosters economic growth, protects stakeholders, and prepares the economy for future challenges. Regulatory and policy development is not just a compliance exercise—it is a strategic enabler for sustainable and inclusive economic progress.
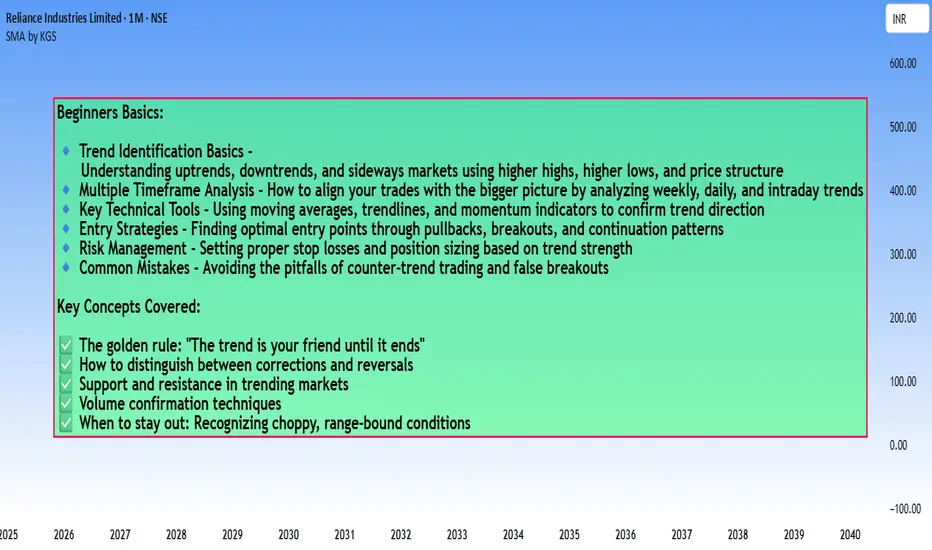
How to trade in the Right Trend - Beginners guide
How to Identify a Trend in a Chart?
Here's a practical breakdown of trend identification methods:
1. Price Structure Method (Most Fundamental)
Uptrend:
- Series of Higher Highs (HH) and Higher Lows (HL)
- Each peak is higher than the previous peak
- Each trough is higher than the previous trough
Downtrend:
- Series of Lower Highs (LH) and Lower Lows (LL)
- Each peak is lower than the previous peak
- Each trough is lower than the previous trough
Sideways/Range:
- Price oscillates between horizontal support and resistance
- No clear higher highs/lows or lower highs/lows
2. Moving Averages
Simple Rules:
- Price consistently above MA = Uptrend
- Price consistently below MA = Downtrend
- Price crossing back and forth = No clear trend
Popular MAs:
- 20 EMA (short-term)
- 50 SMA (medium-term)
- 200 SMA (long-term)
Golden Cross/Death Cross:
- 50 MA crosses above 200 MA = Bullish trend signal
- 50 MA crosses below 200 MA = Bearish trend signal
3. Trendline Method
Drawing Trendlines:
- Uptrend: Connect at least 2 higher lows with a straight line
- Downtrend: Connect at least 2 lower highs with a straight line
- The more touches, the stronger the trendline
- Price respecting the trendline confirms trend strength
4. Multi-Timeframe Analysis
The Complete Picture:
- Weekly chart: Overall market direction
- Daily chart: Intermediate trend
- 4H/1H chart: Entry timing
Rule: Always trade in the direction of the higher timeframe trend
#5. Indicators for Confirmation
ADX (Average Directional Index):
- Above 25 = Strong trend
- Below 20 = Weak/no trend
- Doesn't show direction, only strength
MACD:
- Histogram above zero = Uptrend
- Histogram below zero = Downtrend
- Crossovers signal potential trend changes
RSI:
- Consistently above 50 = Uptrend
- Consistently below 50 = Downtrend
6. Volume Confirmation
Healthy Trends Show:
- Rising volume on moves in trend direction
- Declining volume on corrections/pullbacks
- Volume spikes at breakout points
Quick Checklist for Trend Identification:
✅ Strong Uptrend:
- Higher highs and higher lows
- Price above rising moving averages
- Valid upward trendline intact
- ADX above 25
- Increasing volume on rallies
✅ Strong Downtrend:
- Lower highs and lower lows
- Price below falling moving averages
- Valid downward trendline intact
- ADX above 25
- Increasing volume on declines
⚠️ No Clear Trend (Stay Out):
- Choppy price action
- MAs flat or intertwined
- ADX below 20
- Price between support/resistance
Common Beginner Mistakes:
❌ Looking at only one timeframe
❌ Ignoring the bigger picture
❌ Trading every small wiggle as a "trend"
❌ Not waiting for confirmation
❌ Confusing corrections with reversals
Pro Tips:
💡 **The 3-Touch Rule:** A trend becomes more reliable after price respects a trendline at least 3 times
💡 **Trend is Your Timeframe:** What's an uptrend on daily might be a pullback on weekly
💡 **When in Doubt, Zoom Out:** Higher timeframes show the true direction
💡 **Trade WITH the trend, not against it:** Counter-trend trades have lower probability
**Remember:** Trend identification isn't about being perfect - it's about being on the right side of the market more often than not. Start with the basics (higher highs/lows), then add confirmation tools as you gain experience.
More updates with examples and Explanation on individual topics in a easy way to understand.
Part 12 Trading Master Class With ExpertsI. Introduction to Options
What is an Option?
An option is a financial derivative contract that gives the buyer the right, but not the obligation, to buy or sell an underlying asset at a predetermined price (strike price) within a specified time period. Options derive their value from the underlying asset, which can be stocks, indices, commodities, currencies, or ETFs.
Types of Options
There are two primary types:
Call Option: Gives the holder the right to buy the underlying asset at a strike price before expiration.
Put Option: Gives the holder the right to sell the underlying asset at a strike price before expiration.
Buyers vs. Sellers
Option Buyer (Holder): Pays a premium for the right to exercise the option. Limited risk (premium paid), unlimited or capped potential reward depending on call or put.
Option Seller (Writer): Receives the premium. Obligated to fulfill the contract if exercised. Higher risk, especially in uncovered options.
Option Premium Explained
The premium is the price paid for the option. It comprises two components:
Intrinsic Value: The real, immediate profit if exercised now (for in-the-money options).
Time Value: Additional value based on time left until expiration and market volatility.
Option Expiration and Exercise
Options have a fixed expiration date. Exercise can happen in two ways:
American Style: Can be exercised any time before expiration.
European Style: Can only be exercised at expiration.
II. Understanding Option Pricing
Factors Affecting Option Pricing
The price of an option (premium) is influenced by:
Underlying asset price
Strike price
Time to expiration
Volatility
Interest rates
Dividends
Intrinsic vs. Extrinsic Value
Intrinsic Value: Difference between underlying asset price and strike price (only if in-the-money).
Extrinsic Value: Time value and volatility premium. Represents potential for future gains.
Moneyness of Options
Options are classified based on their intrinsic value:
In-the-Money (ITM): Profitable if exercised now.
At-the-Money (ATM): Strike price equals the underlying asset price.
Out-of-the-Money (OTM): Not profitable if exercised now.
The Greeks – Risk and Sensitivity Measures
Options are influenced by “Greeks” which measure sensitivity to different factors:
Delta: Sensitivity of option price to underlying asset price change.
Gamma: Rate of change of delta.
Theta: Time decay of option value.
Vega: Sensitivity to volatility.
Rho: Sensitivity to interest rates.
Black-Scholes & Binomial Models
Option pricing models estimate theoretical values:
Black-Scholes Model: For European options; factors in price, strike, volatility, time, and risk-free rate.
Binomial Model: Uses a stepwise approach; suitable for American options.

PCR Trading StrategiesPart 1: Introduction to Options
Options are a type of derivative instrument that derive their value from an underlying asset like stocks, indices, commodities, or currencies. Unlike buying the asset itself, options give you the right—but not the obligation—to buy or sell the asset at a predetermined price (strike price) before or on a specific date (expiration).
Key Points:
Options are contracts between two parties: the buyer (who has the right) and the seller/writer (who has the obligation).
They are flexible instruments used for hedging, speculation, and income generation.
Options can be American style (exercisable any time before expiry) or European style (exercisable only at expiry).
Why options are popular:
Leverage: Small investment can control large positions.
Risk Management: Can hedge existing positions.
Versatility: Can profit in bullish, bearish, or sideways markets.
Part 2: Types of Options
There are two primary types of options:
1. Call Option
Gives the buyer the right to buy an underlying asset at the strike price.
Buyers of calls profit when the asset price rises above the strike price plus premium paid.
Example: If a stock is at ₹100, and you buy a call with strike ₹105 for a premium of ₹5, you make money if stock > ₹110 (105 + 5) at expiry.
2. Put Option
Gives the buyer the right to sell an underlying asset at the strike price.
Buyers of puts profit when the asset price falls below the strike price minus premium paid.
Example: If a stock is at ₹100, and you buy a put with strike ₹95 for a premium of ₹3, you profit if stock < ₹92 (95 – 3) at expiry.
Part 3: Option Terminology
Understanding the language of options is crucial:
Strike Price (Exercise Price): Price at which the option can be exercised.
Premium: Price paid to buy the option.
Expiration Date: Date on which the option expires.
In-the-Money (ITM): Call: Stock > Strike, Put: Stock < Strike.
Out-of-the-Money (OTM): Call: Stock < Strike, Put: Stock > Strike.
At-the-Money (ATM): Stock ≈ Strike Price.
Intrinsic Value: Difference between current stock price and strike price (if profitable).
Time Value: Extra value reflecting remaining time until expiry.
Note: Premium = Intrinsic Value + Time Value
Part 4: How Options Work
Option trading revolves around buying and selling contracts. Let’s break down the process:
Buying a Call:
Expectation: Stock price will rise.
Profit: Stock price > Strike + Premium.
Loss: Limited to premium paid.
Buying a Put:
Expectation: Stock price will fall.
Profit: Stock price < Strike – Premium.
Loss: Limited to premium paid.
Writing (Selling) Options:
Involves taking obligation to buy/sell if the buyer exercises.
Generates premium income but comes with unlimited risk (especially for uncovered calls).
Exercise and Assignment:
Exercising: Buyer uses the right to buy/sell.
Assignment: Seller is notified they must fulfill the contract.

Energy Trading and Geopolitics1. The Fundamentals of Energy Trading
Energy trading involves buying and selling energy commodities such as oil, natural gas, coal, electricity, and increasingly renewable energy credits. Markets for these commodities can be physical (spot markets) or financial (futures, options, and derivatives).
1.1 Types of Energy Commodities
Crude Oil: The most traded energy commodity globally, with benchmarks such as Brent, WTI, and Dubai Crude.
Natural Gas: Traded regionally via pipelines and internationally through liquefied natural gas (LNG) shipments.
Coal: Primarily used in power generation; its trade is often influenced by regional supply and environmental regulations.
Electricity: Traded in regional power exchanges; price is highly volatile due to demand-supply fluctuations.
Renewables: Solar, wind, and carbon credits are increasingly becoming tradable commodities as countries move towards decarbonization.
1.2 Key Market Mechanisms
Spot Market: Immediate delivery of energy commodities.
Futures and Options: Financial instruments to hedge risk and speculate on price movements.
OTC (Over-the-Counter) Markets: Customized bilateral contracts, often used by large energy firms.
Indices and ETFs: Track energy prices for investors and institutions, providing indirect exposure.
1.3 Drivers of Energy Prices
Supply-Demand Dynamics: Changes in production, consumption, and storage levels directly affect prices.
Geopolitical Events: Wars, sanctions, and political instability can disrupt supply chains.
Technological Advancements: Shale oil, deep-sea drilling, and renewable energy technologies alter cost structures.
Environmental Policies: Carbon pricing, emissions regulations, and renewable incentives influence market behavior.
2. Historical Perspective on Energy and Geopolitics
Energy has always been a geopolitical instrument. History shows that control over energy resources often dictates power structures globally.
2.1 The Oil Shocks of the 1970s
The 1973 and 1979 oil crises highlighted the strategic leverage of oil-producing nations. The Organization of the Petroleum Exporting Countries (OPEC) embargo caused global oil prices to quadruple, triggering economic recessions worldwide.
2.2 The Cold War Era
Energy resources were a critical factor in the US-Soviet rivalry. The Soviet Union used natural gas and oil supplies to influence Eastern European countries, while the US leveraged its alliances and technology to maintain access to global energy markets.
2.3 Post-Cold War Globalization
After the Cold War, global energy markets became more interconnected. Multinational energy corporations expanded their operations, creating transnational supply chains. This globalization increased interdependence but also exposed markets to geopolitical risks like regional conflicts and sanctions.
3. Geopolitical Determinants of Energy Trading
Energy markets are uniquely sensitive to geopolitical developments. Nations often use energy as a tool for diplomacy, coercion, or economic strategy.
3.1 Energy Resource Distribution
Middle East: Home to nearly half of the world’s proven oil reserves, countries like Saudi Arabia, Iraq, and Iran wield significant influence.
Russia: A dominant natural gas exporter to Europe, using pipelines to assert strategic leverage.
United States: A growing energy exporter due to shale revolution, impacting global energy geopolitics.
Africa and Latin America: Emerging as critical energy suppliers, but political instability often affects trade flows.
3.2 Energy and International Alliances
Countries with energy abundance often form alliances or blocs to protect market stability and influence prices. OPEC is the most prominent example, coordinating oil production to influence global prices. Russia’s partnerships with countries like China illustrate the strategic use of gas supplies.
3.3 Energy Sanctions as a Geopolitical Tool
Sanctions can restrict access to energy markets or technology, directly impacting global trade. For instance:
Iran: US sanctions have curtailed oil exports and limited investment in energy infrastructure.
Russia: Sanctions over Ukraine affected energy exports to Europe, leading to price volatility and a reorientation of trade flows.
4. Key Energy Trade Routes and Geopolitical Hotspots
The geography of energy trade is crucial for global geopolitics. Control over supply routes often translates into strategic power.
4.1 Maritime Routes
Strait of Hormuz: Approximately 20% of global oil passes through this narrow chokepoint in the Persian Gulf. Any disruption can cause global price spikes.
Suez Canal: Vital for oil and LNG shipments from the Middle East to Europe.
Malacca Strait: Key for Asian energy imports, particularly for China and Japan.
4.2 Pipelines and Land Routes
Nord Stream & TurkStream: Russian pipelines supplying Europe; politically sensitive due to European dependence on Russian gas.
Trans-Saharan & Central Asian Pipelines: Provide oil and gas to Europe and Asia, bypassing traditional chokepoints.
4.3 Geopolitical Flashpoints
Middle East conflicts, particularly in Iraq, Syria, and Yemen, impact supply security.
Russia-Ukraine tensions affect European energy security.
South China Sea disputes threaten shipping lanes critical for Asian energy trade.
5. Energy Security and Strategic Reserves
Energy security is central to national policy, influencing both foreign policy and domestic preparedness.
5.1 Strategic Petroleum Reserves (SPR)
Countries maintain SPRs to buffer against supply disruptions. The US, China, and India have sizable reserves that allow temporary independence from volatile markets.
5.2 Diversification of Supply
Reducing dependence on a single supplier mitigates geopolitical risk. For instance, Europe seeks LNG from multiple sources to reduce reliance on Russian gas.
5.3 Renewable Energy and Energy Independence
Investments in solar, wind, and nuclear reduce exposure to fossil fuel geopolitics. Countries aiming for net-zero emissions also view energy transition as a path to strategic autonomy.
6. Energy Trading Mechanisms in Geopolitical Context
Geopolitical developments influence energy trading strategies, from hedging to speculative investments.
6.1 Hedging Strategies
Companies and nations use futures, options, and swaps to hedge against price volatility due to geopolitical events.
6.2 Spot vs Long-Term Contracts
Spot contracts: Allow immediate purchase but are highly sensitive to crises.
Long-term contracts: Provide price stability, often including geopolitical risk clauses.
6.3 Sovereign Wealth Funds (SWFs)
Energy-exporting countries often use SWFs to invest in global energy assets, securing both economic returns and geopolitical leverage.
7. Case Studies: Geopolitics Shaping Energy Markets
7.1 Russia-Ukraine Conflict (2022-Present)
Gas supply disruptions to Europe caused energy price spikes.
EU accelerated LNG imports from the US and Qatar.
Shifted long-term energy partnerships and investments in renewables.
7.2 US-Iran Tensions
US sanctions limited Iranian oil exports, causing global supply concerns.
Middle East alliances shifted as countries sought alternative markets and energy security assurances.
7.3 OPEC+ Production Cuts
Coordinated production adjustments influence global oil prices.
Demonstrates energy as a tool for economic and political leverage.
8. Energy Transition and Geopolitics
The global shift to renewables introduces new geopolitical dimensions.
8.1 Renewable Resource Geography
Solar and wind resources are unevenly distributed. Countries with abundant sun or wind may become energy exporters of the future.
8.2 Critical Minerals and Technology
Rare earths, lithium, and cobalt are essential for batteries and renewables.
Geopolitical competition for these resources is rising, similar to historical fossil fuel geopolitics.
8.3 Decentralization of Energy Trade
Distributed renewable energy reduces dependency on centralized energy suppliers.
Could weaken traditional energy-based geopolitical power structures.
9. Emerging Trends in Energy Geopolitics
Energy Diplomacy: Countries use energy agreements to strengthen alliances (e.g., China’s Belt and Road Initiative investments in energy infrastructure).
Digitalization of Energy Markets: Smart grids, blockchain-based energy trading, and AI forecasting improve market efficiency and transparency.
Climate Policies: Carbon pricing and emissions targets increasingly shape energy trading and global alliances.
Hybrid Energy Conflicts: Cyberattacks targeting energy infrastructure have emerged as a tool in geopolitical conflicts.
10. Conclusion
Energy trading and geopolitics are inseparable. While markets are driven by economic fundamentals, political events, strategic alliances, and conflicts significantly shape energy flows and prices. As the world moves toward renewable energy and decarbonization, geopolitical competition will shift from oil and gas dominance to control over critical technologies and minerals. Understanding the interplay of energy markets and geopolitics is crucial for policymakers, investors, and businesses navigating a volatile and interconnected global landscape.
In essence, energy is not just power—it is power itself. Nations and corporations that understand and strategically maneuver through energy geopolitics are better positioned to secure economic growth, energy security, and geopolitical influence.
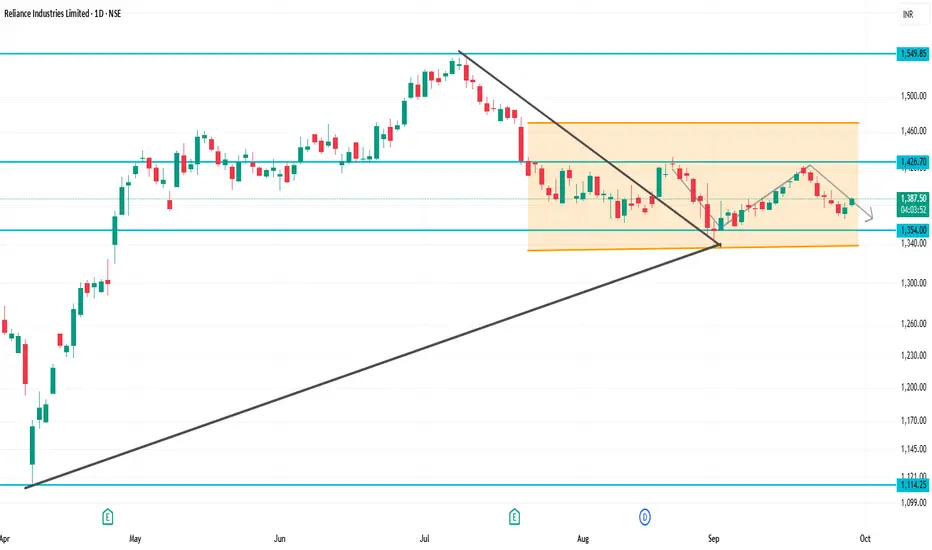
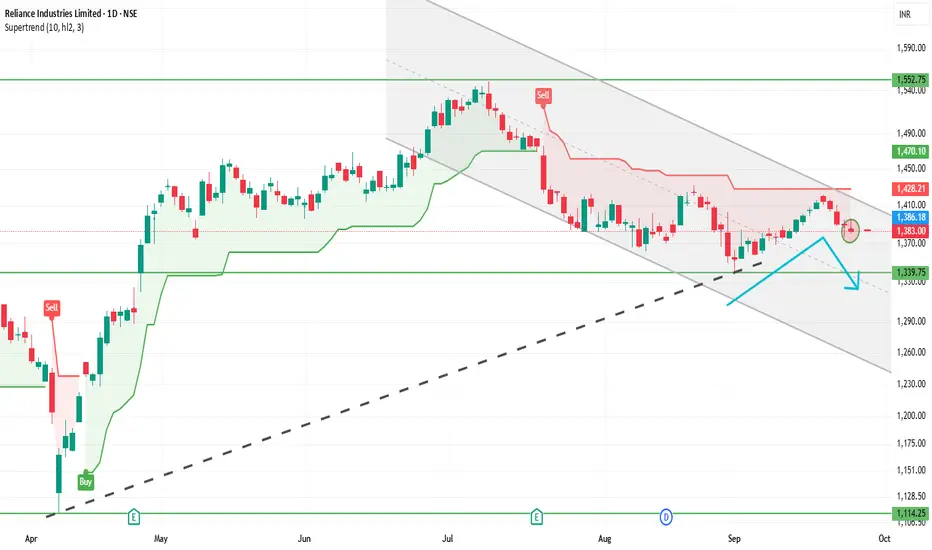
RELIANCE 1D Time frameCurrent Market Snapshot
Current Price: ₹1,383.30
Opening Price: ₹1,381.60
Day’s Range: ₹1,379.00 – ₹1,386.90
Previous Close: ₹1,377.60
🔑 Technical Indicators
Relative Strength Index (RSI): 49.76 – indicating a neutral condition.
Moving Average Convergence Divergence (MACD): -3.20 – suggesting bearish momentum.
Moving Averages: Mixed signals; trading slightly below the 50-day and 200-day moving averages, indicating a neutral to bearish trend.
📈 Key Support & Resistance Levels
Immediate Support: ₹1,379
Immediate Resistance: ₹1,387
Pivot Point: ₹1,383
📉 Market Sentiment
Recent Performance: Reliance Industries experienced a decline of 0.82% on September 25, 2025, underperforming the broader market.
Volume: Trading volume is higher than average, suggesting increased investor activity.
📈 Strategy (1D Timeframe)
1. Bullish Scenario
Entry: Above ₹1,387
Stop-Loss: ₹1,379
Target: ₹1,395 → ₹1,400
2. Bearish Scenario
Entry: Below ₹1,379
Stop-Loss: ₹1,387
Target: ₹1,370 → ₹1,365
⚠️ Risk Management
Limit risk to 1% of capital per trade.
Always use stop-loss to protect against unexpected market movements.
Monitor broader market trends and sector-specific news that may impact stock performance.
Part 2 Ride The Big MovesPart 1: Strategies in Option Trading
Option trading offers a vast array of strategies catering to different risk profiles, market outlooks, and investment objectives. They can be broadly categorized into basic strategies and advanced strategies:
Basic Strategies:
Long Call: Buying a call option to profit from upward price movement.
Long Put: Buying a put option to profit from downward price movement.
Covered Call: Holding the underlying asset while selling a call option to generate income.
Protective Put: Buying a put option to hedge against potential losses in a long stock position.
Advanced Strategies:
Spreads: Involve buying and selling options of the same type (call or put) with different strike prices or expiration dates.
Bull Call Spread: Buy a lower strike call and sell a higher strike call to limit risk and reward.
Bear Put Spread: Buy a higher strike put and sell a lower strike put.
Straddles and Strangles: Suitable for expecting high volatility.
Straddle: Buy call and put at the same strike price, profits from large price swings in either direction.
Strangle: Buy call and put with different strike prices, slightly cheaper than straddle.
Butterflies and Condors: Multi-leg strategies to profit from limited price movement within a range.
Option strategies can be tailored to bullish, bearish, or neutral market views, with different risk/reward profiles. This flexibility is what attracts professional traders and sophisticated investors, but it also demands a deep understanding of market behavior, timing, and execution.
Part 2: Risks, Rewards, and Best Practices
Option trading provides opportunities but comes with inherent risks. Key risks include:
Time Decay (Theta Risk): Options lose value as expiration approaches. Holding options too long without movement can erode capital.
Volatility Risk: Unexpected market stability or turbulence can significantly impact options.
Liquidity Risk: Some options, especially in smaller markets, have wide bid-ask spreads, increasing trading costs.
Complexity Risk: Multi-leg strategies require precise execution and understanding.
Rewards in option trading can be substantial:
Leverage allows traders to control large positions with minimal capital.
Hedging options can protect portfolios against significant losses.
Writing options can generate consistent income streams.
Best Practices for Option Traders:
Education: Master the fundamentals of options, pricing models, and strategies.
Risk Management: Limit exposure per trade and diversify strategies.
Technical and Fundamental Analysis: Use charts, patterns, and economic data to inform trades.
Paper Trading: Practice strategies in simulated environments before real capital allocation.
Monitoring Greeks: Adjust positions based on delta, theta, and vega to manage risk dynamically.
Option trading, when approached with discipline and strategy, offers a powerful toolkit for both hedging and speculative purposes. Success relies on knowledge, patience, and continuous learning, as the dynamic nature of markets constantly reshapes risk and opportunity.
Conclusion:
Option trading is a multifaceted arena combining mathematics, psychology, and market insight. From basic calls and puts to complex spreads and hedging strategies, options empower traders to manage risk, enhance returns, and capitalize on market movements. While lucrative, it demands discipline, careful planning, and a solid grasp of the underlying principles, making education and practice indispensable for any trader aspiring to master the options market.

Part 7 Trading Master Class1. Risk Management in Options Trading
Risk is both the biggest appeal and the biggest danger in options trading. Without proper risk management, traders can face massive losses.
Key practices include:
Position Sizing: Never risking more than a small percentage of capital on a single trade.
Stop-Loss Orders: Exiting positions when losses exceed tolerance levels.
Diversification: Spreading trades across different sectors or instruments.
Hedging: Using options not for speculation but for protection of a stock portfolio.
Awareness of Leverage: Remembering that leverage can magnify both gains and losses.
Professional traders always prioritize risk management over profit chasing.
2. Role of Options in Hedging and Speculation
Options serve dual purposes:
Hedging
Companies hedge currency risks using currency options.
Investors hedge stock portfolios by buying index puts.
Commodity traders hedge raw material costs with commodity options.
Speculation
Traders can take leveraged bets on short-term price movements.
Bullish traders buy calls; bearish traders buy puts.
Volatility traders deploy straddles/strangles to benefit from sharp moves.
This dual nature — protection and profit — makes options invaluable across markets.
3. Options in Global and Indian Markets
Globally, option trading is massive. Exchanges like CBOE (Chicago Board Options Exchange) pioneered listed options. The U.S. markets dominate in volume and liquidity.
In India, options gained traction after NSE introduced index options in 2001. Today:
Nifty and Bank Nifty options are among the most traded derivatives worldwide.
Stock options are actively traded with physical settlement.
Weekly expiry contracts have boosted retail participation.
India is now among the top markets for derivatives trading globally.
4. Challenges, Risks, and Common Mistakes
Despite their potential, option trading is not easy. Challenges include:
Complexity: Requires understanding of pricing models and Greeks.
High Risk for Sellers: Unlimited potential losses.
Time Decay: Buyers must be right not only about direction but also timing.
Liquidity Issues: Illiquid contracts can result in slippage.
Common mistakes traders make:
Overleveraging with large positions.
Ignoring Greeks and volatility.
Trading without a defined plan or exit strategy.
Chasing profits without managing risk.
Awareness of these pitfalls is crucial for long-term success.
5. The Future of Option Trading and Final Thoughts
The world of options is evolving rapidly. With technology, AI-driven strategies, and algorithmic trading, options are becoming more accessible and efficient. Platforms now offer retail traders tools once exclusive to institutions.
In India, the increasing popularity of weekly options and innovations like zero brokerage discount brokers have democratized option trading. Globally, options tied to cryptocurrencies and ETFs are gaining popularity.
However, while opportunities expand, the fundamentals remain unchanged: options are powerful, but they demand respect, knowledge, and discipline.
In conclusion, option trading is not just about making fast money. It’s about using financial intelligence to structure trades, manage risks, and optimize outcomes in an uncertain market.

How AI is Transforming Financial Markets1. Introduction
Financial markets have traditionally relied on human expertise, intuition, and historical data analysis to make decisions. While these methods have served well, they are often limited by human cognitive biases, data processing constraints, and the speed at which information is absorbed and acted upon.
Artificial Intelligence, encompassing machine learning (ML), deep learning (DL), natural language processing (NLP), and predictive analytics, is enabling financial institutions to overcome these limitations. AI can process vast amounts of structured and unstructured data, identify patterns, make predictions, and execute actions in real-time. This has paved the way for smarter trading strategies, enhanced risk mitigation, and improved customer experiences.
The integration of AI in finance is not just a technological upgrade; it represents a paradigm shift in the structure and functioning of financial markets globally.
2. AI in Trading and Investment
2.1 Algorithmic Trading
Algorithmic trading refers to the use of computer algorithms to automate trading strategies. AI enhances algorithmic trading by making it adaptive, predictive, and capable of handling complex patterns that traditional models may overlook.
Machine Learning Algorithms: AI-powered algorithms can analyze historical data and detect subtle market patterns to make predictions about asset price movements. Unlike traditional models that rely on fixed rules, machine learning algorithms continuously learn and adapt based on new data.
High-Frequency Trading (HFT): AI facilitates HFT by enabling trades to be executed in milliseconds based on micro-market changes. AI models analyze price fluctuations, order book dynamics, and market sentiment to execute trades at optimal moments.
Predictive Analytics: AI predicts market trends, volatility, and asset price movements with high accuracy. Techniques like reinforcement learning allow models to simulate and optimize trading strategies in virtual market environments before applying them in real markets.
2.2 Robo-Advisors
Robo-advisors are AI-driven platforms that provide automated investment advice and portfolio management services. They use algorithms to assess an investor’s risk profile, financial goals, and market conditions, creating personalized investment strategies.
Accessibility: Robo-advisors democratize investing by making professional-grade financial advice accessible to retail investors at low costs.
Portfolio Optimization: AI dynamically adjusts portfolios based on market conditions, maximizing returns while minimizing risk.
Behavioral Analysis: By analyzing investor behavior, AI can provide personalized guidance to reduce emotional trading, which is a common source of losses.
2.3 Sentiment Analysis
AI leverages natural language processing to analyze news articles, social media, earnings calls, and financial reports to gauge market sentiment.
Market Prediction: Positive or negative sentiment extracted from textual data can provide early signals for stock price movements.
Event Detection: AI detects geopolitical events, regulatory changes, or corporate announcements that could impact markets.
Investor Insight: By analyzing sentiment patterns, AI helps investors anticipate market reactions, enhancing decision-making efficiency.
3. Risk Management and Compliance
3.1 Credit Risk Assessment
AI has transformed how banks and financial institutions assess creditworthiness. Traditional credit scoring models relied on limited historical data and rigid criteria, but AI can evaluate a broader set of variables.
Alternative Data: AI analyzes non-traditional data such as social behavior, transaction patterns, and digital footprints to assess credit risk.
Predictive Modeling: Machine learning models predict the probability of default more accurately than conventional statistical models.
Dynamic Risk Assessment: AI continuously monitors borrowers’ behavior and financial health, updating risk profiles in real-time.
3.2 Market Risk and Portfolio Management
AI enhances market risk management by modeling complex market dynamics and stress scenarios.
Scenario Analysis: AI simulates various market conditions, helping fund managers understand potential portfolio risks.
Volatility Prediction: Machine learning models forecast market volatility using historical data, enabling proactive risk mitigation strategies.
Optimization: AI optimizes portfolio allocations by balancing expected returns against potential risks in real-time.
3.3 Regulatory Compliance and Fraud Detection
Financial markets are heavily regulated, and compliance is critical. AI automates compliance processes and fraud detection.
Anti-Money Laundering (AML): AI detects suspicious transaction patterns indicative of money laundering or financial crimes.
RegTech Solutions: AI ensures adherence to regulatory requirements by automating reporting, monitoring, and auditing processes.
Fraud Detection: AI identifies anomalies in transaction data, preventing fraudulent activities with greater speed and accuracy than human oversight.
4. Enhancing Market Efficiency
AI improves market efficiency by reducing information asymmetry and enhancing decision-making for market participants.
4.1 Price Discovery
AI algorithms facilitate faster and more accurate price discovery by analyzing multiple data sources simultaneously, including market orders, economic indicators, and news.
4.2 Liquidity Management
AI optimizes liquidity by forecasting cash flow needs, monitoring order book dynamics, and predicting market depth.
4.3 Reducing Transaction Costs
Automated trading and AI-driven market analysis reduce operational and transaction costs, enabling more efficient markets.
5. AI in Customer Experience and Personalization
5.1 Personalized Financial Services
AI personalizes customer experiences by analyzing behavior patterns, transaction histories, and preferences.
Tailored Products: Banks and fintech firms offer customized investment products, loans, and insurance policies.
Chatbots and Virtual Assistants: AI-driven chatbots handle routine queries, transactions, and financial advice, improving customer satisfaction.
Financial Wellness Tools: AI analyzes spending and saving patterns to provide actionable advice, helping users achieve financial goals.
5.2 Behavioral Insights
By understanding investor behavior, AI helps reduce irrational decisions, encourages disciplined investing, and supports financial literacy.
6. AI-Driven Innovation in Financial Products
AI is not only enhancing existing financial services but also driving the creation of new products.
Algorithmic Derivatives: AI designs derivatives and structured products tailored to specific investor needs.
Dynamic Insurance Pricing: AI models assess risk dynamically, enabling real-time premium adjustments.
Smart Contracts and Blockchain: AI combined with blockchain technology automates contract execution, reducing counterparty risks and improving transparency.
7. Challenges and Risks of AI in Financial Markets
While AI offers numerous advantages, its adoption also comes with challenges:
7.1 Model Risk
AI models are only as good as the data and assumptions underlying them. Poorly designed models can lead to significant financial losses.
7.2 Ethical and Regulatory Concerns
AI’s decision-making process is often opaque (“black-box problem”), raising concerns about accountability, fairness, and compliance.
7.3 Cybersecurity Threats
AI systems are vulnerable to cyber-attacks, data breaches, and adversarial attacks that can manipulate outcomes.
7.4 Market Stability
The widespread use of AI in high-frequency trading and algorithmic strategies may amplify market volatility and systemic risks.
8. Case Studies of AI Transforming Financial Markets
8.1 JPMorgan Chase: COiN Platform
JPMorgan’s Contract Intelligence (COiN) platform uses AI to analyze legal documents and extract key data points, reducing manual review time from thousands of hours to seconds.
8.2 BlackRock: Aladdin Platform
BlackRock’s Aladdin platform integrates AI for risk management, portfolio optimization, and predictive analytics, providing a comprehensive view of market exposures and investment opportunities.
8.3 Goldman Sachs: Marcus and Trading Algorithms
Goldman Sachs uses AI-driven trading algorithms for securities and commodities, while Marcus leverages AI to enhance customer lending and risk assessment processes.
8.4 Retail Trading Platforms
Platforms like Robinhood and Wealthfront utilize AI to offer personalized recommendations, portfolio rebalancing, and real-time insights to millions of retail investors.
9. Future Trends
9.1 Explainable AI (XAI)
Future financial markets will increasingly demand AI systems that are transparent and explainable, ensuring accountability and regulatory compliance.
9.2 Integration with Quantum Computing
Quantum computing combined with AI could revolutionize financial modeling, enabling previously impossible optimizations and simulations.
9.3 Cross-Asset AI Trading
AI will integrate insights across equities, commodities, currencies, and derivatives, enhancing cross-asset trading strategies.
9.4 Democratization of AI Tools
As AI tools become more accessible, retail investors and smaller institutions will be able to leverage advanced analytics, leveling the playing field.
9.5 Sustainable and Ethical Finance
AI will help investors incorporate ESG (Environmental, Social, Governance) factors into investment decisions, promoting sustainable financial markets.
10. Conclusion
AI is fundamentally reshaping financial markets, making them faster, smarter, and more efficient. From algorithmic trading and risk management to customer personalization and product innovation, AI’s applications are extensive and transformative. However, this transformation comes with challenges, including ethical concerns, regulatory compliance, cybersecurity risks, and market stability issues.
As AI continues to evolve, financial markets will likely witness further innovation, democratization, and efficiency. Institutions that effectively harness AI while managing its risks will be best positioned to thrive in the increasingly complex and dynamic global financial ecosystem.
In essence, AI is not just changing how financial markets operate—it is redefining the very nature of finance, turning data into intelligence, and intelligence into strategic advantage. The future of financial markets will be defined by those who can master the synergy between human insight and artificial intelligence.
The Future of Futures Trading1. The Evolution of Futures Trading
1.1 Historical Background
Futures trading traces its roots to the agricultural markets of the 19th century. Farmers and merchants used forward contracts to lock in prices for crops, mitigating the risks of fluctuating market prices. The Chicago Board of Trade (CBOT), founded in 1848, became the first organized marketplace for standardized futures contracts, laying the foundation for modern derivatives trading. Over time, the range of underlying assets expanded to include metals, energy products, financial instruments, and more recently, digital assets such as cryptocurrencies.
1.2 The Role of Futures in Modern Markets
Futures serve multiple purposes in today’s markets:
Hedging: Corporations, financial institutions, and investors use futures to protect against price volatility in commodities, currencies, and financial instruments.
Speculation: Traders aim to profit from short-term price movements.
Arbitrage: Futures contracts enable the exploitation of price differences between markets.
Price Discovery: Futures markets provide transparent, real-time pricing signals that guide investment and production decisions globally.
2. Technological Advancements Shaping Futures Trading
2.1 Algorithmic and High-Frequency Trading
Advances in technology have transformed futures trading by introducing algorithmic and high-frequency trading (HFT). These automated systems execute trades at speeds and volumes impossible for human traders, leveraging complex mathematical models to identify arbitrage opportunities, manage risk, and capture microprice movements. HFT has enhanced market liquidity but also raised concerns regarding market stability and fairness.
2.2 Artificial Intelligence and Machine Learning
Artificial intelligence (AI) and machine learning (ML) are increasingly integrated into futures trading. AI algorithms analyze vast amounts of historical and real-time data, including market sentiment, macroeconomic indicators, and news feeds, to forecast price trends. Machine learning models can adapt to changing market conditions, improving predictive accuracy and decision-making efficiency.
2.3 Blockchain and Distributed Ledger Technology
Blockchain technology promises to revolutionize futures trading by increasing transparency, reducing settlement times, and minimizing counterparty risk. Smart contracts can automate trade execution and settlement, ensuring contracts are fulfilled without intermediaries. Exchanges exploring blockchain-based futures platforms may offer faster, more secure, and cost-effective trading environments.
2.4 Cloud Computing and Big Data Analytics
Cloud computing provides scalable infrastructure for processing large datasets, enabling faster trade execution, risk analysis, and scenario modeling. Big data analytics allows traders and institutions to identify patterns, correlations, and anomalies in real-time, enhancing trading strategies and risk management.
3. Globalization and Market Integration
3.1 Expansion of Emerging Market Futures
Emerging markets, particularly in Asia, Latin America, and Africa, are experiencing rapid growth in futures trading. Countries such as India, China, and Brazil are expanding their derivatives markets to provide hedging tools for commodities, currencies, and financial instruments. This expansion increases liquidity, reduces global price volatility, and provides new opportunities for cross-border investment.
3.2 Cross-Market Connectivity
Technological integration allows futures contracts to be traded across multiple exchanges simultaneously. Cross-market connectivity facilitates global arbitrage opportunities, harmonizes pricing, and enhances capital efficiency. As futures markets become increasingly interconnected, price movements in one market can have immediate implications worldwide.
3.3 Rise of Global Commodity Trading Hubs
Key global hubs such as Chicago, London, Singapore, and Dubai continue to dominate futures trading. However, emerging hubs in Asia and the Middle East are gaining prominence due to growing commodity production, technological investment, and regulatory reforms. These hubs will play a pivotal role in shaping the future of global futures trading.
4. Regulatory Evolution
4.1 Current Regulatory Landscape
Futures trading is heavily regulated to ensure market integrity, transparency, and investor protection. Agencies such as the U.S. Commodity Futures Trading Commission (CFTC), the European Securities and Markets Authority (ESMA), and the Securities and Exchange Board of India (SEBI) oversee futures markets. Regulations cover margin requirements, position limits, reporting obligations, and risk management protocols.
4.2 Emerging Regulatory Trends
The future of futures trading will be influenced by new regulatory trends:
Digital Asset Regulation: As cryptocurrency futures gain popularity, regulators are implementing frameworks to ensure investor protection and prevent market manipulation.
Cross-Border Oversight: Harmonizing global regulatory standards may reduce arbitrage and enhance market stability.
Sustainability and ESG Compliance: Futures markets may introduce products linked to environmental, social, and governance (ESG) benchmarks, responding to investor demand for responsible investment.
4.3 Balancing Innovation and Risk
Regulators face the challenge of balancing innovation with risk management. While technology and product innovation enhance efficiency, they also introduce systemic risks, cybersecurity threats, and potential market abuse. Future regulatory frameworks will need to adapt dynamically, leveraging technology for monitoring and enforcement.
5. The Rise of Retail Participation
5.1 Democratization of Futures Trading
Advances in online trading platforms and mobile technology have democratized access to futures markets. Individual investors now participate alongside institutional traders, using tools and analytics previously reserved for professionals. This shift increases market liquidity and widens participation but also introduces behavioral risks, such as overleveraging and speculative bubbles.
5.2 Education and Risk Management
The surge in retail participation highlights the importance of education. Platforms offering tutorials, simulation tools, and real-time market insights empower retail traders to understand leverage, margin requirements, and risk mitigation strategies. Future trends will likely see a blend of technology-driven guidance and personalized AI coaching to enhance trader competency.
6. Emerging Futures Products
6.1 Cryptocurrency Futures
Cryptocurrency futures, such as Bitcoin and Ethereum contracts, have emerged as a new frontier. They allow hedging and speculative opportunities in volatile digital asset markets while integrating traditional financial instruments with blockchain innovation. Regulatory clarity and technological infrastructure will dictate the growth trajectory of crypto futures.
6.2 ESG and Sustainability Futures
Futures linked to carbon credits, renewable energy indices, and other ESG metrics are gaining traction. These products allow investors and corporations to manage environmental risk and align portfolios with sustainability objectives. As global focus on climate change intensifies, ESG-linked futures will likely become mainstream.
6.3 Inflation and Macro-Economic Futures
Products designed to hedge macroeconomic risks, such as inflation swaps or interest rate futures, are evolving. These instruments provide investors and institutions with tools to navigate monetary policy changes, inflationary pressures, and geopolitical uncertainties.
7. Risk Management and Market Stability
7.1 Advanced Hedging Strategies
Futures traders increasingly employ sophisticated hedging strategies using options, spreads, and algorithmic overlays. These strategies enhance capital efficiency, minimize downside risk, and stabilize portfolios during market turbulence.
7.2 Systemic Risk Considerations
The rapid growth of futures trading, high leverage, and technological interconnectivity can contribute to systemic risk. Market crashes, flash events, and cyber threats necessitate robust risk frameworks, continuous monitoring, and stress-testing mechanisms.
7.3 Future of Clearing and Settlement
Central clearinghouses play a critical role in mitigating counterparty risk. Innovations in blockchain-based clearing could enable real-time settlement, reducing systemic exposure and improving capital utilization. The future will likely see hybrid models combining centralized oversight with decentralized technology.
8. Technological Disruption and Market Efficiency
8.1 Predictive Analytics and Sentiment Analysis
The use of AI-driven sentiment analysis allows traders to anticipate market moves based on news, social media, and macroeconomic events. Predictive analytics transforms data into actionable insights, improving execution strategies and risk-adjusted returns.
8.2 Smart Contracts and Automated Execution
Smart contracts can automate futures trade execution, margin calls, and settlements. This automation reduces human error, increases transparency, and lowers operational costs. As adoption grows, smart contracts could redefine the operational landscape of futures exchanges.
8.3 Integration with IoT and Real-World Data
The Internet of Things (IoT) and real-time data feeds enable futures contracts to be linked to tangible metrics, such as agricultural yield, energy consumption, or shipping logistics. This integration increases contract accuracy and enables innovative products tailored to industry-specific risks.
9. Challenges and Opportunities
9.1 Cybersecurity Threats
As technology permeates futures trading, cybersecurity becomes a critical concern. Exchanges, brokers, and trading platforms must invest in robust security protocols to prevent data breaches, fraud, and market manipulation.
9.2 Market Volatility and Speculation
High-frequency trading, retail participation, and leveraged products can exacerbate market volatility. Effective risk management, regulatory oversight, and trader education are essential to mitigate speculative excesses.
9.3 Global Geopolitical Risks
Geopolitical events, trade disputes, and monetary policy shifts can impact futures markets significantly. Traders must integrate macroeconomic intelligence and scenario analysis into decision-making frameworks.
9.4 Opportunities for Innovation
The fusion of AI, blockchain, and global connectivity opens unprecedented opportunities. New product classes, algorithmic strategies, and cross-border trading platforms will redefine how futures markets operate, providing efficiency, transparency, and inclusivity.
10. The Future Outlook
10.1 Technology-Driven Evolution
The future of futures trading is inherently tied to technology. AI, ML, blockchain, cloud computing, and big data will continue to transform market structure, execution, and risk management.
10.2 Global Market Integration
Emerging markets and cross-border trading will deepen market integration, providing new opportunities for diversification and price discovery.
10.3 Regulatory Adaptation
Dynamic, technology-aware regulatory frameworks will balance innovation with investor protection and systemic stability.
10.4 Expanding Product Horizons
From digital assets to ESG-focused contracts, futures trading will diversify to meet the evolving needs of participants and the global economy.
10.5 Democratization and Education
Greater retail participation, combined with technology-driven education, will democratize access while enhancing market sophistication and resilience.
Conclusion
Futures trading has evolved from simple agricultural contracts to a sophisticated, technology-driven, and globally interconnected ecosystem. The future promises even greater transformation, driven by AI, blockchain, data analytics, and globalization. While challenges such as market volatility, cybersecurity, and regulatory compliance persist, the opportunities for innovation, efficiency, and inclusivity are immense.
The success of futures trading in the next decades will depend on the ability of exchanges, regulators, traders, and technology providers to adapt, innovate, and collaborate. The markets of tomorrow will be faster, smarter, more accessible, and more resilient, offering tools for hedging, speculation, and price discovery that are more advanced and integrated than ever before. Futures trading will not just reflect the pulse of the global economy—it will actively shape it.
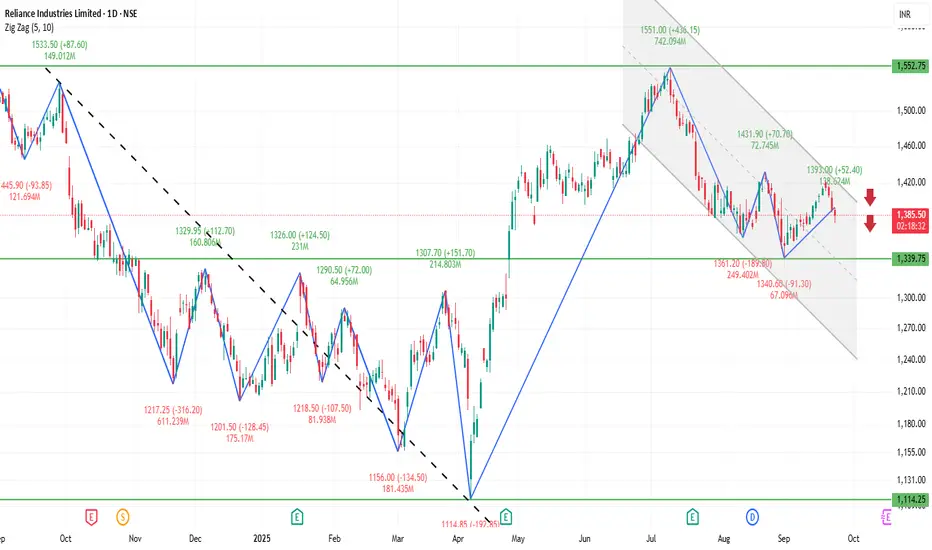
RELIANCE 1D Time frame📊 Reliance Daily (1D) Snapshot
Close: Around ₹1,382
Range of the Day: High near ₹1,396, Low near ₹1,380
Trend: Slight weakness on daily chart (mild red candle)
Stock is consolidating between support and resistance zones.
🎯 Key Daily Levels
Support Zone: ₹1,350 – ₹1,365
Strong Support: ₹1,330
Resistance Zone: ₹1,405 – ₹1,425
Strong Resistance: ₹1,430
📝 Strategy on 1D Chart
Bearish View
If price goes near ₹1,405 – ₹1,425 and fails to sustain, you can short.
Entry: ₹1,410 approx
Stop-loss: ₹1,430
Target: ₹1,365 → ₹1,350
Bullish View
If Reliance holds above ₹1,350 and shows reversal, you can buy.
Entry: ₹1,360 – ₹1,365 zone
Stop-loss: ₹1,330
Target: ₹1,405 → ₹1,425
Breakout Trade
If it closes above ₹1,430 with strong candle, expect momentum upside.
Target: ₹1,460+
Breakdown Trade
If it closes below ₹1,330, selling pressure can push it to ₹1,300 or lower.
Divergenc Secrets1. Option Styles
American Options – Can be exercised at any time before expiration.
European Options – Can only be exercised on the expiration date.
Exotic Options – Customized contracts with complex features (used by institutions).
Most stock options in the U.S. are American-style, while index options are often European-style. In India, stock and index options are European-style.
2. Why Trade Options?
Options trading is popular because it offers:
Leverage – Control large stock positions with small capital.
Hedging – Protect portfolios against market declines.
Income Generation – By selling (writing) options and collecting premiums.
Speculation – Betting on price movements without owning the stock.
Flexibility – Strategies can be bullish, bearish, neutral, or even profit from volatility.
3. Risks in Option Trading
While options provide benefits, they also come with risks:
Limited life span – Options expire; if your prediction is wrong, you lose the premium.
Leverage risk – Small movements can cause large percentage losses.
Complexity – Strategies can be difficult for beginners.
Unlimited losses – Selling (writing) naked options can lead to unlimited loss potential.
4. Basic Option Strategies
a) Buying Calls
Suitable when expecting strong upward movement.
Limited risk (premium), unlimited reward.
b) Buying Puts
Suitable when expecting strong downward movement.
Limited risk, high reward potential.
c) Covered Call
Own the stock and sell a call option against it.
Generates income but caps upside potential.
d) Protective Put
Own the stock and buy a put as insurance.
Protects against downside risk.
e) Straddle
Buy both a call and put at the same strike and expiration.
Profits from large movements in either direction.
f) Strangle
Similar to straddle but with different strike prices.
Cheaper but requires bigger move.
g) Iron Condor
Sell one call and one put (out of the money) and buy further out-of-the-money options for protection.
Profits from low volatility.

RELIANCE 1D Time frame📍 Current Price Context
Trading around ₹1,386
Price is near a resistance zone → important level to watch.
🔍 Key Levels
Immediate resistance: ₹1,380–₹1,390 (current zone)
Next resistance: ₹1,420–₹1,450 (if breakout happens)
Immediate support: ₹1,350–₹1,360
Stronger support: ₹1,320–₹1,330
📊 Indicators & Trend
Price is just below resistance, so breakout or rejection will decide the move.
RSI near neutral → neither overbought nor oversold.
Structure looks range-bound, but slightly bullish as long as it holds above ₹1,350.
🔮 Possible Scenarios
Bullish breakout → If Reliance sustains above ₹1,390–₹1,400 with volume, next upside target is ₹1,420–₹1,450.
Sideways move → May trade between ₹1,350–₹1,390 until momentum builds.
Bearish pullback → If it fails at resistance, price could slip toward ₹1,350, and if broken, then ₹1,320.
👉 At the current level (₹1,386), Reliance is at a decisive zone. Breakout above ₹1,390 will be bullish, while rejection could send it back to supports.
Part 4 Learn Institutional Trading1. How Option Trading Works
Imagine two traders:
Rahul (Call buyer) thinks Infosys will go up.
Neha (Call seller) thinks Infosys will stay flat or fall.
Infosys spot = ₹1500. Rahul buys a Call option at 1520 strike for a premium of ₹20. Lot size = 100 shares.
If Infosys rises to ₹1600, Rahul gains (1600 – 1520 = ₹80 profit – ₹20 premium = ₹60 net profit per share × 100 = ₹6,000).
Neha loses ₹6,000.
If Infosys stays below 1520, Rahul’s option expires worthless, and his maximum loss is ₹2,000 (premium paid).
This shows how option trading is a zero-sum game: one’s profit is another’s loss.
2. Option Premium & Its Components
The premium you pay for an option has two parts:
Intrinsic Value (IV): Real profit if exercised now.
For Call = Spot Price – Strike Price.
For Put = Strike Price – Spot Price.
Time Value (TV): Extra value due to time left till expiry (uncertainty = potential).
As expiry nears, time value decays (Theta decay).
3. Moneyness in Options
Options are classified based on relation between spot price & strike price:
In the Money (ITM): Option has intrinsic value.
Example: Spot ₹1600, Call strike ₹1500 = ITM.
At the Money (ATM): Spot = Strike.
Example: Spot ₹1600, Call strike ₹1600.
Out of the Money (OTM): Option has no intrinsic value, only time value.
Example: Spot ₹1600, Call strike ₹1700.
4. Participants in Options Market
Hedgers – Reduce risk (e.g., an investor hedges stock portfolio with put options).
Speculators – Take directional bets for profit.
Arbitrageurs – Exploit price differences across markets.
Option Writers (Sellers) – Earn premium by selling options, often institutions.
5. Why Trade Options? Benefits & Uses
Leverage: Control large positions with small capital.
Hedging: Protect portfolio against adverse moves.
Flexibility: Multiple strategies for bullish, bearish, or neutral markets.
Income Generation: Selling options can provide steady income.
Risk Defined (for buyers): Maximum loss = premium paid.
6. Risks in Option Trading
Unlimited Loss (for sellers): Option writers can face huge losses.
Time Decay: Buyers lose money if market stays sideways.
Volatility Trap: Sudden volatility crush can wipe out premiums.
Complexity: Requires deep knowledge of Greeks & strategies.
Liquidity Risk: Some options have low trading volume.

Intraday Scalping Tips: A Comprehensive Guide for Traders1. Understanding Intraday Scalping
Intraday scalping is a high-frequency trading strategy where traders aim to exploit minor price movements in highly liquid stocks, indices, or commodities. Scalpers typically hold positions for a few seconds to a few minutes, rarely longer than an hour, focusing on micro-trends.
Key Characteristics of Scalping:
Frequency: Multiple trades per day, often 20-50 or more.
Profit per trade: Small, usually 0.1% to 0.5% of the asset price.
Timeframe: Very short, typically 1-minute, 5-minute, or tick charts.
Tools: Technical indicators, Level 2 data, order books, and high-speed trading platforms.
Scalping is favored by traders who thrive on fast decision-making and have the discipline to follow strict risk management rules.
2. Choosing the Right Market and Instruments
Not all markets are suitable for scalping. The ideal instruments share characteristics like liquidity, volatility, and tight bid-ask spreads.
A. Liquidity
Highly liquid instruments allow traders to enter and exit positions quickly without significant slippage. Examples include:
Stocks: Large-cap equities such as Apple, Microsoft, or Reliance Industries.
Indices: Nifty 50, S&P 500, or Dow Jones futures.
Forex pairs: EUR/USD, GBP/USD, USD/JPY.
Commodities: Gold, crude oil futures.
B. Volatility
Scalpers thrive on small price fluctuations. Moderate volatility ensures there are enough trading opportunities without excessive risk. Instruments with too low volatility may not provide sufficient profit potential, while highly volatile ones can lead to rapid losses.
C. Spreads
Tighter bid-ask spreads reduce trading costs. Scalpers often trade instruments with minimal spreads to maximize net gains.
3. Technical Analysis for Scalping
Technical analysis is the backbone of scalping. Traders rely on charts, indicators, and patterns to make rapid decisions.
A. Timeframes
Scalpers primarily use:
1-Minute Charts: Ideal for ultra-short-term trades.
5-Minute Charts: Better for slightly larger moves and trend confirmation.
Tick Charts: Track each transaction for highly active markets.
B. Indicators
Common indicators for scalping include:
Moving Averages (MA):
Use short-term MAs (5, 10, 20 periods) to identify micro-trends.
Crossovers signal potential entry/exit points.
Relative Strength Index (RSI):
Helps spot overbought or oversold conditions.
RSI above 70 indicates overbought, below 30 indicates oversold.
Bollinger Bands:
Show volatility and potential reversal zones.
Price touching the upper or lower band may indicate a short-term reversal.
Volume Analysis:
Confirms the strength of price movements.
Increasing volume with price momentum strengthens trade signals.
C. Price Action Patterns
Scalpers also rely on candlestick patterns:
Pin Bars: Indicate quick reversals.
Doji: Signal market indecision.
Engulfing Patterns: Show strong directional shifts.
4. Scalping Strategies
A. Momentum Scalping
Momentum scalping involves entering trades in the direction of strong price movements. Traders look for:
Breakouts from consolidation zones.
High volume spikes confirming the trend.
Fast execution to ride the momentum.
Example: A stock breaking above a resistance level with heavy volume may provide a 1-2% intraday profit if timed correctly.
B. Range Trading
Some instruments trade within a defined price range during the day. Scalpers can:
Buy at support and sell at resistance.
Use tight stop-losses to minimize risk.
Confirm trades with oscillators like RSI or Stochastic.
C. News-Based Scalping
Economic reports, corporate announcements, or geopolitical news can trigger rapid price movements. Scalpers exploit this by:
Monitoring economic calendars.
Reacting quickly to breaking news.
Using platforms with low latency execution.
Caution: News-based scalping is high-risk due to unpredictable price swings.
D. Spread Scalping
This strategy is common in Forex or highly liquid markets:
Traders exploit tiny differences in bid-ask spreads.
Requires sophisticated software or a broker offering minimal latency.
5. Risk Management in Scalping
Effective risk management is non-negotiable in scalping. High trade frequency increases exposure, making small losses potentially catastrophic.
A. Position Sizing
Use small position sizes relative to your total capital.
Limit risk to 0.5%-1% per trade.
B. Stop-Loss and Take-Profit
Set tight stop-losses to avoid large losses.
Use risk-reward ratios around 1:1 or 1:1.5 due to the small profit target per trade.
C. Avoid Overtrading
Stick to your strategy, even if tempted to chase small gains.
Overtrading can erode profits and increase emotional stress.
D. Monitor Transaction Costs
Frequent trades mean higher brokerage and fees.
Opt for brokers with low commissions and tight spreads.
6. Common Mistakes to Avoid
Overleveraging: Increases risk of large losses.
Ignoring Transaction Costs: High fees can nullify gains.
Chasing the Market: Jumping into trades without setup leads to losses.
Neglecting Stop-Losses: Can transform small losses into significant drawdowns.
Emotional Trading: Fear and greed are the biggest enemies of scalpers.
Conclusion
Intraday scalping is a high-speed, high-discipline trading strategy that can yield consistent profits if executed correctly. The key to success lies in:
Choosing the right instruments.
Mastering technical analysis and chart patterns.
Implementing strict risk management.
Maintaining emotional control and mental focus.
Leveraging technology to improve speed and efficiency.
Scalping is not for everyone. It requires patience, precision, and resilience. However, for traders willing to invest time in learning and practicing, it can be a highly rewarding strategy in the world of financial markets.
Reliance in Parallel ChannelReliance moving inside the parallel channel in the upper band.
A rising channel (also called an ascending channel) is formed by drawing two parallel trendlines—one connecting higher lows (support) and the other connecting higher highs (resistance).
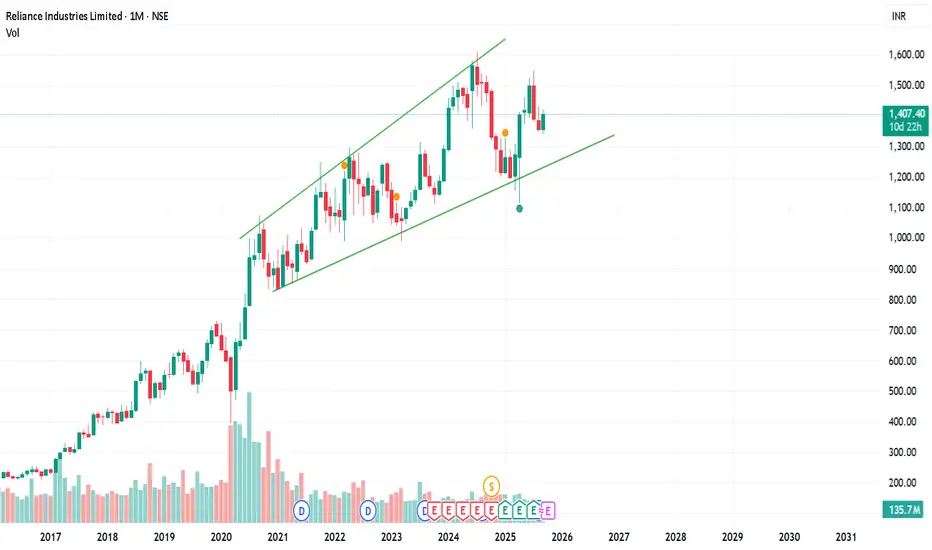
Divergence Secrets1. Basic Option Trading Strategies
These are simple, beginner-friendly strategies where risks are limited and easy to understand.
1.1 Covered Call
How it Works: You own 100 shares of a stock and sell a call option against it.
Goal: Earn income (premium) while holding stock.
Best When: You expect the stock to stay flat or slightly rise.
Risk: If stock rises too much, you must sell at the strike price.
Example: You own Infosys at ₹1,500. You sell a call at strike ₹1,600 for premium ₹20. If Infosys stays below ₹1,600, you keep the premium.
1.2 Protective Put
How it Works: You buy a put option to protect a stock you own.
Goal: Hedge downside risk.
Best When: You fear a market drop but don’t want to sell.
Example: You own TCS at ₹3,500. You buy a put with strike ₹3,400. If TCS falls to ₹3,200, your stock loses ₹300, but the put gains.
1.3 Cash-Secured Put
How it Works: You sell a put option while holding enough cash to buy the stock if assigned.
Goal: Earn premium and possibly buy stock at a discount.
Best When: You’re okay owning the stock at a lower price.
2. Intermediate Strategies
Now we step into strategies combining multiple options.
2.1 Vertical Spreads
These involve buying one option and selling another of the same type (call/put) with different strikes but same expiry.
(a) Bull Call Spread
Buy lower strike call, sell higher strike call.
Limited risk, limited profit.
Best when moderately bullish.
(b) Bear Put Spread
Buy higher strike put, sell lower strike put.
Best when moderately bearish.
2.2 Calendar Spread
Buy a long-term option and sell a short-term option at the same strike.
Profits if stock stays near strike as short-term option loses value faster.
2.3 Diagonal Spread
Like a calendar, but strikes are different.
Offers flexibility in adjusting for trend + time.
3. Advanced Option Trading Strategies
These are for experienced traders who understand volatility and time decay deeply.
3.1 Straddle
Buy one call and one put at same strike, same expiry.
Profits if the stock makes a big move in either direction.
Best before major events (earnings, policy announcements).
Risk: If stock stays flat, you lose premium.
3.2 Strangle
Similar to straddle, but strike prices are different.
Cheaper, but requires larger move.
3.3 Iron Condor
Sell an out-of-the-money call spread and put spread.
Profits if stock stays within a range.
Great for low-volatility environments.
3.4 Butterfly Spread
Combination of calls (or puts) where profit peaks at a middle strike.
Limited risk, limited reward.
Best when expecting very little movement.
3.5 Ratio Spreads
Sell more options than you buy (like 2 short calls, 1 long call).
Higher potential reward, but can be risky if stock trends too far.

long term bullish view on reliancedaily tf is +ve for short its -ve
I have marked important levels based on co relation
I used factors like ema , fibonacci, and resistance becomes support concepts

Market Reform Fallout: Opportunities Hidden in UncertaintyIntroduction
In the ever-evolving landscape of global finance, market reforms—whether initiated by governments, central banks, or supranational entities—often usher in periods of heightened uncertainty. While such reforms aim to enhance economic stability, competitiveness, and growth, they can also lead to market volatility and investor apprehension. However, history has shown that amidst this uncertainty lie opportunities for those with the acumen to identify and capitalize on them.
This article delves into the multifaceted impacts of market reforms, exploring both the challenges they present and the avenues they open for astute investors and policymakers.
The Nature of Market Reforms
Market reforms encompass a broad spectrum of policy changes, including:
Deregulation: Reducing government intervention in markets to foster competition.
Privatization: Transferring state-owned enterprises to private ownership.
Trade Liberalization: Lowering tariffs and non-tariff barriers to encourage international trade.
Monetary and Fiscal Adjustments: Altering interest rates, taxation, and government spending to influence economic activity.
While these reforms are designed to stimulate economic growth and efficiency, their implementation can lead to short-term disruptions as markets adjust to new realities.
Fallout from Market Reforms
The immediate aftermath of market reforms often includes:
Market Volatility: Sudden policy shifts can lead to sharp market reactions, affecting asset prices and investor sentiment.
Sectoral Disruptions: Industries that were previously protected may face increased competition, leading to restructuring or closures.
Regulatory Uncertainty: Ambiguities in new policies can create a challenging environment for businesses and investors.
For instance, the European Union's ongoing review of merger policies has created uncertainty in the corporate sector, as companies await clearer guidelines before pursuing consolidation strategies
Identifying Opportunities Amidst Uncertainty
Despite the challenges, periods of uncertainty following market reforms can present unique opportunities:
Emerging Market Investments: Countries undergoing reforms often experience growth in sectors like infrastructure, technology, and consumer goods. For example, South Africa's financial markets have soared despite weak economic data and slow reforms, indicating potential in emerging markets
Strategic Mergers and Acquisitions: Regulatory changes can lead to consolidation in certain industries, presenting opportunities for mergers and acquisitions. BNP Paribas anticipates future opportunities in European investment banking driven by expected restructuring and refinancing
Policy-Driven Sectors: Reforms in areas like renewable energy, healthcare, and education can create investment opportunities in companies aligned with new policy directions.
Diversification Strategies: Investors can mitigate risks by diversifying portfolios across regions and sectors that are less affected by the reforms.
Case Studies of Reform-Induced Opportunities
South Africa: Despite slow economic growth and high unemployment, South Africa's financial markets have performed strongly, with the Johannesburg Stock Exchange reaching record highs. Analysts attribute this optimism to strong commodity prices and perceived political stability
European Union: The EU's review of merger policies has created uncertainty, but also potential for consolidation in industries like technology and manufacturing. Companies that can navigate the regulatory landscape may find opportunities for growth.
United States: The Federal Reserve's balancing act in a politically volatile landscape presents both risks and opportunities. Sectors sensitive to interest rates, such as real estate and high-yield bonds, remain vulnerable, while defensive assets like Treasury securities and gold may gain allure as hedging tools
Strategies for Navigating Reform-Induced Uncertainty
Investors and policymakers can adopt several strategies to navigate the uncertainties arising from market reforms:
Scenario Planning: Developing multiple scenarios to anticipate potential outcomes and prepare accordingly.
Stakeholder Engagement: Engaging with policymakers to influence the design and implementation of reforms.
Risk Management: Employing hedging techniques and diversifying investments to mitigate potential losses.
Monitoring Indicators: Keeping an eye on key economic and political indicators that signal changes in the reform trajectory.
Conclusion
While market reforms can lead to periods of uncertainty, they also create avenues for growth and innovation. By adopting a proactive and informed approach, investors and policymakers can turn potential challenges into opportunities, driving progress and prosperity in the evolving global market landscape.