Advance Option Trading vs. Master Institutional Trading🎯 What is Advance Option Trading?
Advance Option Trading means using complex option strategies to manage risk, take advantage of volatility, or make consistent income from the market.
You’re not just buying a Call or a Put here. You’re using combinations of options like:
Spreads (Bull Spread, Bear Spread)
Iron Condors
Butterflies
Ratio Spreads
Calendar Spreads
You're also learning to understand and control variables like:
Delta (directional movement)
Theta (time decay)
Vega (impact of volatility)
Gamma (rate of Delta change)
In short, it’s like playing chess with the market using tools that have defined risk and reward. You can win even if the market moves sideways or only slightly moves in your direction.
🧠 What is Master Institutional Trading?
Master Institutional Trading is about thinking and trading like big institutions – the banks, hedge funds, and FIIs (Foreign Institutional Investors). These players don’t trade like retail traders.
They control large volumes, manage millions or billions in capital, and have the ability to move markets. But here's the secret: they don’t chase price… they create price movement.
In this trading style, your focus is on:
Volume Profile
Order Blocks
Liquidity Zones
Market Structure
Smart Money Concepts (SMC)
Wyckoff Theory
You're not predicting price – you're following the footprints of big money. You’re trying to enter when institutions are entering, and avoid traps they set for retail traders.
🔄 Core Difference at a Glance
Feature Advance Option Trading Master Institutional Trading
Asset Used Options (CE/PE) Stocks, Futures, Options
Main Tool Option Greeks, Option Chain Volume Profile, Order Flow
Style Strategy-based Flow-based
Mindset Structured, mathematical Contextual, dynamic
Learning Curve High (requires math + logic) High (requires market psychology + vol read)
🧰 Tools Used
Tool Option Trading Institutional Trading
Option Chain ✅ ❌
Greeks (Delta, Theta, Vega) ✅ ❌
Volume Profile ❌ ✅
Market Structure (HH/LL) ❌ ✅
Implied Volatility (IV) ✅ ❌
Order Flow/Tape ❌ ✅
Liquidity Zones ❌ ✅
Expiry Analysis ✅ Sometimes
VWAP & POC Optional Core tool
🎯 Goals of Each Trader
🧪 Advance Option Trader:
Earn from time decay (Theta)
Use spreads to protect capital
Trade with defined risk
Take advantage of volatility crush
Scalp on expiry days using option premiums
🎯 Institutional Trader:
Trade in alignment with Smart Money
Ride major directional moves
Avoid retail traps
Use volume as a leading indicator
Trade price action with deeper logic
💥 Example in NIFTY
Let’s say NIFTY is at 22000.
✅ Option Trader's View:
Market is range-bound
Build an Iron Condor:
Sell 21800 PE, Buy 21700 PE
Sell 22200 CE, Buy 22300 CE
Max profit if NIFTY stays in range for next 3 days
✅ Institutional Trader's View:
Market faked a breakout above 22100
Big volume appeared at top, then reversed
Enters short after liquidity sweep
Targets zone near 21850, which is a demand block
🤔 Which One Should You Learn?
Your Profile Go for Option Trading Go for Institutional Trading
You like rules, logic, math ✅ ❌
You enjoy price-action & market behavior ❌ ✅
Want passive income from theta decay ✅ ❌
Want to scalp or swing big moves ❌ ✅
Prefer fixed risk/reward trades ✅ ❌
Want to track where big money trades ❌ ✅
You hate fake breakouts ❌ ✅
🧩 Can You Combine Both?
Absolutely!
In fact, many successful traders today use Institutional Trading concepts (like SMC or Volume Profile) to identify zones and then execute trades using option strategies.
Example:
Use institutional zone to identify support/resistance
Then sell options near those zones
Or place a directional option spread trade
This is called "confluence trading" – where different systems come together to build a stronger edge.
⚠️ Common Mistakes
🚫 In Option Trading:
Ignoring Greeks
Blindly buying options without IV analysis
Trading low volume strikes
Not adjusting positions
🚫 In Institutional Trading:
Overusing Smart Money concepts without confirmation
Misreading fakeouts as real breakouts
Trading against volume
Being impatient and entering early
✅ Final Summary
🔹 Advance Option Trading
You’re a strategy player
Mastering time decay, volatility, and spreads
Goal: Defined profit, controlled loss, consistent income
🔹 Master Institutional Trading
You’re a market observer
Mastering order flow, liquidity, and manipulation
Goal: Ride big moves, avoid traps, think like smart money
Trade ideas

RELIANCE 1D TIMEFRAME🧾 Basic Market Overview
Open: ₹2,990
High: ₹3,012
Low: ₹2,943
Close: ₹2,956
Change: Down by ~₹34 (approx. -1.13%)
Today, Reliance started strong but faced immediate selling near the ₹3,000 mark, resulting in a negative close. The price remained weak for most of the session, and closed near the day’s low, which is a bearish sign.
🕯️ Candlestick Formation
The candle formed on the daily chart resembles a strong bearish candle — possibly a long red candle or bearish engulfing if it closes below the previous day’s close. This shows:
📈 Trend Overview
Short-Term Trend: Weak — downward momentum building
Medium-Term Trend: Sideways to slightly bullish
Long-Term Trend: Bullish — still intact unless price breaks ₹2,850
Today’s weakness has not yet broken long-term structure, but short-term traders should be cautious.
🔮 What Could Happen Next?
✅ Bullish Recovery:
If Reliance moves back above ₹3,000 and sustains with volume, it can retest ₹3,050–₹3,080
A bullish engulfing or reversal pattern needed for upside confirmation
⚠️ Bearish Continuation:
If it breaks below ₹2,940, more downside is possible toward ₹2,915–₹2,875
Traders may take short positions below this level with tight stop-loss
🔄 Consolidation:
If the price holds between ₹2,940 and ₹3,000, expect sideways movement or base building before a big move
🎯 Strategy Suggestions
For Intraday Traders:
Watch ₹2,940 – ₹3,000 levels closely
Short below ₹2,940 with a target of ₹2,915
Long above ₹3,000 only if backed by strong buying
For Swing Traders:
Avoid new longs until daily candle shows strength
Consider fresh buys near ₹2,900–₹2,915 with SL below ₹2,875
Wait for a breakout above ₹3,050 to confirm bullish reversal
For Investors:
No need to panic; long-term uptrend still valid
Add in dips if it reaches ₹2,875–₹2,850 with confirmation
Fundamental strength supports medium-to-long-term outlook
📌 Summary
Reliance showed bearish sentiment today, breaking below the short-term support of ₹2,975 and closing weak at ₹2,956. It’s trading between a critical support zone of ₹2,940–₹2,915 and facing resistance around ₹3,000–₹3,020.
Short-term: Bearish bias
Medium-term: Neutral to weak bullish
Long-term: Still bullish unless ₹2,850 breaks decisively
Traders should be cautious and wait for confirmation before taking aggressive positions.
Buyers attempted a push above ₹3,000 but failed.
Bears took over the session.
Closing near the day’s low suggests strong downside momentum.
Master Institutional Trading✅ Introduction: What Is Institutional Trading?
Institutional trading refers to the strategies and market activities carried out by big players—like hedge funds, mutual funds, insurance companies, foreign institutional investors (FIIs), banks, and proprietary trading firms.
Unlike retail traders (individuals), institutions manage large capital, influence markets, and use advanced data-driven strategies to enter and exit positions silently and smartly.
"Master Institutional Trading" is all about learning how these big players operate, how they make decisions, and how you—an individual trader—can read their moves and trade alongside the smart money instead of against it.
🧠 Why Learn Institutional Trading?
Most retail traders lose money because they trade emotionally or follow the crowd. Institutional traders, on the other hand:
Follow data, not emotions
Trade with discipline and risk management
Use volume, price action, and order flow
Focus on capital protection as much as profits
Mastering Institutional Trading helps you:
Understand how smart money moves
Identify hidden demand and supply zones
Trade with precision using volume and price action
Avoid retail traps and manipulation zones
Develop a rule-based, professional approach
📘 What You Learn in Master Institutional Trading
Here’s what a full-fledged Master Institutional Trading program or strategy guide includes:
1️⃣ Market Structure: Understanding the Battlefield
Difference between retail and institutional behavior
Market cycles: Accumulation → Manipulation → Distribution
Price action and how institutions create fake breakouts
Liquidity hunting: How institutions trap retail traders
2️⃣ Smart Money Concepts
Smart money refers to capital controlled by professional institutions. You’ll learn:
How to track smart money footprints
Concepts like Order Blocks, Liquidity Zones, Fair Value Gaps (FVG)
Role of volume spikes and open interest in showing big trades
How smart money builds positions slowly to avoid moving the market
3️⃣ Volume Profile and Order Flow
Institutional traders focus on volume and flow, not indicators.
How to use Volume Profile (POC, Value Area High/Low)
Footprint charts and Delta analysis
How to read Buy vs Sell pressure
Spotting imbalances where smart money takes control
4️⃣ Institutional Candlestick Behavior
Candles tell a story—especially when institutional players are involved.
You’ll learn:
Master Candle setups
Break of Structure (BOS) and Change of Character (CHOCH)
Identifying manipulation wicks and liquidity grabs
Candlestick rejections at key institutional levels
5️⃣ Option Chain Analysis (Institutional Option Trading)
Institutions use options to hedge and speculate quietly.
Interpreting Open Interest (OI) data
Spotting institutional positions at strikes
Using PCR (Put Call Ratio) and Max Pain
Advanced option strategies like short straddles/strangles, iron condors
6️⃣ Institutional Risk Management
Institutions are masters of risk.
You will learn:
Capital allocation strategy
Stop-loss planning based on liquidity zones, not random points
Scaling into trades, position sizing
Trade management and profit-booking plans
7️⃣ Market Psychology & Trap Detection
Institutional traders create fake moves to trap retail traders.
How to avoid bull traps and bear traps
Understand news-based manipulation
The concept of dumb money vs smart money
Mindset training for following your edge
8️⃣ Building Your Institutional Strategy
The final goal is to trade like an institution, even with a small account.
You will build:
A structured plan based on smart money concepts
Entry/Exit criteria using price action + volume
Trade journaling system
Performance review framework
💼 Who Is This For?
"Master Institutional Trading" is ideal for:
Intermediate and advanced traders
Option traders looking to time entries better
Intraday, swing, and positional traders
Traders tired of using random indicators
Anyone serious about building a long-term profitable system
🧭 Real-World Application Examples
Bank Nifty Levels: Institutions often build positions using weekly options and defend key OI levels.
Nifty50 Zones: Watch for institutional buying during heavy dips or selling into rallies.
Futures Volume: A sudden spike in Bank Nifty Futures + Open Interest jump = Institutional entry.
Option Writers: At resistance zones, call writing increases sharply = probable reversal zone.
🎓 Conclusion
Mastering Institutional Trading is not about getting secret indicators or magic tips. It’s about understanding the market at its core—through price, volume, structure, and behavior of smart money.
Once you learn this, you stop following the herd. You become a confident, calm, data-driven trader who knows how to read the market like a pro.
🔹 Whether you're trading Nifty, Bank Nifty, stocks, or forex – the principles of institutional trading remain the same

Bank Nifty and Nifty50 Scalping TechniquesWhat is Scalping in Index Trading?
Scalping is a high-frequency intraday trading style where a trader looks to capture small price movements multiple times throughout the day. In indices like Nifty50 and Bank Nifty, where price movement is fast and often sharp, scalping is a preferred strategy for many traders.
Scalpers don't aim to catch a ₹100 move. Even ₹20–₹30 on a Bank Nifty option, done 3–4 times a day with volume and discipline, can generate consistent returns.
Why Nifty50 & Bank Nifty for Scalping?
High Liquidity: Tight bid-ask spreads make it easier to enter and exit quickly.
Option Volatility: Options on these indices give quick 5–10% moves in minutes.
Trend & Momentum Friendly: These indices often move in clean intraday trends, giving plenty of scalping chances.
Institutional Interest: Nifty and Bank Nifty are tracked by institutions, so technical levels work well.
Tools Every Scalper Must Use
Before we dive into strategies, make sure you have these ready:
5-Minute / 3-Minute Candlestick Chart
VWAP (Volume Weighted Average Price)
CPR (Central Pivot Range)
Price Action Levels (Previous Day High/Low, Opening Range)
Option Chain Analysis (for OI build-up)
Volume & Momentum Indicators (e.g., RSI, MACD)
Top Scalping Techniques for Nifty & Bank Nifty
1. VWAP Bounce Strategy
Best Time: 9:30 AM to 11:00 AM or 1:30 PM to 3:00 PM
How it works:
Wait for price to test the VWAP line.
If trend is up, and price bounces from VWAP with a bullish candle → enter Call Option.
If trend is down, and price rejects VWAP with bearish candle → enter Put Option.
Entry: On confirmation candle after touching VWAP
Target: 15–25 points on option premium
Stop Loss: 5-minute candle close above/below VWAP
Why it works: Institutions use VWAP for entries; many intraday algos are VWAP-based.
2. CPR Breakout Scalping
Best Time: Opening hour or post-lunch (2:00 PM onwards)
How it works:
If the day’s CPR is narrow, expect trending moves.
Wait for a breakout above CPR high (for long) or below CPR low (for short).
Entry only after a strong 5-minute candle closes outside CPR.
Bonus Tip: Narrow CPR + gap-up = trend day; very scalper-friendly.
Targets: 1:1.5 or trailing stop loss
Risk: High if you trade before confirmation—wait for candle close.
3. Opening Range Breakout (ORB)
Best Time: 9:15 AM – 9:45 AM
How it works:
Mark high and low of first 15 minutes (Opening Range).
Wait for price to break above high or below low with volume.
Ride the momentum for a quick 20–30 point move.
Ideal with: Volume spike + option chain confirmation (OI buildup)
Setup Example:
Bank Nifty breaks above 15-min high, with strong buying in 44,000 CE option → go long.
4. Momentum Scalping with RSI + Candles
How it works:
Use 3-minute chart.
If RSI crosses 60 and a strong green candle forms → go long.
If RSI drops below 40 and red candle forms → go short.
Why this works: Combines price momentum with volume conviction.
Targets: Small, quick moves (10–20 points in Nifty, 20–40 in Bank Nifty options)
Stop Loss: Fixed SL or previous candle high/low
5. Option Chain Scalping – "Smart Money Footprint"
How it works:
Track OI build-up in real-time (especially at ATM or 1-step OTM strikes).
If you see heavy OI build-up + volume spike at 44,000 CE → momentum may build.
Enter on confirmation from price chart (ideally with VWAP or CPR confluence).
Bonus: Combine this with Live Change in OI (many brokers offer this now).
Tools to watch:
Strike Price OI Build-up
IV Rise (Implied Volatility)
Volume on Option Contracts
Important Scalping Do’s & Don'ts
Do’s:
Trade only when price structure + indicator + volume align.
Use limit orders to reduce slippage.
Cut losses fast. Scalping is risk-first.
Have fixed daily targets (e.g., ₹1,500/day)
Trade less when market is choppy
Don’ts:
Don’t chase after big moves already gone.
Don’t increase lot size without system consistency.
Don’t scalp in low volatility phases (e.g., between 12–1:30 PM).
Mindset of a Nifty/Bank Nifty Scalper
You are not a trend trader – you’re a sniper.
Profits come from repetition, not jackpot moves.
You must read the pulse of the market within the first 30 minutes.
No trade > bad trade.
Scalping is about control, discipline, and micro-decisions. Even 3–5 successful trades in a session can result in high accuracy days.
Example Live Scenario (Bank Nifty)
Date: Suppose Bank Nifty opens at 44,000
CPR Range: 43,940–44,060 (tight)
VWAP: At 44,020
Option Chain: 44,000 CE OI increasing rapidly, price trading above VWAP
Setup: CPR breakout + VWAP hold + OI build-up at CE
Trade: Buy 44,000 CE @ ₹120
Target: ₹140–₹160
SL: ₹110
Exit: Within 10–15 mins
Avoid trading just on gut feeling. Use structure.
Conclusion
Scalping in Nifty and Bank Nifty is not gambling—it's calculated, quick decision-making with small but consistent profits. Whether you’re using VWAP, CPR, or live option data, your edge comes from preparation and discipline, not prediction.
If you're just starting, begin with paper trading or small lots, and gradually scale up once your win-rate improves. With time, you'll find the setup that fits your personality best—whether it’s breakout-based, pullback scalping, or OI-driven.
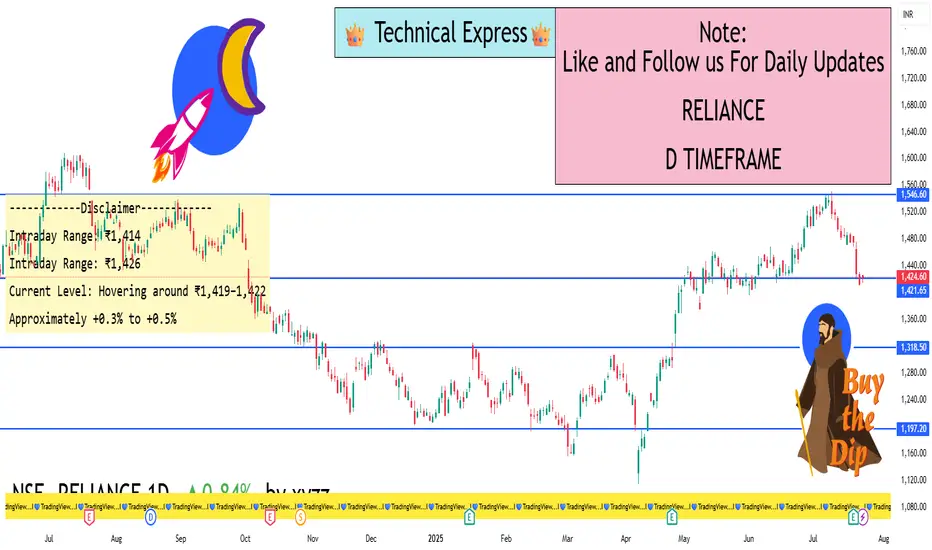
Reliance 1D Timeframe📊 Reliance Industries – Intraday Overview
Previous Close: ₹1,428.6
Opening Price: Opened slightly lower around ₹1,427–₹1,431.
Intraday High: Approximately ₹1,432 during early session.
Intraday Low: Dropped towards ₹1,410 during the mid-session.
Current Trading Price: Trading near ₹1,415, showing around 0.9% to 1% decline from the previous close.
🔍 Key Reasons for Movement Today
Post-Earnings Pressure: After recent earnings, Reliance faced profit booking as some investors booked gains following a previous rally.
Sector Weakness: Energy and telecom segments showed subdued strength while retail remained flat.
Heavy Volume: Trading volume remained above average, suggesting active participation from institutions and retail traders.
📈 Technical Snapshot
Immediate Support Zone: ₹1,410–₹1,412. If this breaks, next support could be near ₹1,400.
Immediate Resistance Zone: ₹1,430–₹1,432. A breakout above this may lead towards ₹1,440–₹1,450.
Trend Positioning: Reliance is currently below its short-term (20-day) moving average, indicating mild short-term weakness but no major breakdown.
💡 Intraday Strategy Levels
Scenario Trigger Point Expected Move
Bullish Reversal Above ₹1,432 Potential upside towards ₹1,445–₹1,450
Neutral/Bearish Between ₹1,410–₹1,430 Consolidation zone with limited moves
Breakdown Risk Below ₹1,410 Could slide to ₹1,400 or even ₹1,390 short-term
✅ Summary Conclusion
Reliance is trading with a mild negative bias, with price action holding between ₹1,410–₹1,432. The overall short-term structure remains weak after intraday profit booking, but key support is holding near ₹1,410. Watch for recovery above ₹1,432 for any bullish reversal or break below ₹1,410 for further downside.
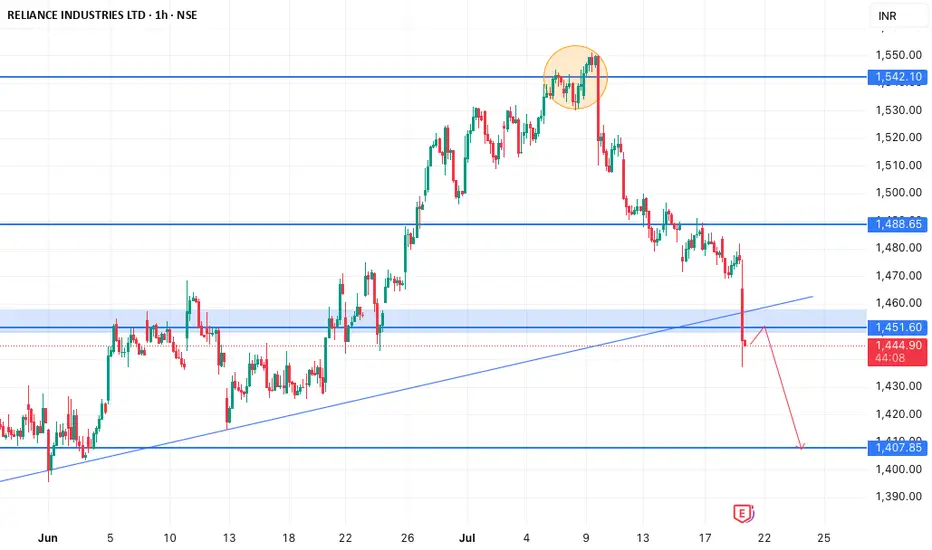
RELIANCE TECHNICAL SHORT BIASLooking forward on a short opportunity, technicals wise on Reliance, aligning with a major trendline breakout on the 4h and a major key level break to the downside. Expect a pullback/correction move to the nearest support-turned resistance level before the final impulse move to the downside.
Learn Institutional Trading Part-6🧠 Who Are the Institutions?
Institutions include:
Hedge Funds
Mutual Funds
Investment Banks
Insurance Companies
Proprietary Trading Firms
They control billions in capital and cannot enter or exit the market like a small trader. Instead, they engineer price movements through smart accumulation, fakeouts, and liquidity manipulation to fill their orders efficiently.
Their goals are not to chase price, but to control it.
🔍 How Do Institutions Trade?
Institutions follow a logical and systematic approach:
Accumulate positions slowly in sideways or quiet markets.
Manipulate price to trap retail traders.
Trigger Liquidity Events (stop-loss hunting, fake breakouts).
Expand price in the true direction.
Distribute their position near highs/lows.
Reverse or Hedge their position when the market shifts.
Let’s go deeper into how to mirror these actions.
📊 Key Concepts to Trade Like Institutions
1. Market Structure Mastery
Institutions move in phases:
Accumulation: Range-bound movement where they quietly build long/short positions.
Manipulation (Fake Moves): Price breaks out and reverses — trapping retail traders.
Expansion: The real move begins after stop-losses are triggered.
Distribution: Institutions slowly exit positions while retail traders enter.
When you trade like institutions, you identify where the market is in these phases and act accordingly.
2. Liquidity Zones
Institutions need liquidity to execute big orders — they look for areas where lots of retail traders place stop-losses or entries.
They often target:
Swing highs/lows
Trendline breaks
Support/resistance levels
Breakout zones
You’ll notice price spikes into these zones, hits stops, and then reverses — this is smart money at work.
🔑 Tip: Don’t trade breakouts blindly — ask “who’s being trapped here?”
3. Order Blocks & Imbalances
An Order Block is the last bullish or bearish candle before a sharp move — representing institutional entry.
Price often returns to these zones to:
Fill remaining orders
Test liquidity
Offer re-entry for institutions
Similarly, Imbalances (Fair Value Gaps) are areas where price moved too quickly, creating a “gap” in buying/selling. These are likely targets for future reversals or pullbacks.
These zones give high probability entries when used with structure and confirmation.
4. Inducement & Manipulation
Before a big move, institutions often induce retail traders into taking the wrong position.
Examples:
False breakout above resistance (induces longs)
Sharp move below support (induces shorts)
Spike in volume, fake news-driven moves
These actions create liquidity that institutions need to enter their real positions. As a smart trader, your job is to recognize the trap and take the opposite side.
5. Risk Management Like a Pro
Institutions never bet the house. Their risk practices include:
Fixed percentage risk per trade (e.g., 0.5%–2%)
Diversified entries
Portfolio hedging (e.g., buying puts, selling covered calls)
Sticking to the strategy, not emotions
To trade like institutions:
Always calculate your risk-reward
Avoid overleveraging
Accept that not every trade wins, but your edge wins over time
6. Use of Data, Not Indicators
Institutions don’t trade off MACD or RSI. They use:
Price Action
Volume
Order Flow
Open Interest
Economic News & Macro Flow
This doesn’t mean you can’t use indicators — but use them as confirmation, not decision-makers. Price is the main truth.

Support and ResistenceWhat is Support?
Support refers to a price level where a downtrend tends to pause or reverse due to increased buying interest. When price drops to a support level, traders and investors see it as a “discounted” price, which attracts buying activity. This buying demand causes the downtrend to slow down or reverse.
Key Points About Support:
It acts as a floor in the market.
Support levels are created when buyers are willing to purchase at a certain price level.
The more times price touches a support level and bounces back, the stronger the support becomes.
Once broken, support can become resistance, meaning that if the price breaks below support, it may face difficulty moving back up past that level.
What is Resistance?
Resistance refers to a price level where an uptrend tends to pause or reverse due to increased selling pressure. When price rises to a resistance level, traders see it as an “expensive” price and tend to sell, causing the price to stall or drop.
Key Points About Resistance:
It acts as a ceiling in the market.
Resistance levels are formed when sellers dominate and prevent the price from moving higher.
The more times price touches resistance and fails to break through, the stronger the resistance is.
If price breaks above resistance, it can become support, known as a support-resistance flip.
Why Support and Resistance are Important
✅ Identifies High-Probability Trade Zones – Helps you spot where to enter and exit trades.
✅ Improves Risk Management – Lets you place stop-loss orders around logical areas.
✅ Confirms Market Direction – Breakouts and rejections from these zones signal potential trend continuations or reversals.
✅ Works Across All Timeframes – Support and resistance can be applied to intraday trading, swing trading, and long-term investing.
Types of Support and Resistance
🔹 Horizontal Levels
Flat, horizontal price areas where the market reverses multiple times. This is the simplest and most common form.
🔹 Dynamic Support and Resistance
Levels that change with price movement, usually identified using moving averages like the 50-day or 200-day MA.
🔹 Trendlines
Diagonal support and resistance lines that connect higher lows in an uptrend or lower highs in a downtrend.
🔹 Zones Instead of Exact Lines
Professional traders focus on zones, not exact price points, because the market often reacts within a range.
How Professionals Use Support and Resistance
Institutions use these levels to accumulate positions quietly.
Smart traders wait for confirmation (candlestick patterns, volume increase) before entering trades.
Breakouts of these levels often lead to big moves because many stop-loss orders are triggered, creating momentum.
False breakouts or liquidity grabs are used by big players to trap retail traders before reversing the market.
Final Thoughts
Understanding support and resistance is fundamental to becoming a successful trader. It helps you anticipate market behavior, manage risk, and trade with confidence. Whether you are a beginner or an experienced trader, continuously refining your ability to identify and trade these key levels will improve your consistency and profitability.
Support and resistance are not just lines on a chart — they are the battle zones where market decisions are made. Master them, and you will master the market.

Geopolitical & US Macro WatchWhat Is Geopolitical & US Macro Watch?
This is a two-part term:
1. Geopolitical Watch
This refers to tracking and analyzing global political situations that can impact trade, oil, currency, defense, or investor confidence. Examples include:
Wars or conflicts (Ukraine-Russia, Israel-Gaza, China-Taiwan)
Global oil sanctions
Strategic alliances (e.g., BRICS+ expansion, NATO decisions)
Diplomatic tensions between countries
These events influence:
Crude oil prices
Foreign exchange rates
FII flows (Foreign Institutional Investment)
Global demand-supply outlooks
2. US Macro Watch
This focuses on tracking economic developments in the United States, the world's largest economy. Key areas to watch include:
Inflation reports (CPI, PCE)
US Federal Reserve interest rate decisions
Jobs data (non-farm payrolls, unemployment rate)
Retail sales, housing starts
US GDP growth
U.S. debt levels and political decisions on trade/tariffs
Because the US dollar is the world's reserve currency, and because Wall Street often sets the tone for global markets, these macro signals directly affect India’s equity market, bond yields, and rupee valuation.
🧠 Why Does This Matter to Indian Traders & Investors?
You may ask—“Why should I care about some news in the U.S. or Europe when I’m only buying shares of Indian companies?”
Here’s the reality:
Over 50% of the daily movement in Indian indices like Nifty and Sensex is now influenced by global cues.
Foreign investors (FIIs), who own a huge portion of Indian stocks, take buy/sell decisions based on global trends, not just local stories.
US interest rates affect where FIIs want to put their money—if US bonds are yielding more, they might pull out of India.
Crude oil, which India imports heavily, is priced globally—if a war breaks out, oil shoots up and hits inflation in India.
In short: What happens outside India often decides how India trades.
🔥 Major Geopolitical Risks in 2025
Let’s look at some real-world developments that have been shaking or supporting markets this year:
1. Russia-Ukraine Conflict (Still Ongoing)
Even in 2025, the war isn’t over.
It affects wheat prices, natural gas, and military spending globally.
India has been balancing ties with both Russia and the West, but disruptions affect commodity markets, logistics, and inflation.
2. Middle East Tensions (Gaza, Iran, Red Sea Attacks)
Ongoing conflicts have kept crude oil prices elevated.
Shipping through the Suez Canal and Red Sea has become riskier, increasing global logistics costs.
This directly affects India’s import bill, trade deficit, and rupee stability.
3. US–China Trade Friction
The US has imposed tech restrictions on China; China is retaliating.
If tensions escalate further, it will impact the global supply chain, especially for semiconductors, electronics, and electric vehicles.
Indian tech companies (like TCS, Wipro) may see ripple effects due to changes in global outsourcing dynamics.
4. Taiwan Risk
Any Chinese military action on Taiwan could be catastrophic for markets, especially in electronics and semiconductors.
Since semiconductors power everything from phones to EVs, even a threat here affects stocks globally.
📊 Key US Macro Trends Impacting Markets in 2025
1. US Inflation is Cooling, But Not Gone
After peaking in 2022, inflation has come down, but in 2025, it’s still sticky.
That means the Federal Reserve (US central bank) is not cutting rates as aggressively as markets hoped.
➡️ When the Fed keeps rates high:
US bond yields rise
FIIs pull money out of emerging markets like India
Nifty and Sensex feel the pressure
2. US Job Market Is Strong
A robust job market signals continued economic expansion, good for global demand.
This is why metals, IT, and manufacturing stocks in India rally when US jobs data is good.
3. The Fed’s Interest Rate Policy
The biggest global event each month is the Fed meeting.
If they cut rates, stocks rally globally.
If they pause or raise rates, money flows into safe assets like gold or the US dollar—hurting Indian equities.
Real-Time Example: July 2025
In July 2025, Indian markets have been:
Rallying due to strong US jobs data and earnings
Cautious due to potential Trump-era tariffs on countries buying Russian oil
Watching closely for US inflation print and Fed meeting signals
GIFT Nifty shows bullish strength in pre-market hours when the US ends green. But we’ve also seen sell-offs on days of oil spikes or war-related news.
🧭 How to Track These Developments (Even If You’re Busy)
Here’s a simple checklist for staying informed:
✅ Every Morning
Check GIFT Nifty
Read major global headlines (US data, oil prices, geopolitics)
Note the USDINR trend
Watch India VIX
✅ Every Week
Look at US job reports, inflation (CPI), and Fed speeches
Follow crude oil and gold charts
Track FII/DII activity
Keep an eye on shipping, metals, and defense-related stocks
✅ Final Thoughts
"Geopolitical & US Macro Watch" is not just a fancy term—it's a crucial lens for today’s markets. The biggest stock market moves often come not from company news but from macroeconomic surprises or global tensions.
In 2025, being globally aware gives you an edge:
You’ll avoid panic on news-driven crashes
You’ll better understand why your portfolio is up or down
You’ll identify trade setups ahead of others
👉 Think global, act local—that’s the new mantra for smart Indian investors.
If you want daily or weekly updates summarizing these events and their impact on Indian markets, let me know—I’ll be happy to prepare a custom watchlist or dashboard for you
LEARN INSTITUTIONAL TRADING✅ What is Institutional Trading?
Institutional trading focuses on understanding how big money flows in the market. Institutions trade in huge quantities, and their strategies revolve around manipulating prices to collect liquidity, triggering stop-losses, and creating false breakouts. Retail traders often lose money because they follow trends without understanding the market structure set by these institutions.
✅ What You Will Learn in Institutional Trading
1. Smart Money Concepts (SMC):
Learn how smart money (institutions) traps retail traders using fake breakouts, stop hunts, and liquidity grabs.
2. Market Structure:
Higher Highs (HH), Higher Lows (HL), Lower Highs (LH), Lower Lows (LL)
Break of Structure (BOS) and Change of Character (CHOCH)
This helps you predict market direction with logic, not emotions.
3. Order Blocks:
These are zones where institutions place large orders. You’ll learn how to identify them and trade with the big players.
4. Liquidity Pools:
Find out where stop-losses and pending orders are sitting in the market so you can trade smartly by targeting liquidity zones.
5. Entry & Exit Strategies:
Master high-probability entry techniques and learn proper risk management like institutional traders.
✅ Why Learn Institutional Trading?
Retail Trading Institutional Trading
Random entries Planned entries based on logic
Easily manipulated Trades follow the footprint of big players
Low win rate Higher win rate with patience
Emotional trading Rule-based, stress-free trading
✅ Benefits of Mastering Institutional Trading
🎯 Accurate Trades – Follow the market makers.
💸 Better Risk-Reward – Small stop-loss, bigger targets.
⏰ Trade Less, Earn More – No overtrading, only quality setups.
🧠 No Indicators Needed – Pure price action and market reading.
✅ Who Can Learn Institutional Trading?
✅ Beginners who want to start right.
✅ Retail traders who keep losing.
✅ Part-time traders looking for consistency.
✅ Anyone serious about becoming a profitable trader.
✅ Final Words:
Institutional trading teaches you how to trade with the smart money instead of against it. Once you master these strategies, you will understand market moves like a professional and make more consistent profits

RIDE THE BIG MOVESWhat Does “Ride the Big Moves” Mean?
It means:
✅ Spotting a strong directional move early
✅ Entering with confirmation and confidence
✅ Managing your risk while maximizing reward
✅ Staying in the trade through minor pullbacks
✅ Exiting smartly at a major trend exhaustion point
Most traders cut winners early and let losers run. This approach flips that pattern — teaching you how to stay in profitable trades and compound gains.
🧠 Core Concepts You’ll Learn
1. Trend Identification
Learn how to identify:
Primary trends (uptrend/downtrend)
Pullbacks vs. reversals
Trend strength using price action and volume
Higher-timeframe confirmation
2. Entry Techniques for Big Moves
Breakout from consolidation
Trendline and moving average support
SMC-based entries: Order blocks & market structure shifts
Avoiding fakeouts with volume and time confirmation
3. Stay in the Move
How to manage fear during winning trades
Trailing stop techniques: MA trail, swing low method, ATR
Adding to positions safely in trending markets
Avoiding premature exits caused by emotions
4. Exit Like a Pro
Identifying exhaustion signals
Divergences, volume drops, or climax candles
Scaling out profits strategically
Avoiding full exit too early — ride until structure breaks
📊 Why Big Moves Matter
Let’s say your risk is ₹1,000 per trade.
In a scalp, you might make ₹1,500.
In a small swing, maybe ₹3,000.
But if you ride a big move, your reward could be ₹10,000 or more — with the same risk.
That’s the power of risk-reward optimization — where one big move can cover multiple small losses and lift your win ratio significantly.
👨🏫 Who Should Learn This?
Intraday and swing traders
Option buyers looking for momentum moves
Long-term investors who want better timing
Anyone tired of small profits and early exits
✅ What You’ll Achieve:
Learn to identify market momentum early
Improve patience and discipline
Build strategies that favor 1:5 or even 1:10 risk-reward setups
Confidence to hold winners without panic
Eliminate noise and trade with clarity
⚡ Start Riding Waves, Not Ripples
“Ride the Big Moves” is more than a strategy — it's a mindset shift. It teaches you how to think like professionals who don’t chase trades, but wait for the market to offer big, clean opportunities — then ride them with focus and control

Banking & Financial Sector Near All-Time High in 2025 What Is the BFSI Sector?
BFSI stands for Banking, Financial Services, and Insurance. It includes:
Private and public sector banks (HDFC Bank, ICICI Bank, SBI, etc.)
NBFCs (Non-Banking Financial Companies) like Bajaj Finance, M&M Finance
Insurance companies like LIC, HDFC Life
Financial service firms like HDFC Ltd (pre-merger), IIFL, and brokers
Together, these companies form the backbone of India’s economy, handling everything from loans, credit cards, mutual funds, and insurance to rural financing and digital banking.
Current Market Position (July 2025)
Bank Nifty is trading above 54,000 – just below its all-time high of around 54,500+
Nifty Financial Services index is also hovering near its peak, led by strong performances from key stocks.
This means:
Banking stocks are leading the overall market rally.
Big money — from FIIs, mutual funds, and even retail — is flowing into BFSI.
Investors believe the sector will outperform in the upcoming quarters.
Why Is the Banking Sector So Strong Right Now?
1. Strong Earnings Growth
Most banks reported record profits in Q1 FY26
Examples:
HDFC Bank and ICICI Bank: Strong credit growth and low NPAs
SBI: Continued momentum in retail and agri-loans
Banks are making more money from both lending and investment services.
2. Improved Asset Quality (Low NPAs)
NPA = Non-Performing Asset (a loan that’s not being repaid)
In 2020–21, NPAs were a huge issue due to COVID.
Now in 2025, NPAs are at multi-year lows.
Better risk management + tech-based collections = fewer defaults.
This has improved investor confidence in banks.
3. Credit Demand Is Booming
India’s economy is growing at 7%+ GDP.
People are borrowing more:
For homes, education, business, and consumption
Corporates are also taking loans for:
Expansion, capex, and mergers
More loans = more interest income = better profits for banks and NBFCs.
4. Digital Banking Explosion
UPI, online lending, digital onboarding = huge cost savings
Banks like Kotak, ICICI, and SBI have aggressively expanded digital operations
NBFCs like Bajaj Finance and Paytm (financial arm) are leveraging tech to reach small towns
This is creating massive scale and reach with low overhead costs.
5. FII & DII Buying in Banking
Foreign Institutional Investors (FIIs) have returned in 2025
They prefer BFSI because it offers:
Liquidity
Consistent profits
Strong management
Domestic funds (DIIs and mutual funds) are also overweight on banking because it remains a core component of India’s growth engine.
Key Stocks Driving the Rally
🏛️ Private Banks
Stock Strength Points
HDFC Bank Post-merger synergy, retail + wholesale growth
ICICI Bank Best-in-class digital, strong balance sheet
Axis Bank Loan growth, improving CASA, strong NIM
Kotak Bank Conservative but profitable, strong capital base
IndusInd Bank Retail comeback, strong rural reach
🏦 Public Sector Banks (PSBs)
Stock Strength Points
SBI India’s biggest bank, strong rural and retail
Bank of Baroda Re-rating play, improved asset quality
Canara Bank PSU momentum + rising profitability
💳 NBFCs & Financial Services
Stock Focus Area
Bajaj Finance Consumer lending, digital
M&M Financial Rural auto + tractor finance
IIFL Finance Gold loan, home loan
🛡️ Insurance & AMC Stocks
Stock Focus
HDFC Life Long-term savings + insurance
SBI Life Market-linked insurance growth
LIC Recovery play post-IPO
Technical Picture: Bank Nifty (as of July 2025)
Resistance: 54,500 (All-time high zone)
Support levels: 53,300 and 52,700
Trend: Bullish (price above 20, 50, 200 EMA)
Volume: Rising, especially in HDFC, Axis, and SBI
Technical traders expect:
A breakout above 54,500 could take Bank Nifty to 56,000–57,000
A rejection might lead to healthy pullbacks before the next leg
What Traders Should Do
Intraday/Options Traders:
Focus on Bank Nifty index options on weekly expiry days (especially Thursdays)
Watch for breakout levels and OI build-up
Popular strategies:
Straddle at key resistance
Bull call spreads after breakout
Momentum scalping on ICICI, Axis, SBI
📆 Swing Traders:
Look for range breakouts on daily/weekly charts
Example: Entry on Axis Bank above ₹1,200 with SL at ₹1,160
Hold for 5–10% swing moves
🧾 What Long-Term Investors Should Do
✅ Continue SIPs in BFSI Mutual Funds
Most mutual funds (like SBI Bluechip, Axis Banking ETF) have high exposure to HDFC, ICICI, SBI, etc.
These are long-term wealth builders.
✅ Buy on Dips
If stocks fall 5–10% due to market-wide correction — it's often a buying opportunity, not panic time
Example: HDFC Bank falling from ₹1,800 to ₹1,650 is often bought by institutions
✅ Diversify within BFSI
Mix large-cap banks, PSU turnaround stories, and NBFCs for better returns with less risk
❌ Risks to Be Aware Of
Even though things look great, no rally comes without risks:
Risk Impact
Global Recession Could reduce FII flow
Rate Hikes (Globally) May reduce credit demand
Political Uncertainty 2026 elections might cause volatility
Asset Quality Shock If any hidden NPAs come up
Overvaluation in Mid NBFCs Some stocks may be overheated
💬 Expert Views
Most brokerage houses like ICICI Direct, Kotak Securities, and Motilal Oswal have bullish ratings on top banks.
They expect 10–15% upside in BFSI stocks over the next 6–12 months.
Morgan Stanley and Goldman Sachs are overweight on India’s banking sector in their Asia portfolio.
✍️ Final Thoughts
The Banking and Financial sector in India is booming for all the right reasons:
Strong economy
Clean books
Digital transformation
Massive credit demand
If you’re a trader — this sector offers great volatility and opportunity.
If you’re a long-term investor — this is where India’s structural growth is most visible.

Ooooo! What do we have here? #Reliance If we look at Reliance, we can see how beautiful and synced the counting may look and feel. Can it become the reason for some good news in Nifty? Fingers Crossed!!

RELIANCE INDUSTRIES - BIG BREAKOUTRELIANCE INDUSTRIES
Big massive breakout above 1425 and support at 1400-1380.
It can be market leader for few days.
Realistic targets will be 1530/1550/1575 ( Previous resistance )
Market seems to be on bullish side and large caps can be deciding the trend.
#swingtrades
#largecaps
#priceaction
#trendline

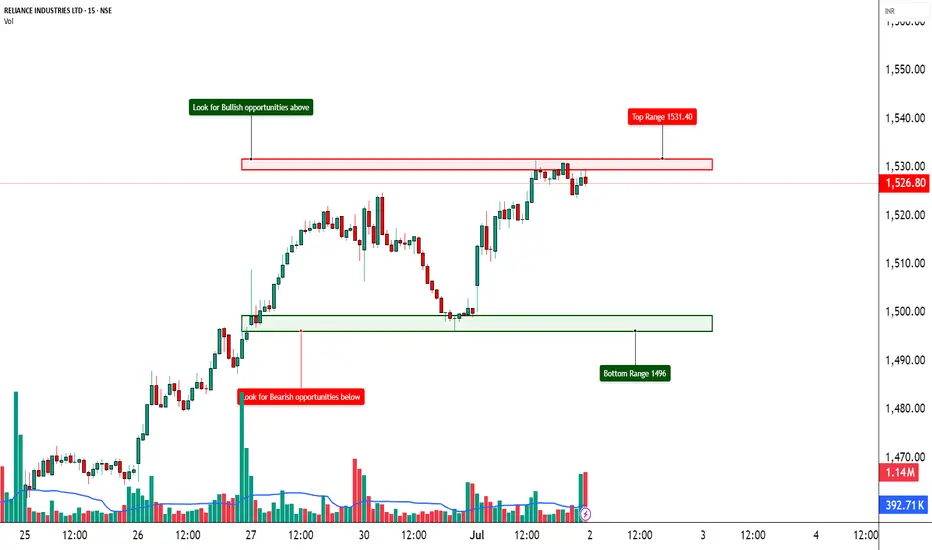
RELIANCE – Trapped Between Strikes📈 RELIANCE – Trapped Between Strikes | Option Chain + Price Action Insights
🕒 Chart Type: 15-Minute
📆 Date: July 3, 2025
________________________________________
🔍 What’s Catching Our Eye:
RELIANCE is hovering just above ₹1,517.8 and facing resistance from rising short positions on Calls across 1540–1580 levels. Despite minor short covering at the 1500 and 1520 CEs, fresh Short Build-Up is visible across most strikes, suggesting upward moves are being capped. On the flip side, Puts between 1500–1530 are also witnessing Short Build-Up, indicating traders aren't expecting a major breakdown either.
________________________________________
📌 What We’re Watching For:
RELIANCE appears range-bound, and clear directional strength is missing. Price needs to decisively break above ₹1,540 for bullish strength to materialize. On the downside, support exists around ₹1,500, but if that breaks, expect pressure to mount quickly.
________________________________________
📊 Volume Footprint:
Heavy volume on both sides:
• 13k+ contracts at 1520 CE
• 11k+ contracts at 1600 CE
• Over 9k contracts traded at 1500–1530 PE
→ Traders are actively betting on both sides, suggesting volatility ahead.
________________________________________
📈 Option Chain Highlights:
• Call Side:
o 1530 CE → Long Build-Up (+2.45% OI)
o 1540 CE → Long Build-Up (+2.45%)
o 1550–1580 CE → Short Build-Up, signaling resistance buildup
o 1520 CE → Short Covering
• Put Side:
o 1500–1530 PE → Short Build-Up, hinting at base support around 1500
Inference: The tug-of-war is real. Calls are being written at higher strikes while Puts are being sold at lower strikes. That creates a tight range of ₹1,500–1,540, with traders unsure of breakout direction.
________________________________________
🔁 Trend Bias:
🟡 Neutral to Slightly Bullish – Only if ₹1,540 is reclaimed with volume
________________________________________
🧠 Trade Logic / Reasoning:
Price is squeezed between the ₹1,500 Put writers and ₹1,540+ Call writers. This is a textbook “compression zone” where a breakout or breakdown may soon follow. If bulls want control, they must push above ₹1,540 with volume and follow-through. Else, expect the sideways to weak bias to continue.
________________________________________
📍 Important Levels to Mark:
🔺 Top Range (Resistance): ₹1,540 – Break & sustain needed for upside
🔻 Bottom Range (Support): ₹1,500 – Breakdown will shift sentiment bearish
________________________________________
🎯 Trade Plan (Educational Purpose Only):
✅ Best Buy (Equity): Only above ₹1,540 with confirmation
✅ Best Sell (Equity): If price breaks below ₹1,500
✅ Best CE to Long: 1530 CE – Strong long build-up with good delta
✅ Best PE to Long: Avoid – PE sellers still active; no breakdown confirmed
🟢 Demand Zone: NA
🔴 Supply Zone: NA
⚠️ Invalidation Below:
Bullish view invalid if price fails at ₹1,540 or slips below ₹1,500 with volume
________________________________________
⚠️ Disclaimer:
This analysis is for educational purposes only.
STWP is not a SEBI-registered advisor.
No buy/sell recommendations are made.
Please consult your financial advisor before trading.
STWP is not responsible for any trading decisions based on this content.
________________________________________
💬 Found this helpful?
Drop your feedback in the comments ⬇️
🔁 Share with traders who track RELIANCE
✅ Follow STWP for consistent zone + option chain insights
🚀 Let’s trade smart, with patience and clarity!

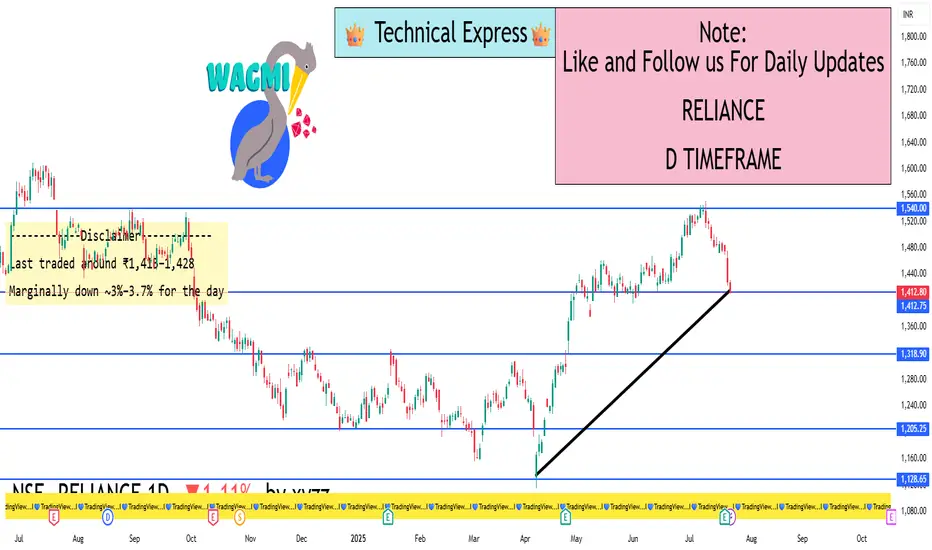
Reliance Industries Ltd : Bullish Flag breakout 🔍 Pattern Analysis
The chart shows a bullish flag pattern — characterized by a sharp upward move (flagpole in April) followed by a sideways consolidation within a tight horizontal range through May to early July.
Price has held steady between approximately ₹1,470 and ₹1,520, indicating strong consolidation near highs.
A breakout above ₹1,520 with volume would confirm continuation of the uptrend.
🔑 Key Technical Levels
Resistance Zone: ₹1,520–₹1,532 (upper boundary of flag)
Support Zone: ₹1,470–₹1,440 (lower range of flag)
Flagpole Range: ₹1,100 to ₹1,520 (~₹420)
📈 Trend Outlook
Short-Term: Consolidation with a bullish bias
Medium-Term: Breakout above ₹1,532 can lead to an extended rally toward ₹1,940–₹1,950 (using flagpole projection)
📌 Trading Implication
Bullish Scenario: Breakout above ₹1,532 with volume → potential target = ₹1,950
Bearish Risk: Breakdown below ₹1,440 may invalidate the pattern
⚠️ Disclaimer
This analysis is intended for educational purposes only and does not constitute financial advice. Investing in the stock market involves risk. Please consult a qualified financial advisor before making investment decisions.

RELIANCE – Short Covering Fueling a Reversal?📈 RELIANCE – Short Covering Fueling a Reversal?
🔍 Heavy Action Across 1500–1570 CEs | Bullish Reversal on the Cards?
Chart Type: 15-min / 1H / Daily
Indicators: STWP Zones, Option Chain Activity, Volume Clusters, Demand-Supply
🔹 What’s Catching Our Eye?
✅ Aggressive Long Build-Up across multiple CEs (1550–1580)
✅ Massive Short Covering on 1500–1530 Calls – Bears exiting fast
✅ Huge OI Additions at 1550, 1560, 1570 CEs – Smart money positioning ahead?
✅ Put Writers Building Base at 1500–1520 PE → Strong support developing
✅ Spot Price at ₹1528.4 – Right at the heart of breakout zone
✅ IVs remain in control (~15.9–16.3%) = room for expansion
📊 What We’re Watching for:
📍 Breakout Zone: 1530–1540
📍 Targets: 1560 → 1580 → 1600
📍 Invalidation Below: 1490
📍 Momentum Confirmation: Price closing above 1540 with volume & OI spike
📍 Option Chain Support: 1500 PE (OI: 29.3L) + short build-up in multiple puts
📌 Trade Plan (Educational Purpose Only):
🔹 Bullish Idea: Buy above 1530–1540 with SL below 1490
🔹 Options Play: 1550 or 1560 CE suitable for short-term directional trades
🔹 Positional Angle: Momentum may sustain toward 1600 if 1540 holds
⚠️ Disclaimer:
This post is for educational and learning purposes only.
It does not constitute buy/sell advice or investment recommendation.
Always consult your financial advisor before taking any positions.
STWP is not liable for any financial decisions based on this content.
📚 “When bears cover in panic, bulls prepare their charge.”
💬 What’s your take on Reliance? Is 1600 on the radar, or is this just a squeeze?
Wyckoff Accumulation Schematic Explained - Reliance IndustriesThe Wyckoff Method is a time-tested framework that helps traders understand how smart money accumulates shares before a major price rally. Let’s break down the key events using the marked chart of Reliance Industries Limited.
📉 Phase A – Stopping the Downtrend
1. PS (Preliminary Support):
This is where big players start showing interest after a long downtrend. You’ll notice volume picks up and the price starts slowing its fall.
➤ On the chart: PS shows the first signs of buyers stepping in.
2. SC (Selling Climax):
Panic selling reaches its peak. Weak hands exit, and professionals absorb the supply. A sharp bounce follows.
➤ Big red candle with huge volume followed by a reversal – classic SC behavior.
3. AR (Automatic Rally):
With selling exhausted, the price bounces up sharply. This defines the top of the trading range.
➤ You can see this strong bounce right after the SC.
4. ST (Secondary Test):
Price comes back to test the SC zone to check if selling pressure is still strong. Low volume here means the worst is over.
➤ ST on the chart dips near the SC area but doesn’t break it with force.
🌊 Phase B – Building the Cause (Sideways Movement)
This is where the stock moves sideways within a range. Institutions quietly accumulate more without alerting the market.
5. Creek:
A resistance trendline formed by the highs within the trading range. The price will eventually need to “jump the creek” to show strength.
➤ In the chart, the Creek forms a ceiling for price action.
🌱 Phase C – Testing the Market (Spring Time)
6. Spring / Shakeout:
A fake breakdown below support to trap weak hands. Smart money uses this dip to accumulate more.
➤ Two Springs are marked on the chart, with Spring 2 acting as the final test with low volume.
🚀 Phase D – The Markup Begins
7. JAC (Jump Across the Creek):
Price breaks through the Creek with strong volume and wide candles.
➤ Shown by the steep breakout after Spring 2.
8. SOS (Sign of Strength):
Price rises rapidly with strong volume. Confidence builds among traders.
➤ Seen as a clear upward rally with big green candles.
9. LPS (Last Point of Support):
Price pulls back slightly to test old resistance (now support) with lower volume.
➤ Seen as a mild dip after the SOS.
📈 Phase E – Price Markup
This is where the real trend begins. A series of higher highs and higher lows confirm that smart money has finished accumulating, and the public starts entering.
➤ The current uptrend with bullish candles and strong momentum reflects Phase E.
✅ Summary (In Simple Words)
Preliminary Support (PS): This is the first area where we see signs of buying after a strong downtrend. It indicates that some large players might be stepping in quietly.
Selling Climax (SC): This is the panic point. The price falls sharply, and retail investors sell in fear. But this is where professionals start buying aggressively.
Automatic Rally (AR): With the panic selling done, price bounces up quickly. This bounce sets the top boundary of the trading range.
Secondary Test (ST): Price comes back down to test the SC zone. If the volume is lower and price doesn’t fall much, it confirms that selling pressure has reduced.
Spring or Shakeout: A fake breakdown below the bottom of the range. It shakes out weak hands and gives professionals a chance to buy more at lower prices.
Sign of Strength (SOS): A strong breakout above resistance, with wide price bars and good volume. This shows that demand is now in control.
Last Point of Support (LPS): A pullback after SOS, where price retests the breakout level but on low volume. This is a low-risk entry point for long positions.
Many times exact labeling is difficult, so a trader should focus more on underlying concept instead of labeling.
🧠 Key Takeaway
This schematic shows how big players accumulate quietly before driving prices higher. Recognizing this pattern early can give traders a major edge in identifying low-risk, high-reward trades.
This post is a tutorial and not a trading advise.

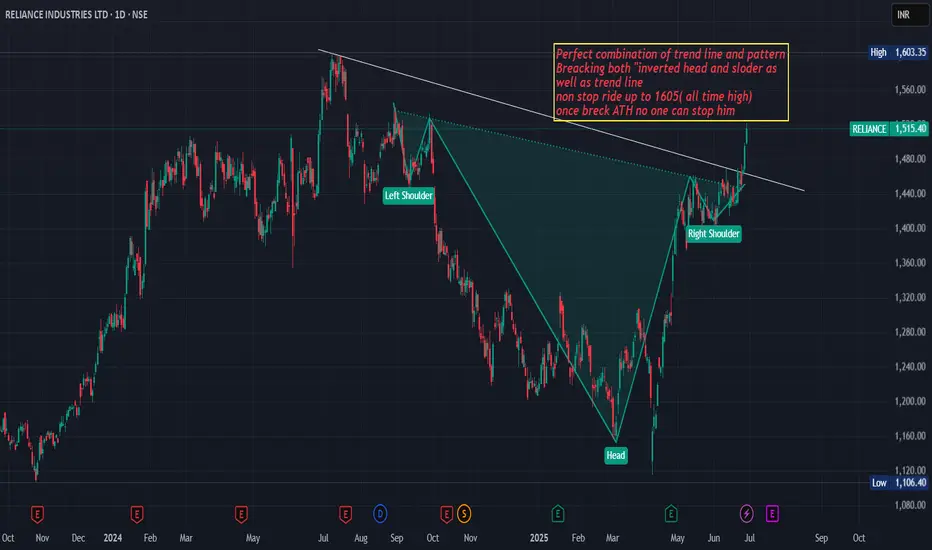
Realiance ind .Set to make now all time highPerfect combination of trend line and pattern
Breacking both "inverted head and sloder as
well as trend line
nonstop ride up to 1605(all time high)
once breck ATH no one can stop him
Reliance Long _ Bullish FlagReliance Long:
Breakout from Bullish Flag with decent volume.
tomorrow might be a pull back. Watch this space.
Enter long only when the price is favorable in the
lower timeframe

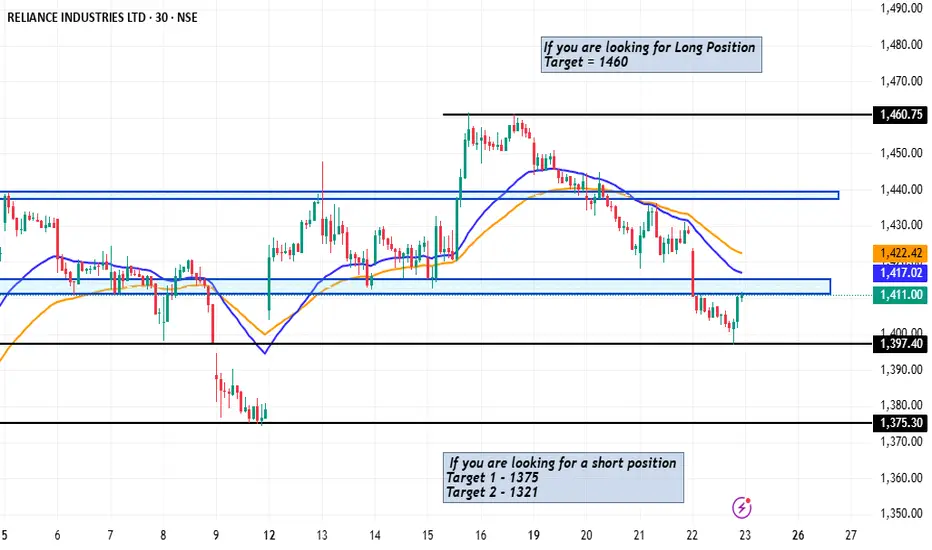
Reliance Industries View Both Long and Short positionHey Trader's and Investor's
Look the Pattern seen in Reliance Industries Here are some Chart pattern i share with you all guys
Note : I am not a SEBI Registered .. Please plan a trade or Investment based on your research and knowledge
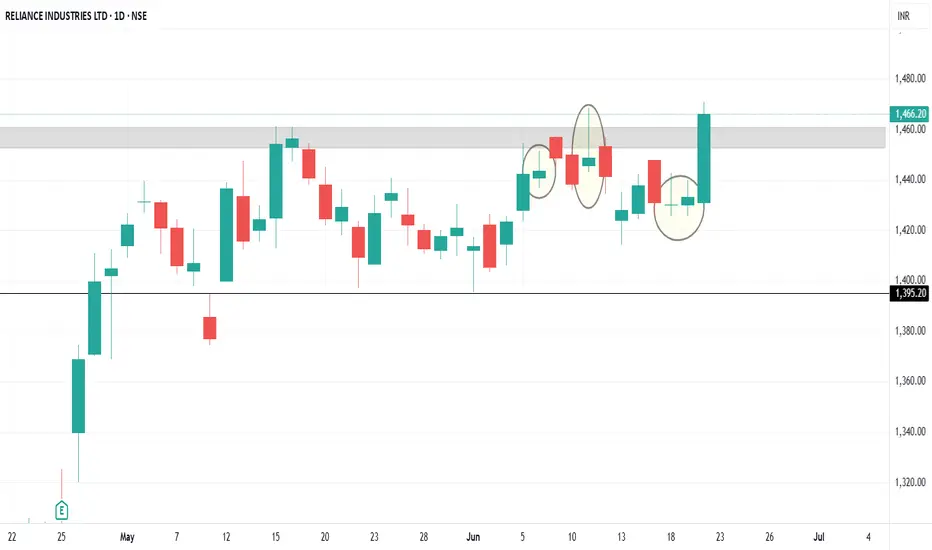
Reliance bearishReliance 1450 has completed distribution and has turned bearish.
We expect it will drop to 1421,1398,1305 in coming days.

Reliance Breakout or FakeReliance 1466 though showing breakout in charts ,we believe it could be a fake.
In last 3 attempts buyers interest was very much weak.
So To trap the call writers and left over weak buyers SM could have carried the last friday move. Few more attempts may be carried to wash out completely the weak buyers and the price will then drop to 1439.