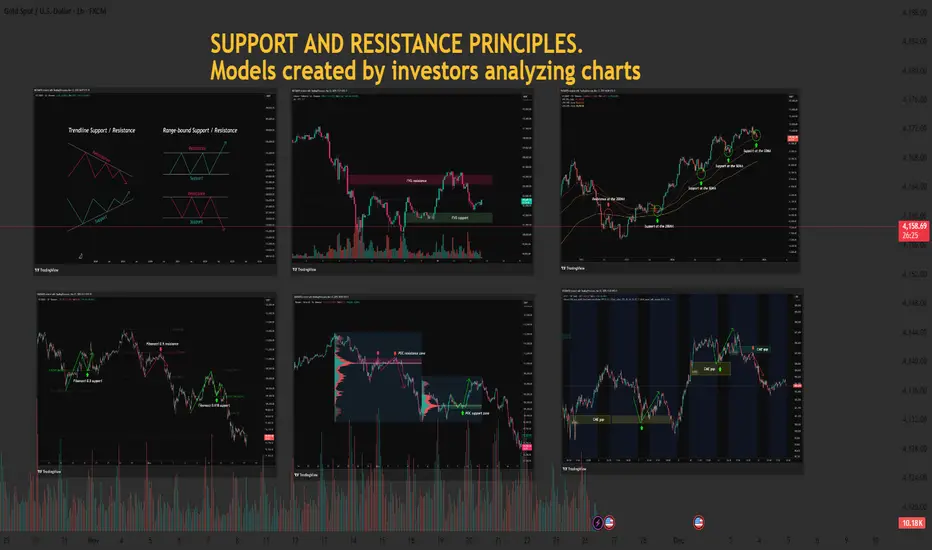
Essential Guide to Support and Resistance 1️⃣ The Importance of Support and Resistance in the Highly Volatile Crypto Market
- The cryptocurrency market operates 24/7/365 and shows significantly higher volatility than traditional financial markets. This volatility creates exceptional profit opportunities but also triggers intense fear and greed, placing substantial psychological pressure on traders.
- Support and resistance act as critical reference points within this chaos, highlighting areas where price is likely to react. Beyond technical analysis, they reflect the collective psychology of traders. Understanding them is essential for long-term success in crypto trading.
2️⃣ The Nature of Support and Resistance and Their Psychological Foundation
Support and resistance form where buying and selling pressures clash strongly enough to slow down or halt price movement.
Support:
At this level, buyers perceive the asset as “cheap enough” and are willing to enter, forming a psychological and structural barrier against further decline. Traders previously stuck in losing positions may sell at breakeven, adding layered reactions around these levels.
Resistance:
At this level, sellers believe the asset is “expensive enough” and reduce exposure, while trapped traders near the top may sell with a “better late than never” mentality, limiting further upward movement.
※ The Meaning of Breakouts and Fakeouts
- When support breaks, active buyers may panic and trigger stop-loss selling. Conversely, breaking resistance often invites aggressive buyers, accelerating the trend.
- However, many breakouts turn into fakeouts, designed to exploit trader psychology. Avoid jumping in too early without confirmation.
3️⃣ Key Support and Resistance Models Explained
📈 Trendlines & Accumulation Zones: Market Structure and Trader Expectations
- Trendlines visually represent collective expectations of future price direction.
- Touching an uptrend line triggers “buy the dip” psychology.
- Touching a downtrend line reinforces the belief that price “cannot move higher.”
- Accumulation Boxes mark areas where buying and selling pressures stabilize. Traders plan around these zones, driven by the mindset of “waiting for the breakout” to catch meaningful moves.
drive.google.com
📈 FVG (Fair Value Gap): Market Inefficiency & Smart Money Footprints
An FVG forms when price moves too quickly through a zone, leaving an unfilled “price gap.” These gaps often represent sudden activity from Smart Money (institutions, whales).
Gap Filling:
Markets naturally avoid leaving inefficiencies unresolved. When price returns to an FVG, the entities responsible for the original move may adjust or reopen positions, creating support or resistance.
Newer traders can observe FVGs as footprints of Smart Money and plan reactions accordingly.
drive.google.com
📈 Moving Averages (MA): Collective Sentiment & Trend Direction
MAs reflect the average price the market perceives over time. Because MAs are widely monitored, they naturally form psychological support and resistance.
Short-term MA (e.g., 50MA): Tracks short-term sentiment.
Price below → worry about trend weakening.
Price above → renewed optimism.
Long-term MA (e.g., 200MA): Represents long-term sentiment.
Price below 200MA → fear of prolonged downtrend.
Price above 200MA → hope for sustained bullishness.
When acting as support/resistance, MAs reflect strong collective agreement.
drive.google.com
📈 POC (Point of Control) – Volume Profile: Market Consensus & Volume Strength
POC is the price level with the highest trading volume within a given range — the market’s strongest consensus level.
Price below POC:
POC becomes strong resistance.
Buyers stuck in losing positions may sell at breakeven, strengthening resistance.
Price above POC:
POC turns into solid support.
Buyers believe price should not fall below this level.
POC often reflects the market’s “expected value” and the area where loss-aversion psychology is strongest.
drive.google.com
📈 Fibonacci: Natural Order & Human Expectations
- Fibonacci retracement applies golden ratio mathematics to charts, reflecting where traders expect reversals and forming support/resistance.
- These levels work not by magic but because many traders plan trades around them — collective behavior creates real reactions.
- Levels like 0.5 and 0.618 carry psychological significance, often seen as optimal buying or selling opportunities.
drive.google.com
📈 CME Gap: Institutional Movement & Mean Reversion Behavior
CME gaps occur in Bitcoin futures due to institutional trading hours. When spot price moves over the weekend while futures are closed, gaps form.
Gap Filling:
These gaps represent time periods without institutional activity, encouraging the market to “normalize” abnormal price areas.
Traders commonly expect gaps to be filled eventually, turning them into potential support/resistance zones.
drive.google.com
4️⃣ Managing Trading Psychology Through Support and Resistance
Even the best tools are useless without psychological discipline.
Confirmation Bias & Stop-Loss Discipline
- Ignoring losses due to selective perception leads to failure.
- When support breaks, accept the invalidation and exit decisively.
Overbought/Oversold Psychology & FOMO
- Avoid chasing price upward out of fear of missing out.
- In crashes, resist panic-selling at the bottom.
- Rely on your structured support/resistance rules.
Scaling Into Trades
- Avoid buying everything at one support level—or selling everything at one resistance level.
- Scaling entries across multiple levels increases psychological stability and reduces the impact of misjudgment.
5️⃣ Building a Complete Strategy & Practical Application Tips
Confluence Creates Strongest Levels
When multiple support/resistance signals overlap
(e.g., Fibonacci 0.618 + 200MA + POC + FVG),
these zones become significantly stronger because they reflect collective trader agreement.
Volume Confirms Support/Resistance Strength
High volume validates a level's importance.
A reliable breakout requires strong volume, showing clear market participation and intent.
Develop Your Own Trading Plan
Do not follow every model blindly.
Choose indicators and methods that fit your style, and create clear trading rules.
Discipline with your own system leads to psychological stability and long-term success.
Don’t forget to like and share your thoughts in the comments! ❤️
Trade ideas
xauusd has seeped swing lowprice has seeped swing low, although structure on 15m if bearish but price has seeped low and give us engulfing candle+fvg, so entering here is good idea, sl woud be at $4040.080 and tp would be at $4069.500. price can face resistance at 4058.300, but if it breaks this zone and manages to close above $4069.300, it can blast upside. OANDA:XAUUSD

Gold Trading Strategy for 26th November 2025✨ GOLD TRADING PLAN – INTRADAY LEVELS ✨
(Well-structured, step-by-step, visually segmented with icons & dollars as requested)
🟢 BUY SETUP – LONG POSITION
📍 Entry Condition:
Buy ONLY IF price breaks & closes above the High of the 1-Hour Candle = $4154+
📌 Clear Trade Logic:
Breaking the previous hour high indicates bullish strength & momentum. A candle close above confirms continuation and reduces false breakout probability.
🎯 Targets for Upside Movement:
Target No. Price Level
🎯 T1 $4168
🎯 T2 $4185
🎯 T3 $4199
🔒 Recommended Stop Loss (SL):
Below previous 1-hour support zone OR below breakout candle low
(This protects against fake breakouts)
🔻 SELL SETUP – SHORT POSITION
📍 Entry Condition:
Sell ONLY IF price breaks & closes below the Low of the 30-Minute Candle = $4106-
📌 Clear Trade Logic:
Break of intra-day support signals bearish pressure. A candle close confirms sellers are dominant and validates the downside.
🎯 Targets for Downside Movement:
Target No. Price Level
🎯 T1 $4090
🎯 T2 $4078
🎯 T3 $4060
🔒 Recommended Stop Loss (SL):
Above breakout retracement zone OR 30-min rejection high.
🧠 Trade Execution Notes (Very Important)
✔ Wait for candle close confirmation, not just wick breakout.
✔ Use proper risk-reward ratio (1:2 or better).
✔ Avoid overleverage & follow strict SL discipline.
✔ Volume confirmation strengthens signals.
✔ Check news & volatility (US data, Fed, Dollar index) 📊
⚠ DISCLAIMER (Mandatory)
This is not financial or investment advice. Levels are shared for educational & chart-analysis purpose only.
Trading in Gold/Commodities involves high market risk — decisions must be based on personal judgment, risk capacity & research.
The user is fully responsible for their trades.

Gold XAUUSD – Fresh Resistance Tested Twice, Bears Eye 4057 PullGold gave us a clean reaction today, rejecting the 4107–4110 supply zone not once, but twice. That double tap reinforced a fresh resistance band at 4087–4095, where sellers stepped back in with intention.
As long as 4012 holds on the upside, this resistance zone remains my short-term line in the sand. Any push back into 4087–4095 may attract renewed selling pressure, keeping the door open for a move toward 4057, with momentum potentially extending lower if sellers stay in control.
I’ll be watching how price behaves on each revisit—structure remains king.
Your feedback drives our content and keeps everyone trading smarter. Let’s make those pips together! 🚀
Happy Trading,
– The InvestPro Team

Swing Trading Secrets1. The Secret of Trend Recognition
The biggest secret of profitable swing trading is identifying the dominant trend of the market. Most novices try to pick tops and bottoms, but professionals follow the path of least resistance. Trend recognition means:
Uptrend: Higher highs (HH) + higher lows (HL)
Downtrend: Lower highs (LH) + lower lows (LL)
Range: Price oscillates between support and resistance
Swing traders do not predict; they react. They align trades with the existing trend.
For example:
In an uptrend, they wait for pullbacks to key levels.
In a downtrend, they short the rallies.
In a range, they buy at support and sell at resistance.
Knowing the trend keeps traders on the right side of probability.
2. The Secret of Patience and Timing
Effective swing traders don’t enter randomly. They wait for specific conditions:
A. The market must be near a key level
Trendline touch
Moving average support (e.g., 20-EMA, 50-EMA)
Fibonacci retracement (38.2%, 50%, 61.8%)
Previous swing high/low
Volume clusters
B. Price must confirm the reversal or continuation
Patience allows the market to “show its hand” before entering.
The secret: wait for the candle close, not the candle forming.
Many traders lose because they enter too early. Timing matters more than direction.
3. The Secret of Multi-Timeframe Confluence
Professional swing traders use multiple timeframes:
Higher timeframe (HTF): 1-week or 1-day → Trend direction
Trading timeframe (TTF): 4-hour or 1-day → Entry zones
Lower timeframe (LTF): 1-hour or 15-min → Entry trigger refinement
This is called top-down analysis.
If the weekly chart shows an uptrend, the daily chart shows a pullback, and the 4-hour chart shows a bullish reversal pattern, the probability of success becomes extremely strong.
Multi-timeframe alignment is a powerful edge.
4. The Secret of High-Probability Patterns
Swing traders rely on chart patterns—not lots of patterns, just a handful of powerful ones that repeat reliably.
A. Continuation Patterns
Bull flag
Bear flag
Ascending triangle
Descending channel
These indicate that the trend is likely to continue.
B. Reversal Patterns
Double top / double bottom
Head and shoulders
Morning star / evening star
Hammer / shooting star
C. Breakout Patterns
Cup and handle
Range breakout
Consolidation breakout
Professional traders focus on clean patterns. If the pattern is messy, overlapping, or unclear, they move on.
5. The Secret of Volume Analysis
Price shows direction; volume shows conviction.
High-probability swing trades usually show:
High volume on breakouts
Low volume on pullbacks
High volume on reversal candles
Volume spikes at support/resistance
Volume acts like a lie detector. If a breakout happens on weak volume, it is often a trap.
Understanding volume helps traders avoid false signals.
6. The Secret of Risk Management
Most swing traders fail not because their strategy is bad but because their risk management is weak.
Professionals follow these golden rules:
Risk only 1–2% of capital per trade
Always place a stop-loss
Size positions based on volatility
Avoid overtrading
Never increase lot size after a loss
The greatest secret:
Protecting capital is more important than making profits.
A trader who avoids major losses can survive long enough to catch big winning swings.
7. The Secret of Support & Resistance Mastery
Swing traders obsess over support and resistance levels.
These levels act as price magnets and turning zones.
Key levels include:
Previous swing highs/lows
Daily, weekly, and monthly levels
Psychological numbers (100, 500, 1000)
Fibonacci retracement levels
Supply and demand zones
Swing traders wait for price reactions at these levels and only trade when confirmation appears.
8. The Secret of Using Indicators the Right Way
Professional swing traders use indicators as confirmation, not decision-making tools.
Popular indicator combinations:
A. Trend + Momentum
50-EMA or 200-EMA + RSI
20-EMA + MACD
B. Pullback Identification
Bollinger Bands
Stochastic RSI
C. Breakout Confirmation
Volume + MACD
RSI breakout
The secret:
Use indicators sparingly—2 or 3 maximum.
Clear charts produce clearer decisions.
9. The Secret of Trading Psychology
Swing trading rewards emotional control.
Professionals master:
A. Discipline
Follow the plan strictly.
B. Patience
Wait for the best setups.
C. Emotional Detachment
React to charts, not feelings.
D. Consistency
A few high-quality trades outperform dozens of random trades.
The less emotionally involved a trader is, the better they perform.
10. The Secret of Journaling Every Trade
This is one of the most underrated secrets.
A trade journal includes:
Entry and exit
Stop loss
Chart screenshots
Reason for trade
Mistakes
Market context
Journaling forces self-reflection and dramatically improves discipline and performance.
11. The Secret of Avoiding News-Based Noise
Swing traders avoid making decisions during:
Major economic announcements
Earnings reports
Policy changes
High volatility events
News can create unpredictable spikes that damage swing positions.
Professionals stay defensive during such periods.
12. The Secret of Letting Winners Run
One of the greatest swing trading secrets is knowing when not to exit early.
Successful traders:
Trail their stop-loss
Add positions in trend continuation
Hold until target zones are met
Small losses and big wins create long-term profitability.
Conclusion
Swing trading appears simple but demands mastery of multiple elements—trend recognition, timing, patience, volume interpretation, chart patterns, risk management, and psychology. The real secrets lie not in magical indicators but in disciplined execution and consistent behavior. When traders combine technical analysis with emotional control, they unlock the ability to capture market swings with confidence and accuracy.

Gold Trading Strategy for 20th November 2025🟡 GOLD INTRADAY LEVELS – 30-Min Strategy
📈 BUY SETUP (Long Position)
🔸 Entry Condition:
Buy above the High of the 30-min candle after price closes above $4122.
💰 Targets:
🎯 $4132
🎯 $4145
🎯 $4160
📌 Notes for Traders:
Wait for a strong bullish candle close above $4122 to confirm the breakout.
Ideal if volume increases as the breakout happens.
Keep the trendline/market structure in view before executing.
📉 SELL SETUP (Short Position)
🔻 Entry Condition:
Sell below the Low of the 30-min candle after price closes below $4056.
💰 Targets:
🎯 $4044
🎯 $4032
🎯 $4018
📌 Notes for Traders:
Look for a strong bearish candle close below $4056.
Breakdown is more reliable if accompanied by increasing selling pressure.
Always confirm with momentum indicators (RSI, MACD, etc.) if possible.
⚙️ Risk Management (Highly Recommended)
🔒 Use Stop-Loss just below breakout candle for buys / above breakdown candle for sells.
📏 Risk–Reward ratio: Minimum 1:2.
💼 Avoid over-leveraging; trade only with allocated risk capital.
⚠️ Disclaimer
This information is provided only for educational and informational purposes.
It is not financial advice, and trading in gold or any financial instrument involves high market risk.
Always consult your financial advisor and trade at your own discretion.

Psychology of Indian Traders – Short Real-Life Cases!Hello Traders!
India has one of the fastest-growing trading communities in the world.
But despite access to charts, tools, YouTube, and education, most retail traders still repeat the same emotional mistakes.
Here are a few short real-life cases that show how psychology shapes the journey of Indian traders more than any strategy or indicator.
1. The Salary Trader, “I Just Want to Recover My Losses”
A 28-year-old IT employee from Bengaluru started trading BankNifty options after watching influencers brag about profits.
He made ₹6,000 on his first day, and believed trading was easy income.
Then he lost ₹45,000 in two weeks. Instead of stopping, he kept trading bigger lots to recover.
Within 3 months, he wiped out his entire savings.
His mistake wasn’t strategy.
It was thinking recovery is more important than discipline.
2. The Overconfident Trader, “Market Mere Hisab Se Chalega”
A 33-year-old trader from Gujarat had one big lucky win in 2021 during the bull market.
He made ₹3.5 lakh in one week and believed he was naturally talented.
He increased his position size, stopped using stop loss, and ignored risk.
The next correction wiped out not just his profit, but his entire capital.
His mistake was thinking “luck = skill.”
3. The FOMO Trader, “Sab Log Le Rahe Hain, Main Kyun Chhodo?”
A young trader from Mumbai bought every trending coin, SHIB, PEPE, FLOKI, without checking charts or fundamentals.
He only entered after seeing pumps on Twitter.
He never bought dips, only tops.
Today, he holds a portfolio down 70%, waiting for “next bull run” to save him.
FOMO always makes you late.
4. The Quiet Winner, “Main Kam Karta Hun, Par Sahi Karta Hun”
A disciplined trader from Pune took only 2–3 trades a week.
He risked just 1% per trade, journaled every entry, and treated trading as a skill.
In 18 months, he grew his account slowly but consistently, without blowing up once.
He is not rich yet, but he is stable, confident, and improving every month.
Consistency beats speed, every time.
Rahul’s Tip:
Most Indian traders don’t need more indicators, they need more patience, more control, and more clarity.
Before learning complex setups, learn yourself.
Your psychology decides your wealth more than your strategy ever will.
Conclusion:
These real-life cases show one truth, the Indian market doesn’t destroy traders.
Their habits do.
If you want to be different, think differently.
Trade slow, trade smart, and build discipline before expecting profits.
If this post felt relatable, like it, share your story in comments, and follow for more real-world trading psychology lessons!

LiamTrading – XAUUSD H1 | Monday SetupLiamTrading – XAUUSD H1 | Monday Setup
Wait for gold to retest the upper trendline before choosing a direction
Quick Overview
On the H1 timeframe, gold is still moving inside a triangle pattern with a descending upper trendline and a gradually rising lower trendline. In my view, price still needs a bullish swing to retest the upper trendline – which aligns with the FVG zone + Volume Profile POC – before deciding a new trend (either a breakout to the upside or a reversal downward).
Regarding the USD, many Fed officials have begun signaling that rate cuts may happen, but they remain very cautious. UBS and Barclays both lean towards the scenario that the Fed could cut rates in December if upcoming data continues to weaken. This limits the USD’s ability to strengthen too much, giving gold room for a technical pullback into resistance zones.
H1 Technical Analysis
Current structure: price is consolidating sideways, with lower highs along the descending trendline and higher lows supported by the lower trendline.
Zone 4079–4081:
FVG + Volume Profile POC.
This area aligns with the upper trendline → a strong confluence resistance zone, suitable for a reaction-based short setup.
Nearest support zone: around 4040–4035; if this level breaks, price may likely head back to retest 4010–4000.
A clear bullish reversal signal only forms if an uptrend structure returns, at least when price breaks and holds above 4061, then continues through the descending trendline.
Trading Scenarios (Reference Only)
Sell at FVG + POC + Trendline (Priority setup)
Entry: 4079–4081
SL: 4086
TP: 4060 → 4045 → 4010
Logic: Price is expected to move up to fill the FVG and touch the POC/trendline before sellers step back in. This zone has strong confluence, offering a better win rate than shorting inside the sideway range.
Buy when bullish structure is confirmed
Conditions: Price must break above 4061, close an H1 candle holding above this level, and break out of the descending trendline.
Entry (reference): 4061–4068 (retest of breakout zone)
SL: 4050
TP: 4095 → 4130 → 4150
In this case, the triangle pattern breaks upward, Dow Theory bullish structure returns, and the priority is buying with the new trend rather than trying to short the top.
Trading Notes
Possible scalp levels: 4060, 4040, 4010, 4130 – always wait for clear candle reactions on M5–M15 before entering.
Risk per trade: 0.5–1% of account size; once the trade reaches around 1R, move SL to breakeven to protect your capital.
If you have a different scenario for XAUUSD H1 today, leave a comment and follow LiamTrading for daily gold strategies on TradingView.

XAUUSD MULTI TIMEFRAME ANALYSIS Hello traders , here is the full multi time frame analysis for this pair, let me know in the comment section below if you have any questions , the entry will be taken only if all rules of the strategies will be satisfied. wait for more price action to develop before taking any position. I suggest you keep this pair on your watchlist and see if the rules of your strategy are satisfied.

U.S. data storm ahead – Gold awaits its next breakout🟡 XAU/USD – Timing Reversal at 4188, FVG Retest Expected
🔍 Market Context
Gold is approaching a key timing zone near 4188–4190, which aligns with previous supply and structural rejection.
After a strong impulsive leg, liquidity resting above recent highs may be targeted before a deeper pullback into the Fair Value Gap (FVG) zone.
The structure remains bullish in the medium term, but short-term corrective moves are expected before continuation toward the 4212 liquidity objective.
📈 Key Trading Zones
🔻 SELL Setup
Entry: 4188 – 4190
Stop Loss: 4192
Target 1: 4090
Target 2: 4020
Expect rejection at timing zone — short-term bearish retracement into FVG.
🟢 BUY Setups
BUY GOLD 4090 – 4088 | SL 4085
→ Scalp long targeting 4140–4160 if price reacts strongly within FVG.
BUY GOLD 4022 – 4020 | SL 4017
→ Ideal deeper retracement buy zone aligning with structural liquidity & prior demand.
🧠 Trading Plan Logic
Wait for price sweep & rejection at 4188–4190 before confirming short.
Monitor FVG zone (~4090) for reaction to flip back long.
The higher-timeframe target sits near 4212, aligning with liquidity above prior highs.
⚙️ Bias
Short-term: Bearish correction from 4190 toward 4090.
Medium-term: Bullish continuation toward 4212 after retracement.

Gold Analysis and Trading Strategies | Monday✅ Technical Outlook (4-Hour Structure)
● After reaching the historical high of 4381, gold entered a corrective phase, forming a segmented structure of “decline → bottoming → rebound.”
Each segment has lasted for roughly one week.
Currently, after touching 4245, gold has entered the second corrective wave, and from a cycle perspective, this adjustment is not fully completed yet.
● Over the past two days, gold has repeatedly found support around the 4000 psychological level, showing signs of rebound. This indicates that buyers are actively defending this area and that short-term bullish interest remains.
● Short-term moving averages (MA5, MA10, MA20) are currently clustered around the 4080–4100 region, forming strong pressure and signaling that the short-term trend remains bearish.
However, the long-term moving averages are slowly turning upward, suggesting that downside support remains valid and that deeper declines may be limited.
● The Bollinger Bands continue to narrow, indicating a range-bound and repetitive price structure.
The lower band is gradually aligning with previous lows, which together limit the downside space for further price declines.
✅ Daily Chart Structure
● Gold remains in a consolidation phase, with the overall Bollinger Bands displaying a gradual narrowing pattern, suggesting that a one-directional move is unlikely in the near term.
● The lower band is steadily rising and aligning with prior lows → limiting further downside risk.
● The upper band remains near 4100–4130, serving as the main short-term resistance zone for rebounds.
🔴 Resistance Levels: 4100–4130
🟢 Support Levels: 4005–4000
🎯 Trading Strategy Reference
🔰 Strategy 1 (Sell on Rebound)
● Short around 4100–4105 in batches
Targets: 4050–4020
Breakdown target: 4000
🔰 Strategy 2 (Buy on Pullback)
● Buy around 4000–4005 in batches
Targets: 4020–4030
Breakout target: 4050
📌 Outlook for Next Week
Overall, gold remains in a structure of weak consolidation — supported but with limited rebound strength.
The price is expected to continue oscillating within the 4000–4100 USD range next week.
● If Federal Reserve officials sound more “hawkish”:
Rate-cut expectations decline → USD strengthens → Gold may retest the 4000 support.
● If Fed officials turn more “dovish”:
Rate-cut expectations rise → Gold may retest the 4100 resistance zone.
● If geopolitical tensions escalate:
Safe-haven demand may push gold to break above the upper boundary of the range.
Next Monday’s short-term focus remains the 4000–4100 range.
Wait for a breakout, then follow the direction accordingly.
Gold Trading Strategy for 24th November 2025✨ GOLD Trading Plan – Breakout Strategy (30-Min Candle)
🟢 BUY Setup (Long Trade)
Trigger: Enter only if the price closes above the high of the 30-minute candle at 4086.
Entry: Buy above 4086 after a confirmed candle close.
Targets:
🎯 Target 1: 4100
🎯 Target 2: 4115
🎯 Target 3: 4128
Stop-Loss Suggestion: Below the breakout candle low or below 4058–4062 zone (adjust per risk tolerance).
Logic:
A close above 4086 signals bullish strength and a possible continuation toward intraday resistance levels. Momentum confirmation is essential before entering.
🔴 SELL Setup (Short Trade)
Trigger: Enter only if the price closes below the low of the 30-minute candle at 4042.
Entry: Sell below 4042 after a confirmed candle close.
Targets:
🎯 Target 1: 4034
🎯 Target 2: 4024
🎯 Target 3: 4010
Stop-Loss Suggestion: Above the breakdown candle high or above 4060–4065 zone.
Logic:
A close below 4042 shows bearish momentum that can push price toward the next support zones.
📌 Extra Notes for Better Execution
⏳ Wait for a confirmed 30-minute candle close before entering — avoid wick traps.
📉 Place stop-loss strictly; gold is highly volatile.
⚙️ Risk–reward should be at least 1:2 or better.
📊 Monitor global cues: USD strength, yields, economic data, and geopolitical news.
⚠️ Disclaimer
This analysis is for educational and informational purposes only. It is not investment or trading advice. Financial markets involve risk, and you should conduct your own research or consult a certified financial advisor before making any trading decisions. You are fully responsible for your trades.

LiamTrading – XAUUSD H4 | Gold accumulates on the trendlineLiamTrading – XAUUSD H4 | Gold accumulates on the trendline, waiting to break the structure for a breakout
After testing the upward trendline twice, gold bounced up and then moved sideways around the 4065 area. On H4, this price zone has accumulated for almost a week – indicating that the selling force is not liquid enough to push the price down deeply, while there is still plenty of price gap above according to Fibonacci. My preferred scenario: gold continues to "compress" within the triangle, then breaks out to create a new wave.
Macro – Fed context
Fed member Collins emphasized that there is still reason to be cautious about cutting rates in the December meeting. She stated:
This is a complex phase, and it's not unusual for internal disagreements within the Fed.
The Fed must balance between the two goals of employment and inflation, which are moving in opposite directions.
This makes it difficult for the market to clearly price the interest rate scenario, so gold continues to choose to accumulate around important technical zones instead of breaking out in one direction.
Technical Analysis – Trendline, Fibonacci, Volume Profile
The current H4 structure is a triangle model with:
A downward sloping trendline from the old peak 42xx.
An upward sloping trendline from the late October low, acting as dynamic support.
Zone 4060–4070: the "balance" price zone last week – where the price moved sideways the longest, serving as a reference point for the short-term trend.
Key levels: 4132: near resistance, coinciding with the VAH area of the current Volume Profile.
4171: higher resistance, near the Fibonacci 1.0 area of the recovery wave.
4242: Fibonacci extension confluence zone (1.618) + historical resistance – where strong profit-taking is likely.
4347: 2.618 expansion zone – reference target if the peak is successfully broken.
4022 and 3997: important support close to the lower trendline – main buy zone if there is a liquidity sweep.
When the price decisively breaks out of one of the trendlines, the new trend on H4 will be clearer; the trading plan will follow this breakout direction.
Risk management and invalidation
H4 closes below 3997: the triangle structure is broken downward, fully prioritizing sell orders to lower zones – at that point, medium-term buy orders should not be held.
H4 closes above 4245 with good volume: considered a successful triangle peak breakout, discard all sell orders in this area and focus on buying according to the new trend.
Which scenario are you leaning towards for next week: breaking up to test 4242–4347 or sweeping down to 4022–3997 before bouncing back? Leave a comment and follow the LiamTrading channel on TradingView for daily XAUUSD updates.

“BOS Confirmed — Demand Retest for Next Bullish Leg🟡 GOLD (XAU/USD) – Bullish Continuation Setup from High Probability Demand Zone 🆙
🔍 Chart Breakdown & Key Insights
Price created a Break of Structure (BOS) to the upside → confirming bullish momentum ✔️
Retested the Demand Line + Support Zone → buyers defending strongly 💪
High Probability POI (previous accumulation zone) remains valid with liquidity swept below → smart money accumulation evidence 💰
Current pullback = healthy retracement into demand before potential continuation
🎯 Targets (With stickers)
🎯 Target Zone Price Region Sticker
TP1 → Retest recent high 4,165 – 4,175 🎯
TP2 → Liquidity above highs / extended target 4,180 – 4,195 🚀💸
TP1 hit possibility is HIGH due to bullish structure 📈
TP2 depends on strength of breakout ⬆️
📌 Trade Idea (High Probability Setup)
🟩 Buy Entry Zone:
➤ 4,120 – 4,130 (pullback entry at support)
🟢 Take-Profit:
➤ TP1: 4,170 – TP2: 4,190
📊 Risk-Reward Ratio: 1:2.5 – 1:3+ ✔️
🧭 Market Structure Sentiment
Factor Outlook
Trend Bullish 📈
Liquidity Upside still available 💧
Smart Money behavior Accumulation & continuation expected 💼
⚠️ Just watch if price breaks below the demand line → would weaken this bullish plan.

Brian – Gold game plan for the US sessionBrian – Gold game plan for the US session
Gold’s rally yesterday shook a lot of traders out of position – the move was slow, steady and unforgiving, making it hard both to get in and to get out. For now, the short-term trend is clearer on H1, while H4 is still in transition.
Fundamental view – the Fed is confusing everyone
Fed expectations for December have been on a roller-coaster:
The market went from pricing a 25 bp cut in December at over 90%,
Then collapsed those odds to below 30%,
And has now swung sharply back again – all within about a month.
That kind of violent repricing in rate expectations usually creates two things for gold:
underlying support as soon as the market believes in easier policy again, and
choppy two-way volatility around each new data print or Fed comment.
So the macro backdrop still leans supportive for gold, but you do not want to ignore intraday whipsaws.
Technical view – H1 bullish, H4 testing the top of structure
On the H4 chart:Price is trading above the rising medium-term trendline from late October, keeping the broader structure constructive as long as 4,000 holds.
We are now pushing up towards the descending trendline and a H4 supply/FVG band between roughly 4,160 and 4,200.
Higher up sits a larger FVG / resistance block around 4,280–4,330 – if price ever accepts above the current downtrend line, that zone becomes a realistic upside magnet.
On H1:Structure is clearly bullish with higher highs and higher lows after yesterday’s impulsive move.
The current leg is extended, so I prefer to buy dips into support or a clean retest, rather than chase at the top of the candle.
Core bias: still prefer buys with the trend. Shorts are tactical, only at clear reaction zones.
Key levels
Resistance / sell zones
4,167–4,169: short-term reaction zone at the descending trendline and FVG
4,200–4,220: upper part of the same supply area
4,280–4,330: major H4 FVG / supply above
Support / buy zones
4,110–4,113: intraday support and potential retest area
4,080–4,070: minor support from recent consolidation
4,040–4,020: deeper pullback zone
4,000: key structural support; a break here would damage the bullish case
3,884: level that would confirm a medium-term bearish shift if price breaks and holds below
Trade scenarios (reference only, not financial advice)
Scenario 1 – Primary long: buy the dip into 4,110
Idea: stay with the bullish H1 structure, use the first decent pullback to get a better entry.
Entry: 4,110–4,113
Stop: 4,105
Targets: 4,125 → 4,140 → 4,180 → 4,200
I want to see price pull back into this zone after a push higher, ideally with a rejection wick or bullish candle confirming buyers are still in control.
Scenario 2 – Tactical short: fade the trendline at 4,167–4,169
Idea: counter-trend scalp from a clean confluence of resistance and FVG.
Entry: 4,167–4,169
Stop: 4,175
Targets: 4,155 → 4,140 → 4,120 → 4,105
This is not a swing short – it is a tactical trade against the intraday trend. Size should be smaller, and I would look to lock in profit or move to breakeven quickly if price reacts in our favour.
Scenario 3 – Breakout long if the trendline gives way
If gold pushes through the descending trendline and holds above the 4,170–4,180 zone:
I will shift back to a breakout-continuation mindset, looking to buy pullbacks above the broken trendline.
The next upside magnets then become 4,220 first and eventually the 4,280–4,330 FVG.
As long as 4,000 holds, I respect the upside and prefer to position with the trend, not against it. If we ever see a daily close below 4,000 and then 3,884, the whole story flips and I’ll start treating rallies as selling opportunities.
Trade the structure in front of you, not the headline noise. Manage risk around the shifting Fed expectations, and let the levels do the heavy lifting.
If this breakdown helps with your game plan, follow Brian for more gold updates during the US session and drop your own view in the comments so we can compare scenarios.

Brian – Gold Money Flow Map for the US Session TodayBrian – Gold Money Flow Map for the US Session Today
Technical analysis – trendline, FVG, and two clear scenarios
On H4, gold is still maintaining a medium-term uptrend line drawn from the end of October. The decline in the Asian session this morning was not strong enough to break the structure; the price touched the trendline and then bounced up, indicating that the sellers have not yet "crushed" this support area.
Current structure: The price is accumulating around the 4,050–4,080 area in a sideways candle cluster, lying on the uptrend line and above the 4,000 support.
Above, the 4,120–4,170 area is an FVG + important supply zone; higher is a larger FVG around 4,280–4,330 – if "filled," it is a potential area for a strong profit-taking move.
Below, the 4,000 mark is a key support; losing this mark, the price could quickly slide to the 3,884 area – marked on the chart as the level confirming a medium-term downtrend if breached.
Until 4,000 is broken, I consider this an accumulation area with a high possibility of "fake breaks" on both sides – so prioritize trading according to the trendline, not guessing tops and bottoms in the noise area.
Key levels
Resistance / sell zone: 4,100–4,110: buy confirmation zone, if rejected will become short-term supply
4,170–4,173: FVG / supply, medium-term short zone
4,280–4,330: large FVG above
Support: 4,048–4,050: trendline + intraday breakout zone
4,022–4,005: next support if the price slides off 4,040
4,000: psychological and structural support
3,884: final support; breaking down will confirm a medium-term downtrend
Trade scenarios (for reference, not investment advice)
1. Sell break intraday – follow the trend if the trendline breaks
Entry: sell when the price breaks the short trend at 4,048–4,050
SL: 4,056
TP: 4,040 → 4,022 → 4,005
Idea: if the price breaks below the current accumulation cluster and short trendline, I want to follow the initial selling force, targeting the adjacent support area 4,022–4,005. When the order goes right, SL can be moved to BE around 4,040.
2. Sell “premium” – short at the upper FVG zone
Entry: 4,170–4,173
SL: 4,178
TP: 4,160 → 4,145 → 4,122 → 4,100
This is a price zone I consider "beautiful" for medium-term trading if the market gives a deep retracement. FVG + H4 resistance converge; if the price is strongly rejected here, the TPs are successively the lower demand zone and the current range bottom.
3. Buy only after clean breakout – do not rush to catch the bottom
I am only interested in buy orders when the market structure truly confirms:
Trigger: H1/H2 candle closes clearly above 4,100
Entry: buy right around 4,100 after breakout
SL: 4,092
TP: medium-term towards the 4,145 → 4,170 → 4,230+ depending on momentum
This scenario considers 4,100 as the "exit door" from the current accumulation area. If this area holds as new support, buyers will have a clearer advantage and the money flow could push the price up to gradually fill the upper FVGs.

Part 1 Introduction to Candlestick PatternsThe Greeks: Heart of Option Trading
The Greeks measure how options change with market conditions.
1. Delta
Measures how much the premium moves compared to the underlying.
Call delta = +ve
Put delta = –ve
2. Theta
Measures time decay.
Always negative for buyers
Positive for sellers
3. Vega
Measures sensitivity to volatility.
High volatility = expensive options.
4. Gamma
Shows how Delta changes.
High Gamma = fast premium movement.

Gold Turning BEARish #XAUUSD turning BEARish 🐻
Now at 4060.
SELL on RISE 🤞
Expecting significant downside moves
that may last for a couple of hours...
Until trades below 4064 weak trend wud remain
&
wud get intensified after crossing 4049-51 range...🤞
Expected to hit-
TP 1: 4041
TP 2: 4029
TP 3: 4019
SL: 4087

LiamTrading – XAUUSD H1 | Gold breaks bullish structure...LiamTrading – XAUUSD H1 | Gold breaks bullish structure, short-term downside takes control
Gold has dropped sharply by more than $20 in a short time, losing over 1% on the day and moving close to the lower 4,030 area. The previous bullish structure has officially been broken, 4040 failed to hold, and today’s focus continues to be selling with the trend until the 4000–398x support zone shows clear reactions.
Macro Analysis
Gold prices declined as expectations for a December rate cut weakened: JPMorgan no longer forecasts a Fed rate cut in December, opposite to their earlier 25 bps cut scenario.
Some institutions still believe rising unemployment and weaker economic data may force the Fed to cut 25 bps at the upcoming meeting.
The market is currently pricing the probability of a December rate cut at nearly “50–50,” creating strong uncertainty and putting short-term pressure on gold, even though the metal still benefits in the long term if the rate-cut cycle begins.
Technical Analysis H1 – Bearish structure, price channel, and support zones
After breaking below 4040, price formed a series of Lower Highs – Lower Lows, confirming a Dow-theory bearish structure on H1.
A falling channel is forming; the channel’s upper boundary aligns with the short-term resistance zone at 4050–4060.
4000 zone: a key psychological support. If broken decisively, the medium-term structure may shift into a deeper corrective phase.
Buy Zone 3987–3989
Strong support confluence + Fibonacci extensions (1.618/2.272) of the current bearish swing
Optimal area for catching a corrective bounce if clear reversal signals appear
Key Resistance Levels Today
4052–4054: retest of former support + upper boundary of falling channel → ideal area for a pullback-sell setup.
Trading Scenarios Today (LiamTrading)
Scenario 1 – SELL with the prevailing downtrend (priority)
Entry: 4052–4054
SL: 4060
TP: 4030 → 4015 → 3990
Logic: Price retraces to resistance + channel top, suitable for trend-continuation selling. Prefer setups where M15 shows rejection candles (pin bar/bearish engulfing) around 405x.
Scenario 2 – BUY at strong support 398x (counter-trend bounce)
Entry: 3987–3989
SL: 3980
TP: 3999 → 4014 → 4040 → 4080
Logic: 398x is a high-confluence support zone; trigger only when clear price reaction appears (long lower wicks or reversal patterns on M15–H1).
This is counter-trend, so use smaller position sizes and take partial profits.
Risk Notes & Invalidation
H1 closes above 4060: short-term bearish structure weakens → pause all sell setups and reassess.
H1 closes below 3980: buy zone fails → downside could extend further; only sell setups preferred.
Always keep risk per trade at 0.5–1%, and once reaching +1R, move SL to break-even.
Are you leaning towards continuing to sell with the trend, or waiting to buy the dip at 398x?
Follow LiamTrading on TradingView for daily XAUUSD updates


A Short Gold Sell Opportunity You Can't MissLooking at the chart, gold continues to move steadily within a clear downtrend channel, with each peak and trough forming progressively lower levels over time. Currently, the price is approaching the upper boundary of the channel and interacting with the same resistance area where sellers have stepped in multiple times before, forcing the market to reverse. This behavior strongly indicates that the potential for a continued corrective move downward, in line with the main trend, remains intact.
With this in mind, I believe a price decline toward the 4,080 level is a reasonable and logical target for the current correction. As long as the price hasn’t clearly broken through the upper boundary of the channel, I will continue to favor the scenario where the bearish trend remains dominant, viewing any upward movement as a mere pullback within the overall structure.
This is not financial advice, but simply my personal perspective based on the current price action.

XAUUSD/GOLD 1H BUY PROJECTION 24.11.25(XAUUSD/GOLD 1H BUY PROJECTION – 24.11.25).
🔍 What the Chart Shows
Your chart displays a buy setup on the 1-hour timeframe with the following key elements:
🟦 1. Support Zone (S1)
Price is reacting from the horizontal support zone.
This zone aligns with the 1H uptrend line, adding confluence.
Good demand area.
📉 2. Trendline Support (1H Uptrend)
The price is touching the ascending trendline, indicating continuation of the uptrend.
🔦 3. Hammer Candle Confirmation
A bullish hammer candle is highlighted (yellow box).
This indicates seller exhaustion and possible reversal to upside.
This candle gives confidence for a buy entry.
🎯 4. Entry, SL, TP
Entry: At the hammer candle close near 4043–4045 zone.
Stop Loss: Below support zone and trendline (~4020–4025 zone).
Target: Back to Resistance R2, around 4100+ zone.
Risk/Reward: 1:4 shown — good reward potential.
🟪 5. Resistance Levels
Resistance R1: Mid chart area.
Resistance R2: Strong resistance zone near 4100+.
📌 Overall Summary
Your setup is logically structured with:
Support + Trendline confluence
Hammer reversal confirmation
Clean R:R
Uptrend continuation expectation
This is a valid 1H buy setup based on price action and structure.

Gld Trading Strategy for 25th November 2025🟡 $XAU/USD – GOLD TRADING PLAN (Intraday Strategy)$
📈 GETTEX:BUY SETUP (Bullish Scenario)$
👉 Condition to Enter Buy:
Wait for a 30-minute candle to close ABOVE the high of $4170$.
Only if price breaks and closes above 4170 with strength, the bullish momentum becomes valid.
🎯 Buy Targets:
$4182$ – First target, short scalp level.
$4193$ – Second target, medium strength resistance zone.
$4204$ – Final target, strong liquidity area where sellers may appear.
🛡️ Why this Buy Setup Works:
4170 acts as a mini-breakout zone.
30-minute candle confirmation reduces false breakouts.
Each target aligns with short-term resistance levels usually used by intraday traders.
🟢 Trade Management for Buy Side:
After entry, shift SL to breakeven once price crosses $4182$.
Partial booking recommended at each target.
Use a dynamic trailing stop if momentum becomes strong.
📉 $SELL SETUP (Bearish Scenario)$
👉 Condition to Enter Sell:
Wait for a 1-hour candle to close BELOW the low of $4106$.
A 1-hour confirmation indicates strong institutional selling pressure.
🎯 Sell Targets:
$4090$ – Immediate support, first profit zone.
$4078$ – Extended downside target.
$4063$ – Deep target zone, where buyers may step in.
🛡️ Why this Sell Setup Works:
4106 acts as a critical breakdown level.
1-hour confirmation provides high-probability downward continuation.
Targets align with earlier demand zones.
🔻 Trade Management for Sell Side:
Move SL to breakeven below $4090$.
Book profits partially for risk reduction.
Watch for reversal signs at $4063$.
⚠️ $Important Disclaimer$
📌 This is NOT financial advice.
📌 These are educational trading levels based on price-action structure.
📌 Trading gold involves high risk. Always use stop loss, manage position size, and evaluate market volatility.
📌 You are responsible for your own trades.
