Gold Investors: What to Do When Your Investment Has Multiplied?Hello Traders!
There comes a phase in every Gold investor’s journey that feels like success. You bought Gold much earlier, prices moved in your favour, and today your investment has multiplied. On paper, everything looks perfect. Profits are healthy, confidence is high, and holding feels easy.
Bu
Gold CFD
No trades
XAUUSD – Brian | M45 Technical Analysis— Buyers Still in Control Above 5,200
Gold continues to trade firmly above the 5,000 milestone, with price action confirming strong bullish acceptance at higher levels. On the M45 timeframe, the market remains in an expansion phase, supported by aggressive buying volume and well-defended value area
Elliott Wave Analysis XAUUSD – 26/01/2025
Momentum
– Weekly momentum (W1) has now turned bullish, therefore the uptrend is likely to continue for the next few weeks on the weekly timeframe.
– Daily momentum (D1) is currently overlapping in the overbought zone, which warns that a potential reversal could occur during this week.
– H4 mom
XAUUSD Gold Next Move In Upcoming 2 Weeks ExpectedGold is Now Moving to 5600 to 5615 Which is Retracement level of 1.618 For Golds Previous Swing Extension levels and can expect a retracement of till 5000 to 5100 Levels In Upcoming Weeks Lets See WhatS Going to Happen..........# XAUUSD .. Check My 4hr chart Frame
XAUUSD (H2) - Liam Plan (Jan 28)XAUUSD (H2) – Liam Plan (Jan 28)
New ATH, strong safe-haven flow | Follow trend, buy FVG pullbacks only
Quick summary
Gold continues to print new all-time highs as global capital rotates into safe-haven assets amid persistent economic and geopolitical uncertainty tied to recent US policy decision
0/0, 1/0, 0/1 Explained: MARAL Liquidity Conditions Liquidity Isn’t an Entry — It’s a Test (XAUUSD Case Study)
This XAUUSD chart is a textbook example of why most traders misunderstand liquidity in live markets.
Price moved strongly higher over multiple sessions, creating a clear bullish structure. Many traders see this and immediately think:
“Trend
XAUUSD 1 D T/F ANALYSIS----
xauusd 1d t/f analysis---- previous marked demand will be completed on 5000 $ level after demand complete then we can expect marked consolidated are so we can expect consolidated here and we have also trending support help it to prove if consolidated period can be half then trending support again
XAUUSD – H1 Outlook: New All-Time HighXAUUSD – H1 Outlook: New ATH, Now Watch the Pullback Structure | Lana ✨
Gold has printed fresh all-time highs and is now trading near the $5,100 psychological area. After six consecutive bullish sessions, the trend is still strong — but at these levels, the market often needs a controlled pullback
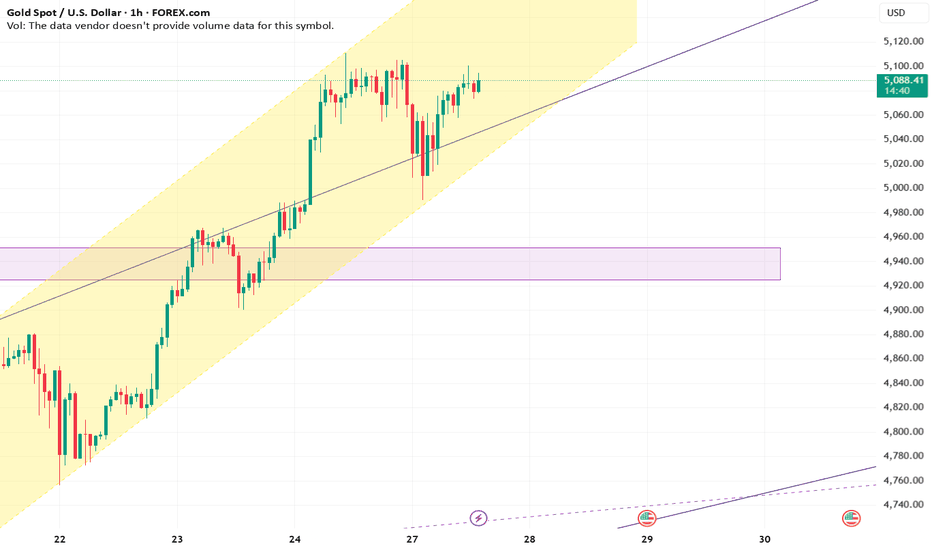
Gold 5200/1h ChartGold moving in channel from last 10 days. I believe breaking the 5110 level will put gold to new high of 5200. Although I don't see this happing today. Failing to do so might trigger a profit booking as it has already moved 15% from previous high (+last 7 days green candle closing).
Be vigilant wit
See all ideas
Displays a symbol's price movements over previous years to identify recurring trends.


