Elliott Wave Analysis – XAUUSD (October 22, 2025)
🔹 1. Momentum
D1:
The D1 momentum is preparing to turn bullish, signaling the start of a new upward trend.
→ We can expect at least 3–5 consecutive bullish days ahead.
H4:
We need to wait for the H4 candle to close to confirm the reversal signal.
If confirmed, there’s a strong possibility that today will form an intraday uptrend.
H1:
H1 momentum has already turned upward, but it’s now in the overbought zone.
Therefore, the current rise won’t be strong, and a minor pullback is needed to bring momentum back to the oversold area — creating a foundation for a more stable bullish move.
________________________________________
🔹 2. Wave Structure
D1 Timeframe:
Yesterday saw a sharp decline, but D1 momentum is now preparing to reverse upward.
Counting the correction candles, we already have five candles, suggesting that the market may soon enter a new bullish phase lasting 3–5 days or more.
During this recovery phase, we need to monitor two key scenarios:
• If wave movements overlap and lack strength, and when D1 momentum returns to the overbought zone but price fails to break the previous high, then the Wave 4 (yellow) scenario is still in play.
• If price rises sharply and decisively, the recent correction might only be part of Wave 3 (yellow), meaning the bullish trend is continuing.
H4 Timeframe:
Yesterday’s structure was identified as a Flat correction, and it remains valid.
Price has retraced into the Wave 4 zone of the smaller degree structure, reaching the 2.0 Fibonacci extension of Wave A.
If Wave 5 (purple) is now developing, the ideal target would be around 4476.
However, if price rises with overlapping waves, this could instead represent a corrective move within Wave 4 (yellow), targeting the previous high zone between 4381 and 4476.
H1 Timeframe:
Within Wave W, there is a small Flat correction, where Wave C extended to twice the length of Wave A.
Now, Wave Y (blue) has also declined to 2× Wave W, suggesting weakening buying power.
Even so, in the short term, we still expect an intraday bullish move today.
→ The trading bias remains buy-side until H4 momentum reaches the overbought area and reverses.
________________________________________
🔹 3. Trading Plan
Buy Zone: 4101 – 4098
Stop Loss (SL): 4088
Take Profit 1 (TP1): 4190
________________________________________
🔹 4. Notes
Liquidity and resistance zones are already marked on the chart.
→ Wait for price to break and retest those areas to confirm a valid Buy setup.
Trade ideas

XAUUSDLast day was consolidating and has generated sell side liquidity. There could be possibility the price sweeps that liquidity and then reverse from the Marked Demand zone.
We have Imbalace left in 15M
We have Equal lows. Srong liquidity pool.
Below Eq low we have Demand zone.

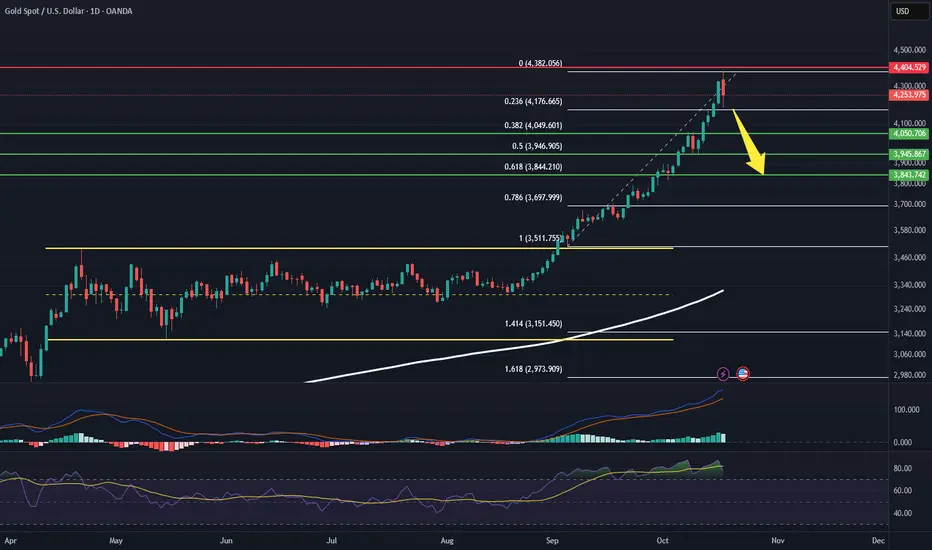
Is Gold (XAUUSD) Set for a Major Pullback? Short Below 4185!Gold has been in a massive range between 3500 and 3120 (a 320-point base). Following the breakout, we witnessed an explosive rally up to 4380 —an 880-point surge, nearly 2.5x the previous range!
But now, caution is warranted. Gold has formed a bearish reversal candle at the peak, and the RSI is deeply overbought . Despite the strong bullish trend, a confirmed short signal will trigger only if Gold breaks below 4185 .
Trade Setup:
Entry: Sell Gold (XAUUSD) below 4185
Sell on Rallies: Add to shorts near 4280
Targets:
1st target: 4050 - 4000
2nd target: 3850
Stop Loss / Invalidation: Close shorts if price moves above 4402
Why this setup matters:
With Gold’s momentum stalling at key resistance and technical indicators signaling overextension, a well-timed short could capture a strong corrective move.
Do you agree with this bearish outlook?
👍 Like if you’re ready to short!
💬 Comment your take or questions below — let’s build a powerful, informed trading community!
Your feedback drives our content and keeps everyone trading smarter. Let’s make those pips together! 🚀
Happy Trading,
– The InvestPro Team
XAU/USD (Gold vs USD) 4H chart:XAU/USD (Gold vs USD) 4H chart:
I can see a clear double top pattern near the 4,330 zone (circled areas).
Price has broken the ascending trendline and is currently retesting near the 4,080–4,100 resistance zone (previous support).
The green zone shows the neckline area that price already broke below.
📉 Technical Breakdown:
Pattern: Double Top
Neckline: Around 4,130
Measured Move Target: Equal to the distance from the top (~4,330) to the neckline (~4,130), i.e. ≈ 200 points.
Applying that below the neckline gives:
→ 4,130 - 200 = 3,930
However, my chart’s “Target Point” line is drawn slightly lower — around 3,848.57, which aligns with a deeper support level and the full projection of the trend break.
✅ Final Target Zone:
Primary Target: 3,930
Extended / Full Target: 3,850 (3,848.57)
So:
> 🎯 XAU/USD Bearish Target = 3,850 – 3,930 zone

XAU/USD (Gold) chart on the 3-hour timeframe...XAU/USD (Gold) chart on the 3-hour timeframe, I can see my using the Ichimoku Cloud and have marked a range with a potential breakdown area and a target point already indicated on the chart.
Here’s what the chart suggests:
Current price: around 4031 USD
Range low (support): around 4030 USD (which is currently being tested)
Range high (resistance): around 4190–4200 USD
Breakdown target (measured move): around 3940–3950 USD
📉 Analysis:
Price has broken below the range box, indicating a bearish breakout.
The Ichimoku Cloud ahead is bearish and thick, showing potential resistance.
A measured move from the height of the range (≈ 150–170 points) projects downward to around 3940–3950 USD.
My chart already marks 3944.299 as the target point, which aligns well with this projection.
✅ Target Summary
Type Level (USD) Comment
Short-term target 3,944 Measured move target after range breakdown
Extended target 3,900–3,880 Possible continuation if bearish momentum sustains
Invalidated above 4,090–4,100 If price re-enters the range and closes above the cloud

Gold 1H – Slight Correction or Bullish Reaccumulation Ahead?XAUUSD – Intraday Trading Plan | by Khang_Trader
📈 Market Context
Gold is currently trading around $4,110/oz as traders digest a mix of macroeconomic signals and shifting expectations surrounding the Federal Reserve’s next moves.
The market focus today centers on U.S. housing-starts and jobless-claims data.
Strong data → could trigger short-term selling pressure on gold.
Weak data → may fuel safe-haven demand, extending the current rally.
Treasury yields remain steady, while dovish rate-cut bets for early 2026 are gaining traction.
Expect liquidity sweeps around session highs/lows before a clear directional move, as institutional traders fine-tune their positioning within the week’s range.
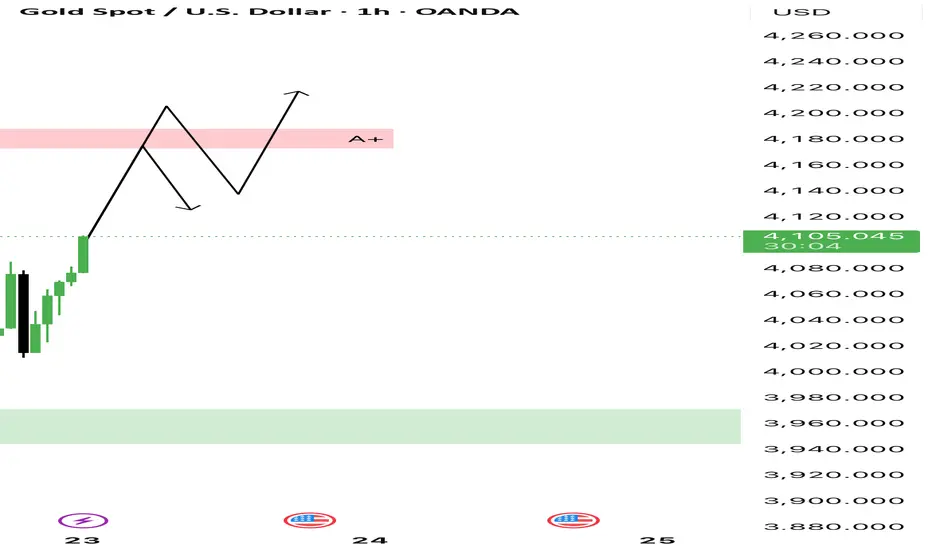
🔎 Technical Analysis (1H / SMC Perspective)
The overall market structure remains bullish, with recent BOS confirming continuation after a prior accumulation phase.
A minor Change of Character (ChoCH) has appeared, signaling a short-term correction — likely a liquidity grab before the next bullish leg.
Liquidity below $4,090-$4,100 has been swept, bringing price into the discount zone near $4,050-$4,080.
A potential re-accumulation zone is forming around that area — buyers should wait for M15/M30 BOS or ChoCH confirmation before entering.
Upside liquidity targets align with the $4,350-$4,380 region — a premium supply zone where sellers may re-enter.
🔴 Sell Setup
Entry: 4378 – 4376
Stop-Loss: 4386
Take-Profit Targets:
1️⃣ 4325
2️⃣ 4260
📌 Only consider this setup if price reaches the supply zone and shows bearish confirmation (BOS/ChoCH on lower timeframe).
🟢 Buy Setup
Entry: 4050 – 4080
Stop-Loss: 4045
Take-Profit Targets:
1️⃣ 4150
2️⃣ 4300
3️⃣ 4350 +
📌 Look for BOS or ChoCH confirmation on M15 before execution. Avoid entering right before U.S. data releases.
⚠️ Risk Management Tips
Avoid trading during high-impact news — spreads can widen and cause slippage.
Scale in/out gradually; take partial profits at liquidity zones.
Once structure confirms continuation, trail stop-loss to lock profits.
A clean break below $4,000 would invalidate the bullish continuation scenario — re-evaluate bias if that happens.
Maintain a clear Risk : Reward ratio (ideally 1 : 3 or better).
✅ Summary
Bias: Bullish as long as price holds above $4,000.
Buy zone: 4050-4080 (watch for confirmation).
Sell zone: 4376-4378 (look for reaction and BOS down).
Key invalidation: Below 4000.
Watch U.S. data this session — it will likely dictate short-term volatility and direction.
FOLLOW RYAN FOR MORE USEFUL TRADING IDEAS!!!

Fair Value Gap Zones (FVG)🟢 Bullish Scenario
Buyers may step back in around these FVG zones:
Zone 1: 4325–4330
Zone 2: 4310–4315
Zone 3: 4285–4290
These are possible liquidity refill points for another push upward.
📈 Buy Plan
Entry: 4325–4330
Stop-loss: Below 4310
Take-profit: 4355 → 4365


Gold Buy EntryGold has given good sell and requires a short correction as well looking into 4hr time frame double top and can come back neck line and go for short again - logic.
Good break of Trendline and pattern gave confirmation for buy target -
1) 4147
2) 4200

Trade Setup Explanation (Elliott Wave Correction)This chart shows a corrective wave structure (A–B–C), indicating that the market has likely completed its downward correction phase and is now gearing up for a potential bullish continuation.
• Wave (A) – Strong bearish leg marking the start of the correction.
• Wave (B) – A temporary pullback before continuation lower.
• Wave (C) – Final push down completing the correction, ending near the green demand zone (3,950–3,980).
• After the completion of Wave (C), buyers are showing strength, pushing price back above the short-term structure.
• The pink zone represents a key supply / resistance area where price may react or consolidate before the next move up.
📈 Trade Idea:
Wait for a retest and bullish confirmation around the pink zone (previous resistance).
If the market holds and forms higher lows, a potential long setup targeting new highs (above 4,200) could form.
XAUUSD/GOLD WEEKLY OVERVIEW PROJECTION 25.10.25“XAUUSD/GOLD WEEKLY OVERVIEW 25.10.25”:
🟡 Pair: XAUUSD (Gold vs USD)
📅 Timeframe: Weekly
📊 Chart Type: Price action with liquidity zone and retest entry plan
📌 Key Levels:
Resistance / Upper Target Zone: ~4,360 – 4,400
Entry Zone / Supply-Demand Range: ~4,057 – 4,145
Support / Lower Target Zone: ~3,868
🧭 Market Structure Analysis:
The price is currently consolidating inside a mid-range zone (4,057–4,145) after a strong previous down move.
Liquidity zones are marked both above and below, suggesting potential breakout and retest setups.
The market is showing accumulation or indecision before a big move.
🛒 Buy Scenario (Bullish Plan):
Price may retest the lower boundary of the entry zone (~4,057–4,145).
If a bullish retest/confirmation candle forms → Long Entry.
Target: ~4,360 area (major resistance).
Stop-loss likely placed slightly below 4,057.
🟢 This aligns with a potential reversal or continuation of higher timeframe bullish structure.
🐻 Sell Scenario (Bearish Plan):
Price may break below the entry zone, retest it from the bottom, and reject.
If a bearish retest/confirmation candle forms → Short Entry.
Target: ~3,868 support level.
Stop-loss likely placed slightly above 4,145.
🔴 This aligns with a continuation of the recent bearish momentum.
⚠️ Additional Notes:
Watch for fake breakouts near the entry zone.
Weekly candles can give strong direction but might take 1–2 weeks to fully play out.
High impact news related to gold or USD can accelerate the move.
✅ Summary Plan:
Buy entry: After bullish retest of 4,057–4,145 → TP 4,360
Sell entry: After bearish retest of 4,057–4,145 → TP 3,868
SL: Just outside the opposite edge of the entry zone.

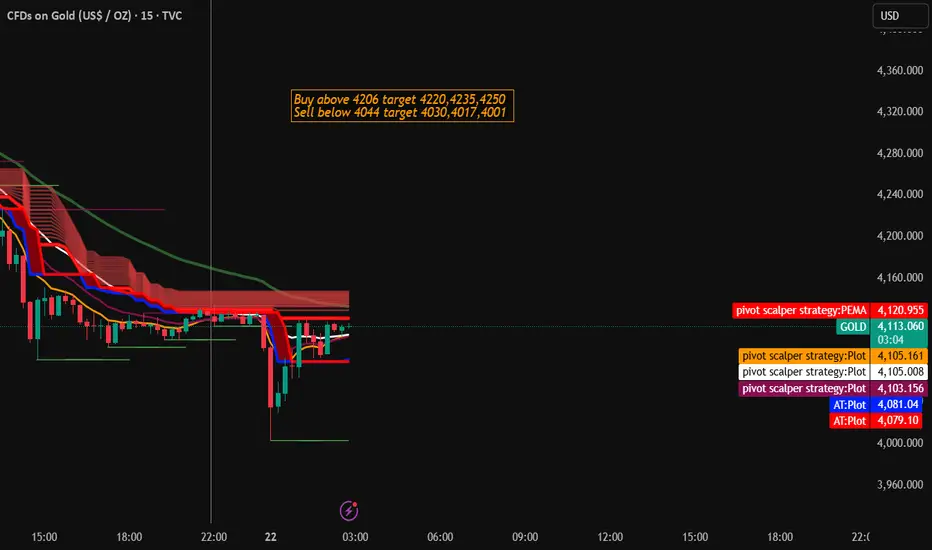
Gold Trading Strategy for 22nd October 2025🌟 GOLD INTRADAY LEVELS (22 OCT 2025) 🌟
📊 Buy Setup:
🟢 Buy Above: High of 15-min candle (Close above ₹4206)
🎯 Targets:
➡️ 1️⃣ ₹4220
➡️ 2️⃣ ₹4235
➡️ 3️⃣ ₹4250
🛑 Stop Loss: Below ₹4190 (or as per your risk appetite)
📉 Sell Setup:
🔴 Sell Below: Low of 15-min candle (Close below ₹4044)
🎯 Targets:
➡️ 1️⃣ ₹4030
➡️ 2️⃣ ₹4017
➡️ 3️⃣ ₹4001
🛑 Stop Loss: Above ₹4060 (or as per your risk tolerance)
💡 Trade Logic:
The levels are based on 15-minute candle confirmation — enter only after candle closes above or below the breakout level for better reliability. Avoid impulsive entries during volatile spikes.
⚠️ Disclaimer:
📘 This analysis is for educational and informational purposes only. It is not investment advice.
💰 Trading in commodities or derivatives involves significant risk. Please consult your financial advisor before taking any trades.
📉 Trade at your own risk.
Gold analysis /future move Gold today has fallen 150 $ roughly from day high .
if it breaks the support line and goes below 4187 it has a chance to fall further towards 4108 an 4046 .Double top pattern breakdown can be seen
if 4087 holds then gold can go high again.

PCR Trading StrategiesWhy Traders Use Options
Options are used for several strategic purposes:
Hedging: Protecting existing positions from price fluctuations.
Speculation: Earning profits from expected price movements with limited capital.
Income Generation: Selling options to collect premiums regularly.
Leverage: Controlling large positions with smaller amounts of money.

Support and Resistance with Volume ProfileWe generally say that Support and Resistance are the levels from where price reacts sharply. But have you ever imagined why price takes support and resistance from specific levels?
That's where Volume Profile comes into play.
Normally I use FRVP which can work on a Fixed Range (wave) instead of a session or visible range (we also have Session Volume profile and Visible Range Volume profiles in Tradingview).
After drawing VP for a fixed range, I look for high volume nodes (HVN). You can simply find those levels through long rectangular areas visible on the profiles. Large rectangles mean high volume activity at particular level.
Huge volume activity means big boys were interested in there and large number of contracts changed hands at that level. These levels act as a magnet and price often tests these levels and take support or resistance (as the case may be) and reacts.
In the above chart, notice when the price reacted from 4380 highs, it took support at HVN and reacted, forming a structure support, to form a new high 4381.
It is best to look for buying selling opportunities on the first touch of HVN areas. The second or third touch may be low probability. Always look for signs of strength (Bullish candle) before taking trade at these levels. I don't use limit orders for such a trade.
Currently the price is taking support near 4000 psychological level (also a structure support) and trading above a HVN (4130) zone of the recent sharp sell off.
Next resistance on the chart would be the structure resistance near 4200 and then the HVN at 4265.
How do you find support and resistance on the chart?
Have you ever used Volume profiles?
Comment your views.

GOLD - ENTERS COREECTION PHASESymbol - XAUUSD
Gold is currently undergoing a corrective phase following approximately six weeks of aggressive upward movement. Price action is forming a consolidation range while continuing to pressure the support zone.
The recent record breaking rally became overheated, prompting profit-taking and long liquidation. Additionally, a gradual shift in market sentiment and macroeconomic backdrop is contributing to capital outflows. However, ongoing US–China trade negotiations, the US government shutdown, and heightened geopolitical uncertainty, including the cancellation of Trump’s meeting with President Putin, continue to pose economic risks that could provide underlying support for the precious metal.
Overall, the current pullback appears to be a healthy corrective pause within the broader structure. The 4000 level remains a critical support area. A sustained recovery above 4110 would indicate that buyers are interested, though further momentum largely depends on developments surrounding global trade policies.
Resistance levels: 4100, 4110, 4163
Support levels: 4058, 4000
A decisive breakdown of the lower boundary of the trading range could trigger a deeper corrective wave. The 4000 level is the primary focus, as strong volatility may occur around this zone. Given the current market conditions - with declines matching the previous intensity of the rally, patience is warranted until momentum stabilizes, enabling more informed technical decisions.

XAUUSD PLAN | When balanced breaks, strength leaves its mark.🔍 Market Context
After setting a short-term peak at the 4,385 – 4,372 USD zone, gold has entered a strong technical correction phase, with a series of consecutive red candles breaking the short-term upward structure.
The sellers temporarily dominate, pushing the price through the H1 upward trendline. However, the support zone below (Liquidity Zone + Order Block Bullish) is beginning to show absorption, indicating that buyers might return at discounted price zones.
💎 Technical Analysis
Previous Bullish BoS: confirms the main trend is still long-term bullish .
FVG Down Zone: 4,285 – 4,260 USD → a price imbalance zone left in the downtrend, possibly where the price may retrace to “fill the gap” before choosing a direction.
Liquidity Zone $$$: 4,222 – 4,218 USD → a short-term support zone where new buying liquidity appears.
Order Block Bullish: 4,203 – 4,185 USD → a confluence area between OB and Fibo 0.786, where large capital might return.
Deep Bullish OB: 4,142 – 4,128 USD → the last defensive zone for the main upward trend.
Order Block Bearish: 4,372 – 4,385 USD → a critical resistance zone, likely to react if the price retraces.
The current structure shows gold is in a retracement – liquidity rebalancing phase, with insufficient signals to reverse the trend.
📈 Trading Scenarios
1️⃣ Main Scenario – Buy reaction at Liquidity zone 4,222 – 4,203 USD
Entry: 4,222 – 4,203
SL: 4,185
TP: 4,260 → 4,318 → 4,372
✅ Condition: Strong rejection candle (rejection / engulfing bullish) appears at the support zone or small reversal BoS.
➡️ This is a “buy the dip” setup following the main trend, leveraging the liquidity zone and confluence OB.
2️⃣ Secondary Scenario – Sell reaction at FVG Down 4,285 – 4,260 USD
Entry: 4,260 – 4,285
SL: 4,300
TP: 4,222 → 4,203
✅ Condition: Strong bearish candle or rejection signal appears at the FVG zone.
➡️ This setup is for scalping traders or short-term shorts in the unfilled price balance zone.
⚠️ Risk Management
Do not FOMO buy when the price has not confirmed the 4,222 zone.
If the price breaks below 4,185 → wait for a re-test to continue selling towards the 4,128 zone.
Keep moderate volume, as the market is in a rebalancing phase – liquidity remains noisy.
💬 Conclusion
Gold is in a transitional phase after a strong decline .
The 4,222 – 4,203 USD zone will be key to determining whether the medium-term upward trend continues.
If this zone holds, gold is likely to retest the 4,318 – 4,372 USD zone.
👉 Reasonable Strategy:
Buy reaction at 4,222 – 4,203 USD when confirmed.
Technical Sell at FVG 4,260 – 4,285 USD if a clear rejection appears.
🔥 “When the market is unbalanced, the strongest side will leave a mark – and this time, the mark is around the 4,220 USD zone.”

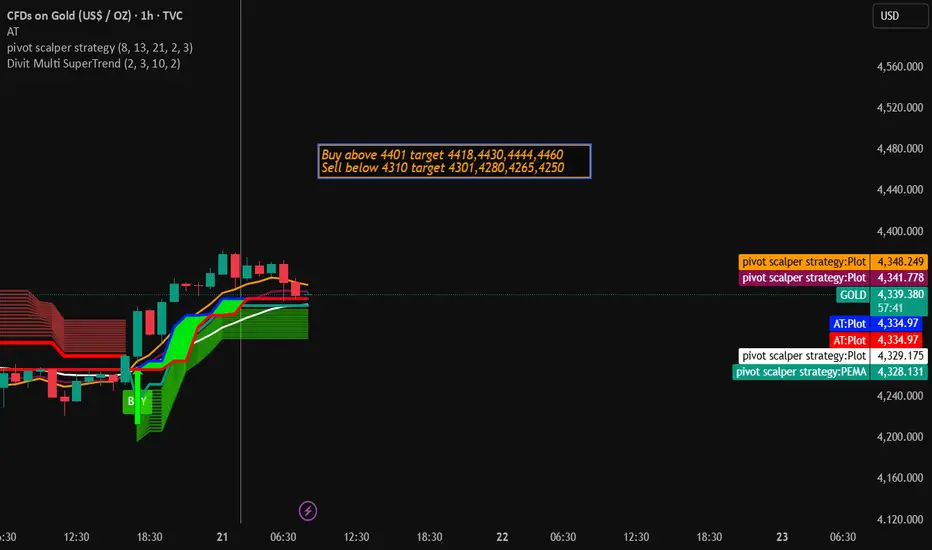
Gold Trading Strategy for 21st October 2025💰 GOLD TRADING SETUP (INTRADAY) 💰
📈 BUY Setup:
👉 Buy Above: High of 15-min candle close above ₹4401
🎯 Targets:
1️⃣ ₹4418
2️⃣ ₹4430
3️⃣ ₹4444
4️⃣ ₹4460
🛡️ Stop Loss: Below the breakout candle low
📉 SELL Setup:
👉 Sell Below: Low of 15-min candle close below ₹4310
🎯 Targets:
1️⃣ ₹4301
2️⃣ ₹4280
3️⃣ ₹4265
4️⃣ ₹4250
🛡️ Stop Loss: Above the breakdown candle high
⚠️ Disclaimer:
📢 This analysis is for educational and informational purposes only.
💼 Trading involves risk of capital; please do your own research or consult your financial advisor before taking any position.
💸 The author is not responsible for any profits or losses incurred from trades taken based on this information.
✨ Tip: Always wait for a proper candle close and confirmation before entry. Manage risk wisely! 🧠💹
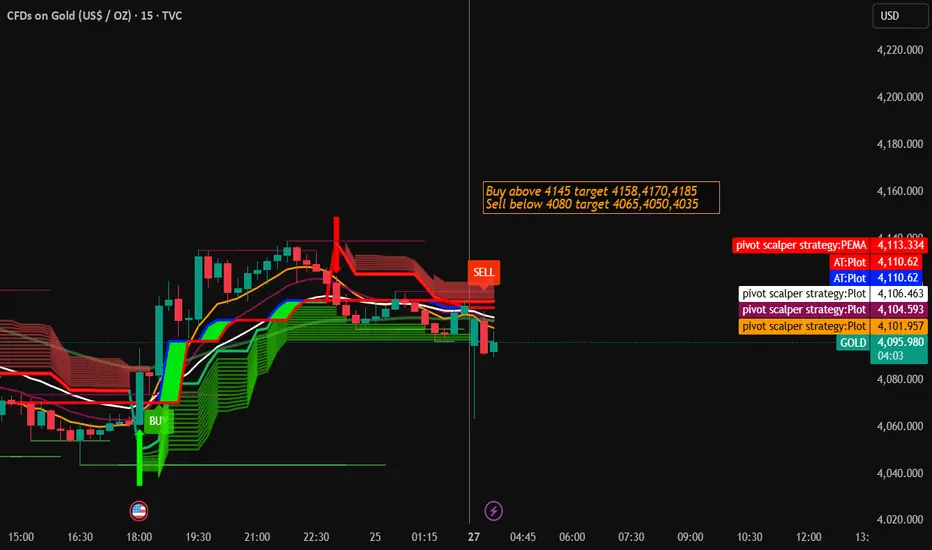
Gold Trading Strategy for 27th October 2025🪙 GOLD ($XAU/USD) Trading Plan
📈 Buy Setup
Entry: Buy above the high of the 30-minute candle, only if price closes above $4145
Targets:
🎯 1st Target: $4158
🎯 2nd Target: $4170
🎯 3rd Target: $4185
Stop Loss: Below the breakout candle’s low
Notes:
A strong close above $4145 could indicate bullish momentum continuation. Watch for volume confirmation before entry.
📉 Sell Setup
Entry: Sell below the low of the 1-hour candle, only if price closes below $4080
Targets:
🎯 1st Target: $4065
🎯 2nd Target: $4050
🎯 3rd Target: $4035
Stop Loss: Above the breakdown candle’s high
Notes:
A decisive close below $4080 may trigger a downside move — confirm with bearish momentum before taking a short position.
⚠️ Disclaimer
📜 This analysis is for educational and informational purposes only and does not constitute financial advice. Trading involves substantial risk, and you should consult your financial advisor before making any investment decisions. The author is not responsible for any losses incurred while following this analysis.
GOLD SHOWING A GOOD UP MOVE WITH 1:10 RISK REWARD GOLD SHOWING A GOOD UP MOVE WITH 1:10 RISK REWARD
DUE TO THESE REASON
A. its following a rectangle pattern that stocked the market
which preventing the market to move any one direction now it trying to break the strong resistant lable
B. after the break of this rectangle it will boost the market potential for break
C. also its resisting from a strong neckline the neckline also got weeker ald the price is ready to break in the outer region
all of these reason are indicating the same thing its ready for breakout BREAKOUT trading are follws good risk reward
please dont use more than one percentage of your capitalfollow risk reward and tradeing rules
that will help you to to become a bettertrader
thank you

XAUUSD/GOLD WEEKLY SELL PROJECTION 26.10.25Here’s a clear explanation of the 4H SELL SETUP shown in your chart 📊👇
📌 Chart Breakdown (XAU/USD — Gold 4H)
Pattern: Rising wedge / structure breakdown
Trendline: “4H Uptrend Line – Broken” ✅
Candle signal: Bearish Engulfing at ATH (strong reversal confirmation)
🧭 Key Levels
🟥 Stop Loss: Around 4,225.640 (above structure high)
🟡 Entry Zone: ~4,192 (below trendline break)
🟢 Targets:
TP1: 4,125
TP2: 4,075
TP3: 4,031
🧠 Trading Logic
Market formed a Bearish Engulfing at the top.
The main trendline was broken, indicating possible trend reversal.
After a retest of the broken structure, price is expected to continue downward.
Multiple TPs (TP1, TP2, TP3) help scale out profits gradually.
SL is placed above the previous high to protect against a fake breakout.

XAU/USD: Channel Breakout → Retest → Downside Target at 3,940Pair: Gold Spot (XAU/USD)
Timeframe: 1-hour
Current Price: 4,253.975
Trend: Recently broke out of an ascending channel (bearish signal)
📉 Chart Breakdown
1. Ascending Channel (Trade Lines)
Price was moving steadily inside a rising channel, indicated by the two parallel yellow “TRADE LINE” levels.
The break below the lower trade line suggests weakening bullish momentum and potential trend reversal.
2. Resistance Level (4,320 – 4,360 zone)
Marked in purple, this zone served as a key resistance.
Price rejected strongly from this area, confirming seller presence.
3. Structure Retest and Potential Move
After the channel break, price retraced back to retest the broken channel support (now resistance).
The projected blue path shows a lower-high formation followed by a new drop, completing a bearish continuation pattern.
4. Target Zone
The projected target is near 3,940.693, aligning with previous structure support.
This level could serve as a profit-taking area for short positions.
📊 Summary of Key Levels
Zone Type Range / Level
4,320 – 4,360 Resistance Strong supply zone
4,220 – 4,240 Retest zone Potential short entry area
3,940 Target Bearish target / demand zone
⚙️ Trading Plan Concept (Hypothetical)
Bias: Bearish
Entry Idea: Wait for rejection from 4,220–4,240 zone.
Stop Loss: Above 4,280 (resistance)
Take Profit: Around 3,940 (target)
Risk/Reward: Approximately 1:3 or better
🧭 Conclusion
The chart suggests that Gold (XAU/USD) might be entering a corrective bearish phase after failing to sustain its bullish channel. A retest of broken structure before another drop aligns with typical market structure behavior. EURONEXT:AXFZ2025 EURONEXT:FMXX2025 EURONEXT:QL6X2025 EURONEXT:RH6X2025 EURONEXT:VV8Z2025 EURONEXT:2FTX2025

Gold's Historic Crash! MSS $4195: Kindly Wait for SELL at $4185📰 FUNDAMENTALS (Context is Key)
Gold has seen a massive drop—sharpest since 2013, mind you—after hitting that record high of $4,398. This steep fall is primarily technical profit-booking, not any major panga (trouble) on the macro side. The core drivers (inflation, uncertainties) for Gold are still intact, pakka (surely), for the long term. However, short-term, a good correction is compulsory.
📊 TECHNICALS (1H Chart Basis)
Market Structure Shift (MSS) Done: The price has given a proper Breakout of the strong support at $4,195 - $4,200. This zone is now our New Resistance—the best place for selling, no doubt.
The market is currently undergoing a Technical Pullback.
🎯 DETAILED TRADING PLAN (Actionables)
Our main focus is to SELL at the Resistance re-test, which aligns nicely with the changed market structure.
1. SELL Strategy (Pro-structure Trade)
SELL ZONE: $4183 - 4185
SL (Stop Loss): $4193
TP (Take Profit): $4175 - 4165 - 4155 - 4145
2. BUY Strategy (Counter-trend Scalp)
BUY ZONE: $4060 - 4055
SL (Stop Loss): $4030
TP (Take Profit): $4091 - 4114 - 4185
🔥 Expert Mandate: Kindly wait for the price to revert to the $4183 - 4185 zone. That is where you Do the needful and look for a SELL (Short) setup. The Risk-Reward is quite handsome.
Please ensure strict risk management (1-2% capital) is followed.
What is your good name for this market? BUY or SELL? Leave your comments and Kindly Follow for the timely updates!
#XAUUSD #GOLD #Forex #TradingView #TechnicalAnalysis
