Gold Buy EntryGold has given good sell and requires a short correction as well looking into 4hr time frame double top and can come back neck line and go for short again - logic.
Good break of Trendline and pattern gave confirmation for buy target -
1) 4147
2) 4200
Trade ideas

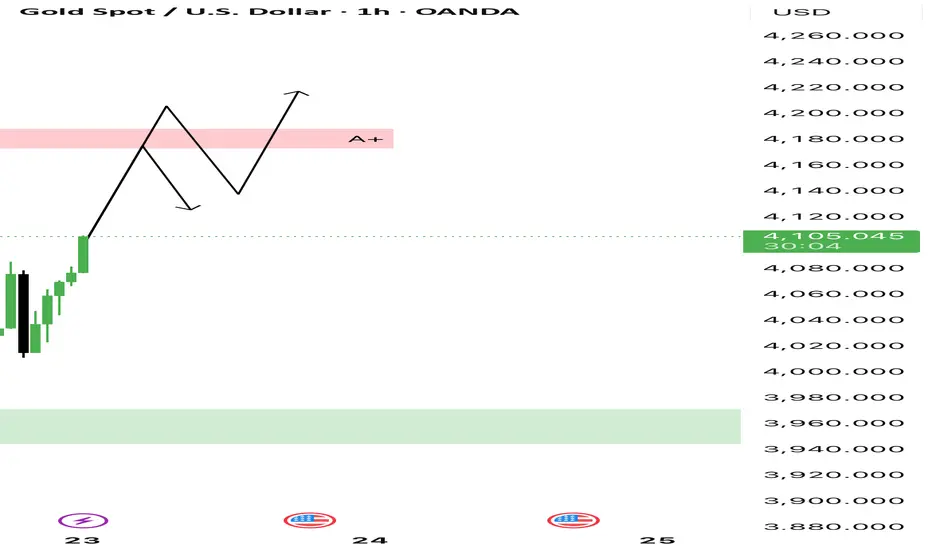
Trade Setup Explanation (Elliott Wave Correction)This chart shows a corrective wave structure (A–B–C), indicating that the market has likely completed its downward correction phase and is now gearing up for a potential bullish continuation.
• Wave (A) – Strong bearish leg marking the start of the correction.
• Wave (B) – A temporary pullback before continuation lower.
• Wave (C) – Final push down completing the correction, ending near the green demand zone (3,950–3,980).
• After the completion of Wave (C), buyers are showing strength, pushing price back above the short-term structure.
• The pink zone represents a key supply / resistance area where price may react or consolidate before the next move up.
📈 Trade Idea:
Wait for a retest and bullish confirmation around the pink zone (previous resistance).
If the market holds and forms higher lows, a potential long setup targeting new highs (above 4,200) could form.
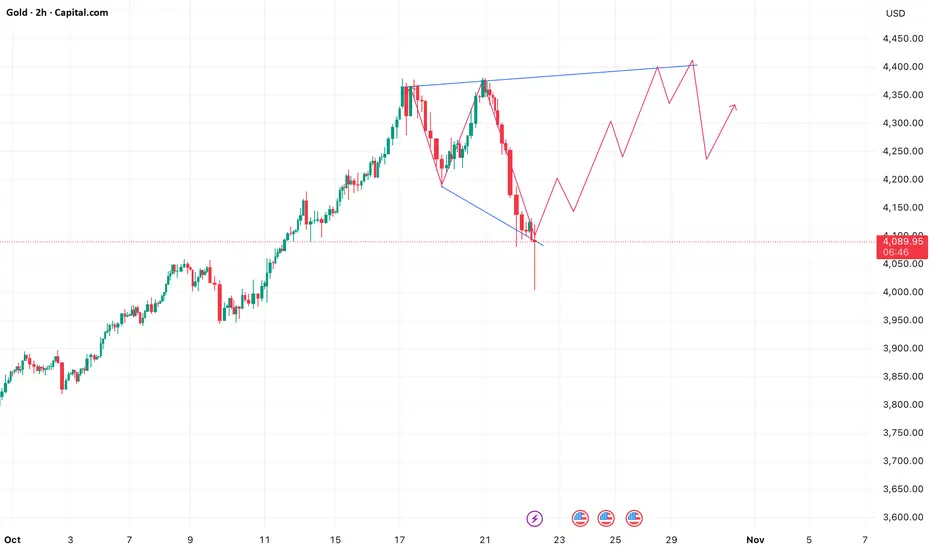
Gold’s Double Trouble: Will the Bounce Hold or Break Below?#Gold hit a double top after a parabolic rally, topping at 4380.99 and 4381.44 , forming a classic M-pattern . Breakdown below 4185.91 confirmed the bearish structure, and price nearly completed the pattern target by testing the long-term ascending trendline , leading to a technical bounce.
👀 Now, all eyes are on the key zones:
🔸 Critical Resistance: 4185.91 – 4205.12
🔸 Critical Support: 3944.435 (green line)
📉 Break below the support (4HCB) could trigger further bearish continuation .
📈 Break above the resistance zone (4HCB) could open doors to retest All-Time Highs (ATH) .
🧭 These are your trend-deciding levels – stay sharp!
#XAUUSD | #Gold | # TVC:GOLD | #GoldAnalysis | #DoubleTop | #Mpattern | #ChartPatterns | #PriceAction | #TrendDeciderLevels | #KeyLevels | #BullVsBear
📌 Disclaimer: This analysis is shared for educational purposes only. It is not a buy/sell recommendation. Please do your own research before making any trading decisions.

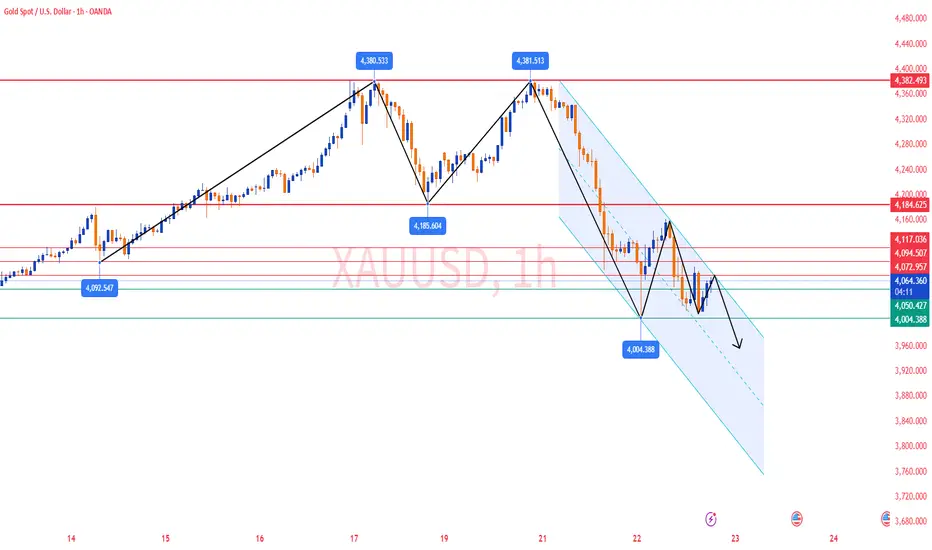
Gold Analysis and Trading Strategy | October 22-23✅ Gold Analysis from 4-Hour Chart:
Gold reached a high of 4381.40, then pulled back and broke through several support levels, forming a downtrend. The current price is near 4050, which is a key support zone. If gold remains around this level, a rebound may occur.
Moving Averages: MA5 has crossed below MA10, and both MA20 and MA50 show a downtrend, indicating that gold may continue to pull back in the short term. The price is between MA20 and MA50. If gold continues to decline and breaks below the 4050 support, it may further test 4004.38 or 3945 support zones.
✅ Gold Analysis from 1-Hour Chart:
After forming a double-top pattern, gold quickly pulled back, signaling that gold has entered a correction phase. Currently, gold is oscillating near the support zone, and if the support holds, a rebound could happen.
The price is near the middle band of the Bollinger Bands at 4082.44 and close to the lower band at 3998, suggesting that gold is in a consolidation range and has not broken through key support or resistance levels. If gold breaks below the lower band, it may continue to decline.
🔴 Resistance Levels: 4072 / 4094 / 4117
🟢 Support Levels: 4050 / 4004 / 3995
✅ Trading Strategy Reference:
🔰 If gold fails to break 4072 and falls below 4052, consider going short, targeting 4004-3995.
🔰 If gold breaks 4072 and holds above it, consider going long, targeting 4094-4117.
✅ Gold is currently consolidating in the support zone. If the 4050 support holds, a rebound may occur. However, if the support breaks, it may continue to decline to lower support zones. Monitor the breakout of resistance levels and adjust your strategy accordingly.
XAUUSDGold has seen a good rally and has seen a very good and impressive move in the last 4 months. In such a situation, some profit booking is acceptable. I feel that the total correction will not be more than 10-12%. How do you feel?


Elliott Wave Analysis – XAUUSD (October 22, 2025)
🔹 1. Momentum
D1:
The D1 momentum is preparing to turn bullish, signaling the start of a new upward trend.
→ We can expect at least 3–5 consecutive bullish days ahead.
H4:
We need to wait for the H4 candle to close to confirm the reversal signal.
If confirmed, there’s a strong possibility that today will form an intraday uptrend.
H1:
H1 momentum has already turned upward, but it’s now in the overbought zone.
Therefore, the current rise won’t be strong, and a minor pullback is needed to bring momentum back to the oversold area — creating a foundation for a more stable bullish move.
________________________________________
🔹 2. Wave Structure
D1 Timeframe:
Yesterday saw a sharp decline, but D1 momentum is now preparing to reverse upward.
Counting the correction candles, we already have five candles, suggesting that the market may soon enter a new bullish phase lasting 3–5 days or more.
During this recovery phase, we need to monitor two key scenarios:
• If wave movements overlap and lack strength, and when D1 momentum returns to the overbought zone but price fails to break the previous high, then the Wave 4 (yellow) scenario is still in play.
• If price rises sharply and decisively, the recent correction might only be part of Wave 3 (yellow), meaning the bullish trend is continuing.
H4 Timeframe:
Yesterday’s structure was identified as a Flat correction, and it remains valid.
Price has retraced into the Wave 4 zone of the smaller degree structure, reaching the 2.0 Fibonacci extension of Wave A.
If Wave 5 (purple) is now developing, the ideal target would be around 4476.
However, if price rises with overlapping waves, this could instead represent a corrective move within Wave 4 (yellow), targeting the previous high zone between 4381 and 4476.
H1 Timeframe:
Within Wave W, there is a small Flat correction, where Wave C extended to twice the length of Wave A.
Now, Wave Y (blue) has also declined to 2× Wave W, suggesting weakening buying power.
Even so, in the short term, we still expect an intraday bullish move today.
→ The trading bias remains buy-side until H4 momentum reaches the overbought area and reverses.
________________________________________
🔹 3. Trading Plan
Buy Zone: 4101 – 4098
Stop Loss (SL): 4088
Take Profit 1 (TP1): 4190
________________________________________
🔹 4. Notes
Liquidity and resistance zones are already marked on the chart.
→ Wait for price to break and retest those areas to confirm a valid Buy setup.

$4,381 WAS THE FAKE TOP? Gold -5.5%: MSS Confirms SELL!XAU/USD Solid Analysis: Historic Dump and Structure-Based Trade Setup!
1. Fundamental Shock Analysis (Market ka Bhaav)
Gold's massive 5.5% fall from its All-Time High (ATH) of $4,381 is a big profit-booking spree after that superb 60% rally this year. This correction was full-on and was pushed by:
USD is Strong: Dollar index ne zor pakda (gained strength), making Gold less attractive.
Sentiment Change: Market ka bhaav (market sentiment) shifted to Risk-On.
The Gist: This is basically a Liquidity Sweep, yaar. They are washing out the weak players before the next big move.
2. Technical Analysis (MSS & Execution)
The price action has given a pakka (confirmed) signal: Trend to change ho gaya hai (The trend has changed)!
MSS Confirmed: The Market Structure Shift (MSS) is locked at $4,254.549. This is our Supply Zone now—the key resistance for the bears.
Demand Testing: Gold is trying to hold the current Order Block (OB) at $4,077.
Preferred Strategy: SELL as per the MSS structure. This is the main funda (fundamental principle) now.
Optimal SELL Zone: Wait for the retracement to the Supply Zone $4,254.549 (A great limit order setup).
Target (TP):
TP 1: $4,008 (The crucial psychological $4k level).
TP 2: $3,944 - $3,904 (Strong support ka area).
Stop Loss (SL): Tight SL above $4,260 (Protecting the MSS point, no compromise).
Conclusion: Bhaiyon, don't get trapped by the small bounce. $4,254.549 is the high-conviction point for a short trade on Gold!
#GOLD #XAUUSD #MSS #LiquiditySweep #SELLSignal #PakkaTrade

XAU/USD (Gold vs USD) 4H chart:XAU/USD (Gold vs USD) 4H chart:
I can see a clear double top pattern near the 4,330 zone (circled areas).
Price has broken the ascending trendline and is currently retesting near the 4,080–4,100 resistance zone (previous support).
The green zone shows the neckline area that price already broke below.
📉 Technical Breakdown:
Pattern: Double Top
Neckline: Around 4,130
Measured Move Target: Equal to the distance from the top (~4,330) to the neckline (~4,130), i.e. ≈ 200 points.
Applying that below the neckline gives:
→ 4,130 - 200 = 3,930
However, my chart’s “Target Point” line is drawn slightly lower — around 3,848.57, which aligns with a deeper support level and the full projection of the trend break.
✅ Final Target Zone:
Primary Target: 3,930
Extended / Full Target: 3,850 (3,848.57)
So:
> 🎯 XAU/USD Bearish Target = 3,850 – 3,930 zone

Gold – At a Historic CrossroadGold’s price history in trading view traces back to January 1833, with the lowest price at $20.54 per ounce (Jan 1905).
The yellow metal completed its first Super Cycle Wave (I) in Jan 1980, peaking at $875 — a 42x rise from its lowest value — followed by a 20-year correction ending in Aug 1999 - Super Cycle Wave (II).
Since then, gold has been unfolding Super Cycle Degree Wave (III) as a 5-wave structure as given below:-
Sub-wave I peaked in Mar 2008 ($1032.35)
Sub-wave II completed in Oct 2008 ($681.75) ~ 38.2% retracement
Sub-wave III peaked in Sep 2011 ($1920.94) ~1.6x Wave I
Sub-wave IV completed in Dec 2015 ($1046.54) >61.8% retracement. Since then, sub-wave V has been unfolding.
It appears that Sub-wave V is now complete as a fifth-wave extension, reaching 2x the length of sub-waves I–III, peaking at $4381.48 — 4x the Wave I high.
This marks a likely completion of Super Cycle Wave (III).
Fresh long positions are not advisable at current levels.
Given the widespread interest, Gold may form a Flat corrective structure, potentially retesting or slightly exceeding its recent peak before the larger correction unfolds.

XAUUSD Pull BackXAUUSD we can expect a sell today. Price is now showing rejection. If it beaks below . Then expect a pull back and sell to the botton of the day.

technical analysis for XAU/USD (Gold) based on your chart:Chart Summary
Current Price: Around $4,140
Trend Lines: A descending trade line shows the overall short-term bearish trend.
Support Zone: Clearly marked between $4,080 – $4,120 (“SUPPORT BUY ZONE”).
Target: The upside target is labeled near $4,383.
Technical Outlook
🔹 Support Zone Reaction
Price recently dipped into the support buy zone, forming a potential bullish reversal wick.
This area is acting as a strong demand zone, attracting buyers around $4,100.
🔹 Downtrend Channel
The pair remains under a downward-sloping trade line, suggesting the short-term market bias is still bearish.
However, a breakout above this trendline could trigger bullish continuation toward the $4,383 target.
🔹 Short-Term Scenario
Bullish Case (Primary Plan):
If gold holds above the support zone ($4,080–$4,120) and breaks the trendline resistance (~$4,200),
→ next target area: $4,300–$4,383.
Confirmation comes with a clear candle close above $4,200.
Bearish Case (Alternative Plan):
If price fails to break the descending trade line and drops below $4,080,
→ possible continuation toward $4,040 – $4,000.
Key Levels
Type Level (USD) Description
🎯 Target 4,383 Major resistance / profit zone
⚔️ Resistance 4,200 Descending trendline zone
🛒 Support Zone 4,080–4,120 Demand / Buy zone
❌ Invalid Below 4,080 Break below = bearish continuation
Summary
📈 Gold (XAU/USD) is currently retesting its support zone, showing early signs of a bullish rebound.
A confirmed breakout above the trendline could lead to a rally toward $4,380.
However, losing support below $4,080 would invalidate the bullish setup and reintroduce downside risk. EUREX:FDAX1! ICEEUR:BRN1! ICEEUR:WBS1! EUREX:FESX1! EUREX:FGBL1! EUREX:FDXM1! ICEEUR:GWM1! ICEEUR:Z1! EUREX:FDXS1! EUREX:FGBM1! ICEEUR:W1! ICEEUR:RC1!

Gold 1H – Bearish Reaction After Consecutive Gains🟡 XAUUSD – Intraday Trading Plan | by Ryan_TitanTrader
📈 Market Context
After several sessions of steady gains, gold is showing signs of exhaustion as U.S. Treasury yields stabilize and traders reassess the Federal Reserve’s next move.
The market’s focus today is on U.S. housing data and Fed officials’ remarks, which could shape expectations for the December policy outlook.
• A hawkish tone from policymakers may strengthen the dollar and pressure gold lower.
• Conversely, softer remarks could briefly trigger buying around key discount zones, but the overall tone remains corrective after the recent rally.
Market liquidity is concentrated near the ₹4,230 area — where price may tap into unmitigated supply before continuing its bearish leg.
🔎 Technical Analysis (1H / SMC Style)
• Structure: The overall bias has shifted bearish following consecutive ChoCH and BOS formations.
• Premium Zone: The 4,230–4,228 area aligns with an H1 order block and previous liquidity pool — a prime zone for short re-entry.
• Liquidity Sweep: The recent upside push toward 4,230 may sweep late buyers before the next bearish leg unfolds.
• Discount Zone: Short-term liquidity may rest around 4,080–4,100, which aligns with previous sell-side imbalance (SSI) and acts as an intraday reaction zone.
🔴 Sell Setup
• Entry: 4,230 – 4,228
• Stop-Loss: 4,240
• Take-Profit Targets: 4,100 → 4,080 → 4,050+
🟢 Buy Scalp Setup (Short-Term Countermove)
• Entry: 4,081 – 4,083
• Stop-Loss: 4,074
• Take-Profit Targets: 4,100 → 4,115
(Only valid if liquidity sweep confirms reaction within discount zone)
⚠️ Risk Management Notes
• Confirm M15 BOS/ChoCH before entry — avoid blind orders during news.
• Reduce position size for scalp entries; primary directional bias remains bearish.
• Lock partial profits near first liquidity targets and trail stops as structure confirms continuation.
✅ Summary
Gold faces near-term correction pressure after multiple bullish sessions.
The 4,230–4,228 zone offers a clean premium OB entry for continuation shorts, while reactive buyers may scalp intraday from 4,081 if liquidity sweeps occur.
Stay adaptive — today’s sentiment is short-term bearish within a larger range-bound structure.
FOLLOW RYAN_TITANTRADER for daily SMC setups ⚡

XAUUSD _ 22/10/2025_ TP HIT Over all trend Bullish
1. Current day low sweep yesterday low ( POI confirmed )
2. Entry taken during London session
3. AMD formed during 4 hr candle also price took support near opening of the 4 hr candle open
4. entry in 5 min - closed full at 1:1.8
#ICT

GOLD RECOVERS: H1 Bounces at $4,150 – Sniping the Fibo SELL Zone🎯 Macro Summary & Bias: Weak USD & CPI Focus Drive Recovery
Gold price gained some traction in early European trading on Wednesday, recovering above the $4,150 level.
Primary Driver: The weaker US Dollar (USD) is currently supporting the price recovery.
Mixed Forces: Easing US-China trade tensions are putting some pressure on Gold, but this is offset by Fed rate cut expectations and general market uncertainty, which should limit the downside.
Key Event: Traders are keenly focused on the US CPI (Consumer Price Index) inflation report for September this Friday. Any sign of hotter-than-expected US inflation could lift the USD and pressure Gold in the short term.
Technical Bias: After the DOUBLE TOP DUMP and a +3000 PIPS move down, the market is now attempting a corrective rally. Our strategy is to SELL the strong Fibo/Volume resistance (Sell on Rally) before looking for the next BUY zone.
📊 In-Depth Technical Analysis (H1): Pinpointing the FIBO Reaction Levels
Based on the recent major market reversal from the Double Top and the current corrective bounce (Referencing image_43ce7f.png), we have our strategic levels:
1. Strategic SELL Zones (FIBO SELL REACT ZONES):
These are the primary resistance zones for executing SELL trades, anticipating the continuation of the post-dump correction:
REACTION FIBO 0.5 ZONE - SELL ZONE 4190 - 4200: This is the first critical resistance zone (0.5 Fibo retracement) to look for a Short entry.
REACTION FIBO - SELL ZONE BIG VOLUME for SELL SIDE 4300 - 4310: This is the major supply/liquidity zone and the ultimate target for the current corrective rally.
2. Strategic BUY Zone (ORDER BUY REACT ZONE):
This is the key support area where the previous dump found temporary relief, which we use for stop-loss or potential re-entry:
ORDER BUY ZONE 4100 - 4090: This is the immediate support zone formed after the dump, which is currently holding the price.
📈 TODAY'S ACTION PLAN
Primary Action (Prioritize SELL on Rally): Wait for the corrective bounce to reach the REACTION FIBO 0.5 ZONE - SELL ZONE 4190 - 4200.
Short Entry: Execute the SELL entry upon confirmed reversal candles (H1/M30/M15) in the 4190 - 4200 zone.
Targets (TP): Aim to retest the recent low and the LIQUIDITY PUMP area.
Contingency BUY: If price breaks decisively above 4200, the rally may extend to the BIG VOLUME SELL ZONE 4300 - 4310.
⚠️ Risk Warning
Risk Management: Place Stop Loss (SL) above the 4200 zone for the short entry. Watch the US CPI report on Friday closely, as inflation data could cause extreme volatility.
Wishing all FranCi$$_FiboMatrix traders a disciplined and victorious day!

How Professional Traders Trade Smartly Introduction
Professional traders operate in highly competitive and dynamic markets, where success requires a combination of technical expertise, psychological discipline, risk management, and continuous learning. Unlike casual or retail traders, pros approach trading systematically, treating it as a business rather than a hobby. Their strategies focus not just on making profits but on preserving capital, optimizing risk-adjusted returns, and adapting to ever-changing market conditions. This essay explores how professional traders trade smartly and grow their trading business.
1. Developing a Strong Trading Mindset
The foundation of professional trading lies in psychology. Market behavior is often unpredictable, driven by collective human emotions such as fear, greed, and uncertainty. Pro traders cultivate a mindset that allows them to stay rational and disciplined even in volatile conditions.
Emotional Discipline: Professionals avoid impulsive decisions. They follow their trading plan strictly, resisting the temptation to chase losses or over-leverage positions.
Patience and Consistency: They understand that profitable trades come from patience, waiting for high-probability setups rather than forcing trades.
Acceptance of Losses: Losses are inevitable. Pros treat them as a cost of doing business and focus on minimizing them rather than trying to eliminate them entirely.
2. Comprehensive Market Knowledge
Professional traders have deep knowledge of the markets they trade in, whether equities, commodities, forex, or crypto.
Market Structure Awareness: They understand order flows, liquidity zones, support and resistance levels, and macroeconomic factors influencing prices.
Asset-Specific Knowledge: A trader specializing in tech stocks, for instance, studies earnings reports, industry trends, and regulatory impacts.
Global Economic Awareness: Professionals track global news, monetary policies, geopolitical events, and market correlations that can affect their trades.
This deep understanding enables them to make informed decisions and anticipate market movements rather than reacting blindly.
3. Strategic and Technical Approach
Professional traders rely on structured strategies to increase their probability of success.
Technical Analysis: They use charts, patterns, indicators, and volume analysis to identify entry and exit points. Tools like moving averages, RSI, MACD, and Fibonacci retracements help in precise decision-making.
Fundamental Analysis: Long-term traders evaluate financial statements, economic indicators, and company performance to assess the intrinsic value of assets.
Algorithmic and Quantitative Strategies: Some professionals leverage algorithmic trading and quantitative models to automate trades, reduce emotional bias, and exploit market inefficiencies.
Diversification of Strategies: Pros rarely depend on one strategy. They maintain multiple strategies suitable for trending, range-bound, or volatile markets.
4. Risk Management Mastery
Risk management separates successful traders from amateurs. Professionals prioritize capital preservation over chasing high returns.
Position Sizing: They calculate the exact size of each trade to ensure no single loss can drastically affect their portfolio.
Stop-Loss and Take-Profit Orders: Smart traders define exit points before entering a trade, ensuring losses are limited and profits are systematically captured.
Risk-Reward Ratios: They target trades with favorable risk-reward ratios (e.g., risking $1 to gain $3), improving long-term profitability.
Hedging: Advanced traders use options, futures, or other instruments to hedge positions against market volatility.
Effective risk management allows them to survive losing streaks and remain consistent over time.
5. Technology and Tools Utilization
Professional traders leverage modern technology to enhance decision-making and execution efficiency.
Trading Platforms: High-speed platforms provide real-time data, charting tools, and fast execution capabilities.
Market Scanners: Tools to identify trade setups based on pre-defined criteria save time and increase efficiency.
News Feeds and Economic Calendars: Real-time news helps traders react to events before the market fully adjusts.
Backtesting Software: Professionals test strategies on historical data to evaluate performance before committing real money.
6. Continuous Learning and Adaptation
Financial markets are dynamic, requiring traders to adapt constantly.
Learning from Past Trades: They maintain trading journals, reviewing winning and losing trades to identify patterns, mistakes, and improvements.
Education: Pro traders invest in courses, mentorship, and seminars to stay updated with new strategies and market trends.
Adapting Strategies: When market conditions change (e.g., low volatility, high inflation, or geopolitical uncertainty), professional traders adjust their strategies to remain profitable.
7. Networking and Market Intelligence
Trading is not only about charts; it’s also about information.
Professional Networks: Pros connect with other traders, analysts, and mentors to exchange ideas and insights.
Market Sentiment Analysis: Understanding crowd psychology and institutional behavior allows professionals to anticipate major market moves.
Information Advantage: Being aware of earnings reports, policy changes, or macroeconomic data before the market reacts can provide an edge.
8. Building Capital and Growing Professionally
Smart trading is also about business growth, not just trading skill.
Compounding Gains: Profits are reinvested systematically, using compounding to grow capital over time.
Scaling Trading Strategies: Successful strategies are scaled gradually to handle larger capital without increasing risk disproportionately.
Diversifying Income Streams: Professionals may expand into multiple markets, asset classes, or even start advisory services.
Brand and Reputation: Long-term success allows pros to manage external funds, run hedge funds, or attract institutional clients.
9. Avoiding Common Pitfalls
Professional traders are aware of mistakes that can destroy accounts.
Overtrading: Trading too frequently or with excessive leverage reduces profitability.
Emotional Biases: Greed, fear, overconfidence, and revenge trading are avoided through discipline and pre-defined rules.
Following the Crowd Blindly: Pros make independent decisions based on data, not hype or rumors.
Ignoring Risk Management: Even a few careless trades without proper stops can offset months of gains.
10. Case Studies of Professional Trading
Examining successful traders provides insight into smart trading practices.
Paul Tudor Jones: Focused on macroeconomic trends and disciplined risk management.
George Soros: Known for his speculative strategies with clear exit plans and risk control.
Ed Seykota: Advocated trend-following and strict discipline in trading systems.
Modern Algo Traders: Use high-frequency algorithms to capture small inefficiencies across multiple markets, showing how technology amplifies traditional strategies.
These examples highlight that consistent success comes from discipline, intelligence, and adaptation rather than luck.
Conclusion
Professional traders succeed by combining knowledge, strategy, psychology, risk management, and technology. They treat trading as a disciplined business, not a gamble, focusing on capital preservation, high-probability setups, and long-term growth. Through continuous learning, adaptation, and networking, they stay ahead in competitive markets. Smart trading is thus a blend of science and art—where skill, patience, and discipline turn opportunities into sustainable profits. By leveraging these practices, traders can steadily grow both their capital and professional stature, building a resilient and profitable trading career.
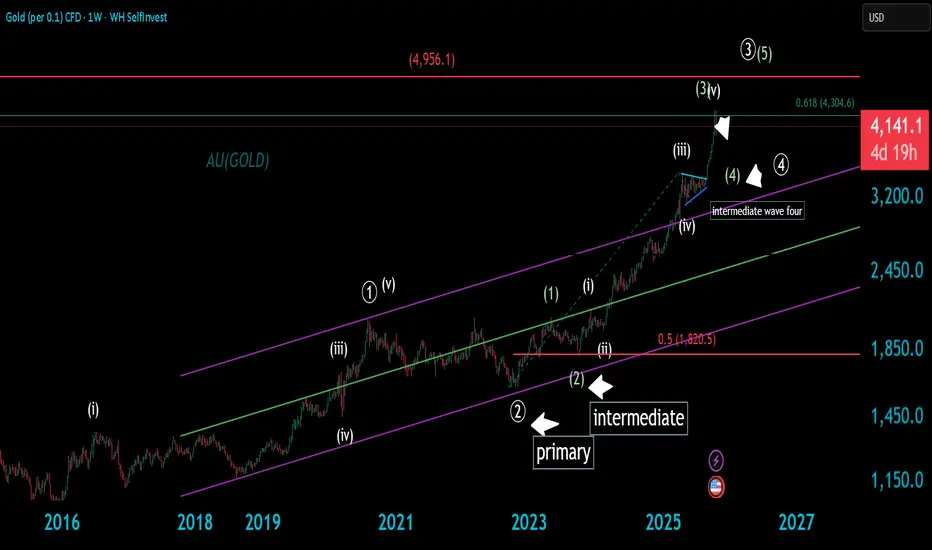
Intermediate wave 4 correction.As expected earlier Gold shoot over 4308 but ultimately fell below it ,next day we had got a good green candle however volume was not huge probably indicating local buying. This chart is weekly time frame not shown that. It seems C wave of correction is in progress. Intermediate 3rd wave is completed around 4308 now 4 th wave is in progress. Still Gold has left with primary 3 rd and 4th wave. This on going intermediate 4 th wave might take time.we can see intermediate 2nd wave had taken several weeks to complete and had retraced 50 percent of corresponding 1st wave. Let us observe how this 4th wave unfolds. Please go through my other posts of Gold and see their accuracy.
follow me to get updates.
like this post if it helps you.
Support and Resistance with Volume ProfileWe generally say that Support and Resistance are the levels from where price reacts sharply. But have you ever imagined why price takes support and resistance from specific levels?
That's where Volume Profile comes into play.
Normally I use FRVP which can work on a Fixed Range (wave) instead of a session or visible range (we also have Session Volume profile and Visible Range Volume profiles in Tradingview).
After drawing VP for a fixed range, I look for high volume nodes (HVN). You can simply find those levels through long rectangular areas visible on the profiles. Large rectangles mean high volume activity at particular level.
Huge volume activity means big boys were interested in there and large number of contracts changed hands at that level. These levels act as a magnet and price often tests these levels and take support or resistance (as the case may be) and reacts.
In the above chart, notice when the price reacted from 4380 highs, it took support at HVN and reacted, forming a structure support, to form a new high 4381.
It is best to look for buying selling opportunities on the first touch of HVN areas. The second or third touch may be low probability. Always look for signs of strength (Bullish candle) before taking trade at these levels. I don't use limit orders for such a trade.
Currently the price is taking support near 4000 psychological level (also a structure support) and trading above a HVN (4130) zone of the recent sharp sell off.
Next resistance on the chart would be the structure resistance near 4200 and then the HVN at 4265.
How do you find support and resistance on the chart?
Have you ever used Volume profiles?
Comment your views.

Gold Whats Next??gold rally lasted 4 years everytime in the past , and are trapped for years
Disclaimer- Just my view and opinion trade at your own risk not an investment advice these are only for educational purposes

Gold (XAU/USD) Sell Trade Analysis1. Technical Rationale for a Sell (Short) Setup
Rejection from All-Time Highs (ATH): Gold recently printed an all-time high around $4380. The sharp, rapid reversal from this level is a classic sign of profit-taking and potential exhaustion in the immediate uptrend, often forming a possible Double Top on the higher timeframes (e.g., 4-Hour, Daily).
Trendline Break: The recent sell-off broke below a significant ascending trendline/channel on intraday and possibly 4-hour charts, signaling a near-term shift in market structure from bullish to bearish.
Key Resistance Test: The price is currently finding resistance near the previous key support and psychological round numbers that were broken during the recent sharp drop. This zone is a likely area for sellers to re-enter the market.
2. Trade Setup Details
Parameter Recommended Zone (Approx.) Rationale
Entry Zone (Sell Limit/Market) $4200 - $4225 This is a major psychological and former support area. It also aligns with the "Neckline" of the potential Double Top pattern and key structural resistance from which the previous drop initiated.
Stop Loss (SL) $4240 - $4250 Placing the SL safely above the main short-term resistance and the high of the current pullback, which would invalidate the immediate bearish outlook.
Target 1 (TP1) $4100 - $4095 This level represents the low of the initial sharp sell-off (the Double Top's neckline) and a key psychological round number, which is a common immediate target for profit-taking.
Target 2 (TP2) $4020 - $4000 A break below TP1 clears the path to the major psychological support at $4000. This also aligns with the typical "Measured Move" target of the Double Top pattern.
Export to Sheets
3. Key Levels to Watch
Level Type Significance
Immediate Resistance $4225 High of the current bounce/re-test area.
Critical Resistance $4380 All-Time High (ATH) and top of the potential Double Top. A close above this invalidates all bearish structure.
Immediate Support $4100 Key psychological and structural support (Neckline).
Major Support $4000 Major psychological round number, a long-term anchor.
Export to Sheets
4. Risk Management Note
The overarching long-term trend for Gold is still considered bullish due to global economic uncertainty and central bank rate cut expectations. This Sell Trade is a counter-trend or short-term correctional trade.
Only enter with confirmation (e.g., a bearish candlestick rejection on a lower timeframe like 1-Hour or 4-Hour once the price hits the entry zone).
Risk Management is paramount: Do not risk more than 1-2% of your capital on this single trade\
Disclaimer: Trading is highly risky. This analysis is for informational purposes and is not financial advice. Always use a Stop Loss and manage your risk.

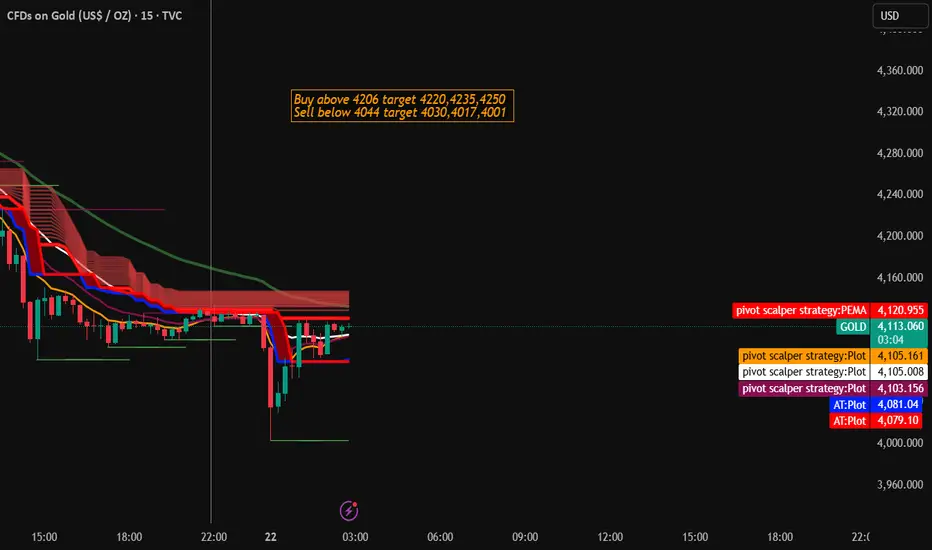
Gold Trading Strategy for 22nd October 2025🌟 GOLD INTRADAY LEVELS (22 OCT 2025) 🌟
📊 Buy Setup:
🟢 Buy Above: High of 15-min candle (Close above ₹4206)
🎯 Targets:
➡️ 1️⃣ ₹4220
➡️ 2️⃣ ₹4235
➡️ 3️⃣ ₹4250
🛑 Stop Loss: Below ₹4190 (or as per your risk appetite)
📉 Sell Setup:
🔴 Sell Below: Low of 15-min candle (Close below ₹4044)
🎯 Targets:
➡️ 1️⃣ ₹4030
➡️ 2️⃣ ₹4017
➡️ 3️⃣ ₹4001
🛑 Stop Loss: Above ₹4060 (or as per your risk tolerance)
💡 Trade Logic:
The levels are based on 15-minute candle confirmation — enter only after candle closes above or below the breakout level for better reliability. Avoid impulsive entries during volatile spikes.
⚠️ Disclaimer:
📘 This analysis is for educational and informational purposes only. It is not investment advice.
💰 Trading in commodities or derivatives involves significant risk. Please consult your financial advisor before taking any trades.
📉 Trade at your own risk.
GOLD is in it’s early pattern formation Gold expecting to go up from its current levels. Presently it is early pattern formation. Pattern may be either expanding triangle or complex diamond formation etc. need to closely watch current movement in gold.