Gold Declines as Sellers Dominate the MarketGold is undergoing a controlled correction phase after an extended period of sustained gains. Market behavior over recent sessions reflects a shift from expansion to contraction as liquidity flow decreases and momentum weakens across key time horizons.
The previous upward cycle attracted substantial speculative interest, but current market dynamics suggest profit-taking by institutional participants and reduced accumulation from large holders. The recent structural shift confirms that sentiment has turned defensive, aligning with global market caution amid evolving economic conditions.
Despite short-term consolidation, the broader setup indicates that gold remains sensitive to global financial stability concerns and policy signals. Market participants are now waiting for clarity on upcoming economic data and interest rate outlooks, which could determine whether the correction deepens or transitions into a new accumulation phase.
In the near term, volatility is expected to remain elevated as investors reassess exposure levels. The prevailing outlook maintains a cautious bias, with traders closely observing how price reacts to continued shifts in liquidity and macro sentiment. Sustained capital outflow from hedge assets could pressure gold further, while renewed demand for safety could limit downside potential in the medium term.
Trade ideas

Gold (XAU/USD) 4H Chart Analysis – Short-Term Reversal from ?Technical Overview:
Gold has recently rebounded from a High Demand Zone around the $3,900–$3,910 region, showing clear signs of buyer re-entry after a prolonged bearish correction. The candle structure suggests strong bullish intent, with higher lows forming and a potential continuation toward the next liquidity area.
Key Observations:
🔹 High Demand Zone: Price reacted strongly here, indicating institutional buying pressure.
🔹 High Prop POI (Point of Interest): Served as a key accumulation level before the breakout.
🔹 SMC Trap: Indicates a prior liquidity grab, trapping late sellers before the move up.
🔹 Bullish Momentum Building: Consecutive bullish candles after rejection from the demand zone strengthen the reversal bias.
Target Projection:
🎯 Immediate Target: $4,080 – $4,100 (aligned with local resistance and liquidity grab zone).
🛑 Support: $3,905 (must hold to maintain bullish structure).
💎 Extended Target (if momentum continues): $4,160 – $4,180 (previous major swing high zone).
Summary:
Gold is showing a short-term recovery phase within a broader bullish structure. A confirmed 4H close above $4,030 would likely propel price toward the $4,100 region, while a drop below $3,900 would invalidate the bullish setup.
📊 Suggested Title:
"Gold Rebounds from Key Demand Zone, Eyes $4,100 Resistance 🔥"

XAUUSD SUPPORT, RESISTNACE & TRENDLINE ANALYSIS I hope whosoever followed my levels should have captured some good moves.
My levels will remain the same as last times.
The bias is now Bullish. Let it break 4025.25 for an up move towards 4044 and breaking that would lead to 4091.25 or 4100.
Note: If it only breaks 3953 then only we can plan for downside

DAILY TRADING PLAN — GOLD (XAU/USD) | Pullback Buy Zones 🧭 DAILY TRADING PLAN – GOLD (XAU/USD)
Date: Oct 29, 2025
Main timeframe: M15 – M30
Strategy: SMC + Trendline + Fibo confluence
🧩 MARKET CONTEXT
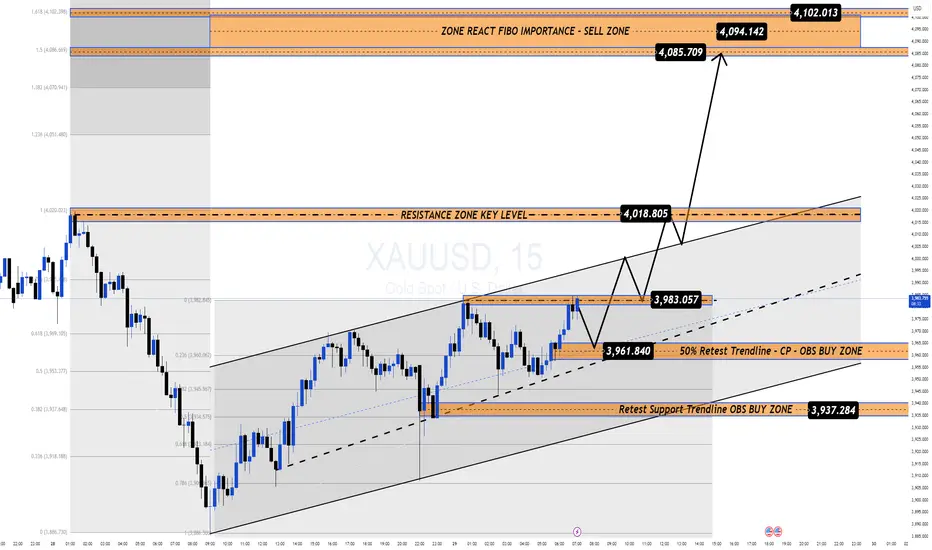
Price created a BOS at 3983, indicating short-term bullish momentum within an ascending channel. The current structure supports pullback buys from demand / OB zones before targeting key resistance levels 4018 → 4085–4102 (Fibo reaction zone).
🎯 TRADE SETUPS
1️⃣ BUY #1 (Preferred – Retest Trendline / CP)
Entry: 3961
SL: 3955 (6 pts)
TP1: 3983
TP2: 4018
Structure-based retest at 50% trendline + CP zone
2️⃣ BUY #2 (OBS / OB Zone)
Entry: 3934 – 3932
SL: 3928 (6 pts)
TP1: 3983
TP2: 4018
TP3: 4085 – 4102 (extension target)
3️⃣ SELL (Counter-trend only)
Entry: 3992 – 3994
SL: 4000 (6 pts)
TP1: 3934
TP2: 3910
Use only if there is a clear rejection candle around the 3990s zone.
📈 BIAS
Short-term bullish while above 3930–3910.
Watch 3961 / 3932 zones for buy reactions.
Shorts valid only if strong rejection occurs at 3990s.

Part 1 Ride The Big Moves What Are Options?
An option is a financial contract that gives the buyer the right, but not the obligation**, to buy or sell an underlying asset at a predetermined price (called the strike price) before or on a specific date (the expiry date).
Options are categorized into two types:
Call Option: Grants the holder the right to buy the underlying asset.
Put Option: Grants the holder the right to sell the underlying asset.
For example, if an investor believes a stock’s price will rise, they might buy a call option. Conversely, if they expect the price to fall, they might buy a put option.

Upcoming Event AnalysisLets See.
Xauusd ahead of Fed seems neither Bullish or Bearish.
Watchout your Capital.
Small quantity will give max profits today.
Trade Safe👍

XAUUSDI was looking for long in Gold was waiting for Trendline break and demand was already there so it broke and triggered my buy please find my setup

Gold Recovers 1000 Pips Ahead of FOMC: Key Levels in Focus📊 Market Overview
After a sharp selloff that shook long positions, Gold has rebounded nearly 1000 pips, recovering from the 388x area toward 398x ahead of the upcoming FOMC meeting.
Despite the short-term recovery, Gold remains down around 3.5% this week, showing caution as traders reposition before the Fed decision and amid easing U.S.–China trade tensions.
Currently, the price is trading near $3,980–3,990 during the Asian session, consolidating below the psychological $4,000 mark.
💎 Technical Outlook (H1–M15)
Gold continues trading in a short-term ascending channel, showing a corrective recovery inside a larger downtrend.
Immediate Support Zones:
• 3,961 – 3,937 → Trendline retest & OBS Buy Zone
• 3,918 → Structural invalidation area
Resistance & Key Reaction Levels:
• 4,018 – 4,085 → Mid-term resistance
• 4,094 – 4,102 → Major Sell Zone (Fibo 1.5–1.618 confluence)
📍If Gold breaks and holds above 4,018, momentum could extend toward 4,085–4,102.
📍If it rejects near 4,094–4,102, a correction toward 3,961–3,937 is likely.
🌍 Macro Context – FOMC Ahead
Markets expect a 25bps rate cut. A hawkish tone from Powell may pressure Gold, while a dovish one could send it above $4,100.
🧭 Summary
Gold keeps a short-term bullish bias but remains fragile ahead of FOMC.
Expect volatility around 4,000–4,100; key reactions near 4,094–4,102 will decide the next move.
🛡 Stay patient — liquidity builds before clarity.
GOLD (XAU/USD) — Calm Before the FOMC Storm Gold is currently consolidating above $3,950, signaling a pause in volatility as traders await the FOMC decision for the next directional move.
1️⃣ Macro Outlook & Core Bias – FOMC in Focus 🔑
Market Pause: After rebounding during the Asian session, Gold’s upside momentum remains limited. Market participants are cautious ahead of the Fed’s policy update.
Headwinds: Renewed optimism on US–China trade and a slightly stronger USD are capping Gold’s advances.
Game Plan: Stay tactical — identify scalp zones and prepare for a major breakout once the FOMC event unfolds.
2️⃣ Technical Setup – Descending Channel in Play 📉
Structure: Price action is holding above $3,950, but movement remains confined within a descending channel/flag.
Bias: Short-term demand persists, yet the broader structure still favors bears.
Preferred Setup: Watch for BUY scalps from lower demand zones toward the Fibo/channel resistance area.
3️⃣ Trading Plan – Precision & Patience 💰
🟩 BUY Scenario (Long Scalp)
Buy Zone: $3,939.468
Strategy: Look for long scalps targeting the Fibo 0.5 resistance.
Stop-Loss: Tight SL just below the $3,939 level.
🟥 SELL Scenario (Short Setup)
Scalp Sell Zone: $4,015.646 (Fibo 0.5)
→ Short scalps targeting a retest of the channel midline.
Main Sell Zone: $4,046.448 (Fibo 0.618 / Channel Ceiling)
→ Ideal entry for a continuation short, aligning with the overall bearish channel.
4️⃣ Trader’s Take 🚀
The FOMC decision will set the tone —
Are you eyeing a bounce from $3,939, or waiting for the $4,046 rejection to ride the next wave down?

XAUUSDPrice Action Trading is a method of financial market analysis where traders make buying and selling decisions solely based on the asset's price movements over time, without relying on technical indicators.
It's essentially the art of reading a "naked" or clean chart to understand the psychology and behavior of market participants.

Gold Extends Decline Below $4,000 as Risk Appetite Returns🔍 Market Context
Gold continues to struggle amid renewed optimism around US–China trade talks.
The shift in sentiment has reduced safe-haven demand, while softer expectations of further Fed rate cuts keep the US Dollar capped — offering limited downside support for XAUUSD.
However, the technical landscape remains clearly bearish.
The break below the ₹4,000 handle confirms continuation of the downtrend first outlined in early-week plans.
📊 Technical Analysis
Structure: Gold maintains a clean bearish channel on the H1–H4 frame.
Immediate resistance: ₹3,985 – ₹4,000 (former support, now supply zone).
Target zones:
• Short-term liquidity area near ₹3,925–₹3,930
• Extended target sits around ₹3,880–₹3,860, aligning with Fibo 1.618.
Invalidation: Only a sustained break and hold above ₹4,020–₹4,030 would neutralize this short-term bearish bias.
🎯 Trading Outlook
If gold retests the broken ₹4,000 zone and fails to regain it,
expect sellers to extend control toward ₹3,920 or lower ahead of the FOMC meeting.
That event may later define the next recovery point — but for now, momentum remains firmly on the downside.
⚜️ Summary
Gold’s recent slide isn’t random — it’s structural.
The market is rebalancing after excessive bullish sentiment,
and liquidity below ₹3,900 is likely to attract attention before any significant rebound.
Watch the reaction near ₹3,920–₹3,880 —
that’s where the next meaningful decision for gold may emerge.
📊 MMFLOW TRADING Insight:
Smart money doesn’t chase candles — it waits for liquidity to shift.

Banking Sector Leadership & PSU Bank Rally – A Deep Dive1. Introduction
The Indian stock market has witnessed several phases of leadership rotation over the years. At times, technology stocks dominate; at other times, energy or infrastructure sectors take the front seat. However, whenever the broader market gears up for a major uptrend or a new bull cycle begins, the Banking sector often takes the leadership role — and within that, Public Sector Undertaking (PSU) banks frequently emerge as key outperformers.
The recent rally in PSU banks and the resurgence of the banking sector as a whole highlight not just cyclical market behavior but also deep structural changes in the Indian economy. To understand this movement, it’s important to analyze both why banking leads and what’s fueling the PSU bank rally in particular.
2. Why Banking Sector Often Leads the Market
a. Core to Economic Growth
Banks are the financial backbone of any economy. When economic activity expands — whether through manufacturing, infrastructure, or consumer spending — banks benefit directly. Credit growth picks up, deposit bases rise, and loan demand strengthens. Therefore, the health and momentum of the banking sector often act as a mirror of economic strength.
b. Credit Cycle Expansion
A strong economy usually corresponds to an expanding credit cycle. When businesses borrow more for expansion, and individuals take more loans for consumption (homes, vehicles, education), banks record higher net interest income (NII) and better profitability.
During the early-to-mid phase of a bull market, credit growth typically accelerates sharply, turning the banking sector into a market leader.
c. Interest Rate Cycle and Net Interest Margins
The interest rate environment plays a crucial role. When rates stabilize after a hiking cycle, banks — especially those with a large low-cost deposit base — witness margin expansion. With loan yields rising faster than deposit costs, Net Interest Margin (NIM) improves.
This scenario often unfolds in the mid-stages of economic recovery — precisely when the stock market’s optimism about growth is at its peak.
d. Heavy Market Weightage
In indices like the Nifty 50 and Bank Nifty, banking and financial services account for around 35–40% of total weightage. Naturally, whenever large investors — both domestic and foreign — turn bullish on India, their first entry point is often the banking sector, leading to index-level leadership.
3. Banking Sector’s Structural Transformation
The Indian banking landscape has undergone a major transformation over the last decade — both in private and public sectors.
a. Clean-up of Balance Sheets
Post the 2014–2018 NPA crisis, Indian banks, particularly PSUs, faced massive challenges due to bad loans, corporate defaults, and poor asset quality. The Insolvency and Bankruptcy Code (IBC) and RBI’s asset quality reviews forced banks to recognize, provision, and resolve bad assets.
Today, most major banks — especially SBI, Bank of Baroda, Canara Bank, and Union Bank — have net NPA ratios below 1%–1.2%, compared to 5–6% a few years ago. This clean-up has set the stage for a sustainable recovery.
b. Digitization & Efficiency Gains
The digital transformation in banking — UPI, mobile apps, digital KYC, and paperless loans — has enhanced operational efficiency, reduced cost-to-income ratios, and improved customer acquisition. PSU banks, once lagging behind in technology, have now made significant progress through partnerships with fintechs and internal digital drives (like SBI’s YONO or BoB World).
c. Government Recapitalization and Consolidation
Between FY2017 and FY2021, the Indian government infused over ₹3 lakh crore into PSU banks, strengthening their capital buffers. Additionally, bank mergers created stronger entities — for example:
Bank of Baroda absorbed Dena and Vijaya Bank,
Canara Bank merged with Syndicate Bank,
Union Bank merged with Andhra and Corporation Bank.
This consolidation reduced fragmentation, created scale, and enhanced competitiveness.
4. The PSU Bank Rally – What’s Driving It?
The PSU bank rally has been one of the most notable themes in the Indian stock market in recent years. After a decade of underperformance, these stocks have turned into multi-baggers, with several PSU banks delivering 200–500% returns in just 2–3 years.
Let’s decode the reasons behind this rally:
a. Massive Valuation Re-rating
For a long time, PSU banks traded at deep discounts to book value — often between 0.3x to 0.6x — reflecting investor pessimism. With the clean-up of balance sheets, profitability return, and stable management, the market started to re-rate these banks.
Currently, large PSU banks trade at 1.0–1.5x P/B, still lower than private peers (2.5x–4x), leaving room for further revaluation.
b. Return of Profitability
Post-2020, PSU banks started showing consistent quarterly profits, driven by lower provisioning costs and higher NII.
Example:
SBI’s FY2025 profits are expected to exceed ₹75,000 crore,
Canara Bank, BoB, and Union Bank are recording ROEs above 15%, levels not seen in over a decade.
These results changed investor sentiment from skepticism to confidence.
c. Credit Growth Momentum
PSU banks are witnessing robust credit growth of 12–14%, led by retail loans (housing, personal, auto), SME lending, and corporate capex revival. Their strong presence in rural and semi-urban areas gives them an edge in deposit mobilization, leading to stable funding costs.
d. Capital Adequacy & Improved Asset Quality
Thanks to recapitalization and internal profit generation, most PSU banks now have Capital Adequacy Ratios above 14%, giving them room to expand their balance sheets. Their Gross NPA ratios have fallen below 4%, compared to 10–12% in 2018.
e. FII and DII Interest
Foreign Institutional Investors (FIIs) and Domestic Institutional Investors (DIIs) have both turned net buyers of PSU banks. The segment is considered a proxy for India’s growth story — benefiting from both cyclical and structural drivers.
Moreover, PSU banks offer attractive dividend yields (3–5%) and stable earnings visibility, making them a favorite in the current interest rate environment.
5. Comparing PSU vs Private Banks
Parameter PSU Banks Private Banks
Valuation (P/B) 0.9–1.5x 2.5–4.0x
ROE/ROA Improving (12–15%) High (16–18%)
NIM 3–3.3% 3.5–4.5%
Asset Quality Improved, but slightly lower Very strong
Technology Adoption Rapidly catching up Already advanced
Growth Drivers Retail, Infra, SME, Rural Credit Premium Retail, Digital, Corporate
Investor Sentiment Recovering fast Already strong
The valuation gap between PSU and private banks has started narrowing, but PSUs still remain value plays, whereas private banks are seen as quality growth plays.
6. Banking Sector as Market Leader in 2025 Cycle
In the ongoing market cycle, banking is again showing signs of leadership emergence, driven by several factors:
a. Capex Revival
India’s private and public sector capex is gaining momentum — from roads and ports to data centers and manufacturing. Banks will play a financing role in this multi-trillion-rupee expansion phase.
b. Liquidity & Deposit Growth
Despite competition from small finance and fintech banks, traditional banks — especially PSUs — have maintained strong CASA (Current Account Savings Account) ratios, ensuring liquidity. This gives them pricing power in a tightening liquidity environment.
c. Credit Quality Cycle at Its Best
With low slippages and strong recoveries, India is in the best credit quality cycle in two decades. Credit costs (provisions as a % of assets) are at multi-year lows, directly boosting profitability.
d. Government Support & Reforms
The government continues to push for PSU bank modernization, privatization of smaller entities, and improvement in governance. The “bad bank” (NARCL) initiative has further helped clear legacy NPAs.
e. Rising Financialization of Savings
With rising income levels and formalization, more money is flowing into banking and financial systems — deposits, mutual funds, and loans — further deepening the sector’s dominance.
7. Technical & Market Structure Perspective
From a market structure angle, the Bank Nifty index is often the leading indicator for Nifty’s trend direction. Historically:
When Bank Nifty outperforms Nifty, it signals broad-based bullishness.
When PSU banks outperform private banks, it often indicates a mid-stage bull market, where value stocks catch up with growth stocks.
As of 2025, both Bank Nifty and Nifty PSU Bank Index are trading near record highs, showing strong volume support, healthy price structure, and institutional accumulation — confirming that leadership lies with the banking pack.
8. Risks & Challenges
Despite strong fundamentals, certain risks remain:
Interest Rate Volatility: A sharp rate hike cycle can squeeze margins.
Global Slowdown: If export demand or global growth falters, corporate loan demand may soften.
Competition from Fintechs: Fintechs may eat into certain profitable retail segments.
Policy Risks: Privatization delays or regulatory tightening can temporarily hurt PSU valuations.
However, these are manageable risks in the current macro setup, as most PSU and private banks maintain high provisioning buffers and stable management practices.
9. Outlook for 2025 and Beyond
The outlook for the banking sector remains constructive and bullish. Analysts expect:
Credit growth of 12–14% CAGR,
NIMs to remain steady,
ROEs to sustain above 14%,
Asset quality to remain stable.
PSU banks are expected to narrow the valuation gap with private banks as they continue to deliver consistent profits, higher dividends, and improved governance.
In the medium term (2025–2027), the PSU Bank Index could potentially outperform broader indices, supported by:
Credit growth in infrastructure, housing, and MSMEs,
Rising investor confidence,
India’s macroeconomic resilience.
10. Conclusion
The Banking sector’s leadership in the market is not accidental — it is rooted in economic cycles, financial system dominance, and investor psychology. Every major bull market in India’s history has been led, directly or indirectly, by banks.
The PSU Bank rally represents not just a price recovery but a structural turnaround story — from being crisis-hit entities plagued by NPAs and inefficiency to becoming profitable, tech-savvy, dividend-paying institutions aligned with India’s growth narrative.
As India’s GDP moves toward the $5 trillion mark, and capex, consumption, and credit cycles expand together, banks — both private and public — will remain the torchbearers of the next leg of India’s equity bull market.

GOLD DIP ALERT! Sniping the $3,89x FIBO Floor Ahead of FOMC!FranCi$$_FiboMatrix Quick Insight (H1/M30 Focus)
Welcome Traders! Gold paused its sell-off near $4,065 as safe-haven demand returned pre-FOMC. Dovish Fed expectations are weakening the USD, setting the stage for a major rally. This is the final BUY ON DIPS setup!
🧠 INSIGHT & LOGIC
Fundamental Anchor: Weak US inflation and strong expectations for a Fed rate cut are the key drivers limiting downside. Long-term bias is Bullish.
Technical Focus: We are tracking the final deep correction to the $3,89x zone (Fibo 1.5 - 1.618 Extension). This is the ultimate technical floor for the ATH rally.
Action Plan: WAIT for the price to hit this extreme zone and confirm reversal (H1/M30).
🎯 KEY ACTION ZONES
🔥 CRITICAL BUY: $3,89x region ($3,881.435$).
Strategy: BUY on confirmation here.
TP TARGET 1: $4,037.647 (Immediate Resistance).
TP TARGET 2: $4,232.374 (Major Structural Resistance).
SL MANDATE: Place SL safely below the 1.618 Fibo zone.
Patience is key. Do NOT rush the entry! Is the $3,89x$ floor strong enough for the ATH rally? 👇

🇮🇳 LiamTrading – XAUUSD: Dual Strategy Ahead of FOMC🇮🇳 LiamTrading – XAUUSD: Dual Strategy Ahead of FOMC | Focus on Buying the Retracement near $3914
Hello Traders,
After a strong sell-off, Gold (XAUUSD) is showing early signs of recovery, building a minor upward structure.
We continue to focus on buying the pullback, viewing this move as a short-term correction within the broader downtrend.
Expect higher volatility as the FOMC decision approaches.
📰 MACRO CONTEXT & FUNDAMENTALS
The market is holding steady ahead of the FED announcement:
🟢 Technical Recovery:
Gold reversed part of its decline during the Asian session, bouncing slightly from a 3-week low as traders await the FOMC rate decision.
🔴 Headwinds:
However, optimism around US-China trade talks and a stronger USD continue to limit the upside momentum.
📊 TECHNICAL VIEW & TRADING PLAN
We are focusing on high-probability liquidity zones for both long and short opportunities:
🟢 Primary BUY Setup (Retracement Buy)
Looking for a retest of the key buy-side liquidity zone to trigger the next recovery wave.
Entry Zone (Buy): $3914
Stop Loss: $3906 (Tight SL recommended)
Take Profit: TP1 $3933 | TP2 $3956
🔴 SELL Setup (Retest / Short-Term Scalping)
Using the broken trend area for short opportunities.
Entry Zone (Sell): $4048
Stop Loss: $4056
Take Profit: TP1 $4035 | TP2 $4022
🧭 SUMMARY & TRADER’S NOTE
Gold is now in a decision zone — volatility will spike around FOMC.
Trade with discipline:
✅ Enter only at confirmed liquidity zones.
✅ Always respect your Stop Loss.
✅ Manage your capital carefully before the news release.
Wishing everyone a profitable and disciplined session!

Elliott Wave Analysis – XAUUSD (October 29, 2025)
Momentum
• D1: Momentum remains compressed, but yesterday’s candle closed with a long lower wick — a clear sign of weakening downside pressure. A bullish daily close today would confirm a potential D1 reversal.
• H4: Momentum is preparing to turn down from the overbought zone, yet the current upward move is still weak. We need to monitor whether price can hold above the previous low once H4 momentum drops toward oversold.
• H1: Momentum is falling, but price is supported around 3953 and capped near 3994.
As long as price holds above 3927 and avoids breaking 3892, the next H4 oversold phase could confirm a stronger upside structure.
________________________________________
Wave Structure
• D1: The current decline equals 0.382 retracement of wave (3) yellow, a key Fibonacci level.
• H4: Wave (4) purple has already retraced 0.782 of wave (3) — unusually deep for a normal 4th wave (which typically stops around 0.382–0.5).
This suggests the ongoing correction may represent wave (4) yellow on the D1 timeframe.
If true, the market could now be forming wave W of a larger W–X–Y structure, meaning the upcoming recovery might only be a slow, overlapping X wave before another decline.
• H1: The 5-wave black structure seems completed.
A break above 3995, followed by a test of 4050, would confirm the end of wave (5) black and the start of a corrective move upward.
________________________________________
Summary
Price volatility is still high — avoid limit orders for now and watch how price reacts at key zones.
• 🔹 Support: 3953 – 3927 – 3892
• 🔹 Resistance: 3994 – 4050

XAUUSDWe have a consolidation at the bottom of the week. Selling momentum is down.
Friday could be reversal. Taking out the previous week low liquidity and then reversal.

Gold Breaks Trendline: 4000 Back in FocusYesterday's trading session brought further downside pressure as gold pushed lower to test the 3880 zone, which is just above the monthly open. We have seen a decent recovery bounce from there, suggesting some buying interest is emerging at these lower levels. However, it's important to maintain perspective here while we're seeing short-term stabilization, the reversal signs on higher timeframes haven't materialized yet. We need to see more convincing price action and stronger closes on the larger timeframes before we can confidently call this as reversal to bullish case.
Also today we have extremely narrow CPR positioned at 3954. When we see such tight CPR levels, it often signals either an impending trend reversal or the potential for a high volatility session ahead. The early Asian session has already given us something to work with price is attempting to reclaim this CPR zone, which is a constructive development. Adding to the bullish case, we've also seen a breakout from the descending trendline structure that had been capping rallies over the past few sessions.
From a tactical perspective, the immediate support zone to monitor is 3900-3910.... If buyers can defend and sustain price action above this level, we could see gold make an attempt toward the first meaningful hurdle at 4000-4010. This target zone is particularly significant as it aligns with today's R1 pivot and the prior week's low, creating a confluence resistance area. A daily close above 4000-4010 would be an encouraging sign that momentum is genuinely shifting back in favor of the bulls and could open the door for further upside.
As for my positioning, I'm maintaining my existing buy positions and continuing to manage them as the price action develops. The risk-reward from these levels still appears favorable given the technical setup unfolding.

Gold Gathers Momentum Ahead of Fed's Move as Bulls Aim $4070Gold is in a bullish consolidation as prices made sharp upward bounce back off the lows of 3915 and reached a tad higher at 3982 which again faces intermediate resistance.
This may be an attempt to reset institutional order flows for some recovery towards 4050-4100-4150 before any major breakthrough in the directional move or a correctional A-B-C before the next impulse.
Intraday perspective shows buying dips around 3945-3935 as long as swing low of 3915 is intact, with potential upside move in the pipeline.

XAUUSD | Gold to drop 2000PIPS, where is the best sell zone?🔍 Market Context
After breaking the medium-term upward structure at the main Trendline , gold has formed a distinct series of Lower High – Equal Low (EqL) , indicating a phase shift from bullish to bearish.
Currently, the price is fluctuating around the 3,960–3,970 USD zone – this is a temporary liquidity accumulation area before moving up to retest the resistance at 4,015–4,050 USD , which was previously a Demand Zone now turned into Supply Zone .
If a strong bearish reaction occurs here, the price is likely to extend its decline towards the Order Block 3,945–3,960 USD zone, or even deeper to the Premium Zone 3,884 USD .
💎 Key Technical Structure
Main Trendline: broken, confirming a structural change (ChoCH).
Resistance Zone: 4,010–4,015 → quick reaction resistance.
Supply Zone: 4,043–4,060 → strong technical retracement zone.
Premium Zone: 3,884–3,900 → discount zone, potential temporary bottom.
📈 Trading Scenarios
1️⃣ SELL Zone 1 – Scalp Reaction at Resistance Zone
Entry: 4,010 – 4,015
SL: 4,025
Take Profit : 4,005 - 3,995 - 3,975 - 3,965 - Open
➡️ Quick scalp reaction at nearby resistance – suitable for trading during London/NY sessions.
2️⃣ SELL Zone 2 – Major Retest at Supply Zone
Entry: 4,043 – 4,060
SL: 4,065
Take Profit : 4,050 - 4,040 - 4,030 - 4,020 - 4,010/Open
➡️ Main setup – retest of confluence supply zone with broken trendline, high probability if strong rejection on H1/H4.
3️⃣ SELL Continuation – Break & Retest below 3,945 USD
Entry: 3,945 – 3,950
SL: 3,965
TP: 3,884
➡️ Setup breaks EqL bottom confirming continuation of downtrend, targeting Premium Zone.
4️⃣ BUY Setup – Reversal at Premium Zone 3,900 USD
Entry: 3,900
SL: 3,880
TP1: 3,910 - 3,920 - 3,930 - 3,940 - 3,950/Open
✅ Condition:
Only buy when a strong reaction candle appears (long-tail rejection / ChoCH bullish on M15–H1).
➡️ This is the final discount zone before major capital can return to the market – technical reversal setup, low risk / high reward.
⚠️ Risk Management
Prioritise SELL at supply zones, BUY at Premium – avoid trading in the middle of the range.
Reduce volume on scalp setups (Sell 1).
If price closes above 4,070 → short-term downtrend is invalidated.
💬 Conclusion
Gold is still under short-term bearish pressure, however, the 3,884–3,900 USD zone may serve as strong support.
The appropriate strategy is to utilise the two resistance zones for Selling and observe technical Buying at the Premium bottom.
👉 Comprehensive Strategy:
Sell 4,010–4,015 | SL 4,025 | TP 4,005 → 3,965 🎯
Sell 4,043–4,060 | SL 4,065 | TP 4,050 → 4,010 🎯
Buy 3,900 | SL 3,880 | TP 3,910 → 3,950 🎯
🔥 “Trade with patience, react at precision zones — that’s how consistency is built.”
⏰ Timeframe: 1H
📅 Update: 28/10/2025
✍️ Analysis by: Captain Vincent

Gold breakdown?After a prolonged uptrend, gold has formed a triangle at the top and on the verge of breakdown. if breaks today and follows on Monday, can give a decent move
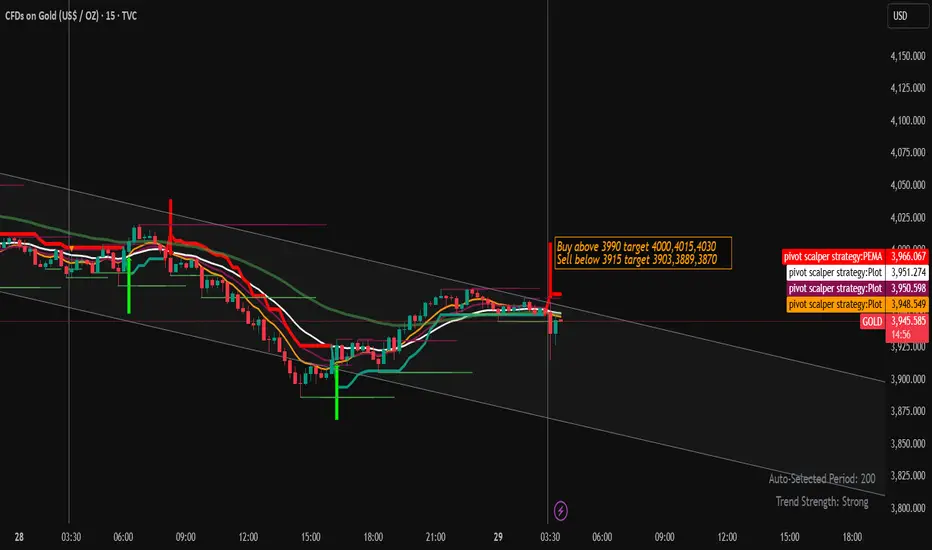
Gold Trading Strategy for 29th October 2025 (IST)🪙 TVC:GOLD Intraday Trading Plan
📈 Buy Setup:
🔹 Entry: Above the high of 15-min candle (Close > $3990)
🎯 Targets: $4000, $4015, $4030
🛑 Stop Loss: Below $3975 (or below candle low for confirmation)
📉 Sell Setup:
🔹 Entry: Below the low of 15-min candle (Close < $3915)
🎯 Targets: $3903, $3889, $3870
🛑 Stop Loss: Above $3930 (or above candle high for confirmation)
⚠️ Disclaimer:
Trading in gold or any commodity involves substantial risk. This plan is for educational and informational purposes only — not financial advice. Always assess your own risk before entering any position. 📊
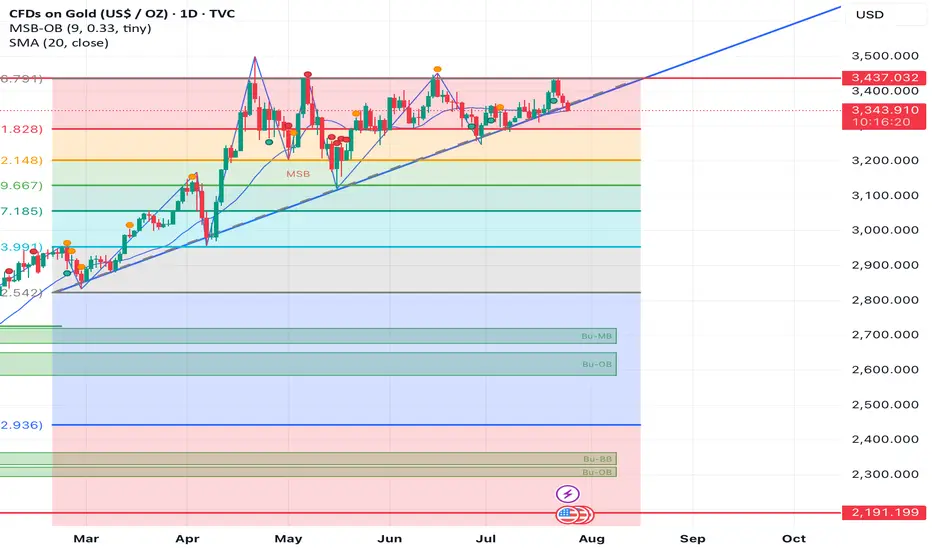
XAU/USD Completing Wave Y: Final Dip Before RallyGold has completed its major 5-wave rise and is now finishing a corrective W-X-Y pattern. The recent drop looks like the final leg of this correction, meaning sellers are getting weaker. Price may show a small bounce up and then one last dip to complete the correction. After that final drop, a strong new uptrend is expected to start again. In short: correction ending soon, last dip big bullish move ahead.

XAUUSDI was waiting to short gold found this short trade.
Break of Trendline and supply zone plus downtrend this 3 confluence and entered the trade.
