Psychology of Indian Traders – Short Real-Life Cases!Hello Traders!
India has one of the fastest-growing trading communities in the world.
But despite access to charts, tools, YouTube, and education, most retail traders still repeat the same emotional mistakes.
Here are a few short real-life cases that show how psychology shapes the journey of Indian traders more than any strategy or indicator.
1. The Salary Trader, “I Just Want to Recover My Losses”
A 28-year-old IT employee from Bengaluru started trading BankNifty options after watching influencers brag about profits.
He made ₹6,000 on his first day, and believed trading was easy income.
Then he lost ₹45,000 in two weeks. Instead of stopping, he kept trading bigger lots to recover.
Within 3 months, he wiped out his entire savings.
His mistake wasn’t strategy.
It was thinking recovery is more important than discipline.
2. The Overconfident Trader, “Market Mere Hisab Se Chalega”
A 33-year-old trader from Gujarat had one big lucky win in 2021 during the bull market.
He made ₹3.5 lakh in one week and believed he was naturally talented.
He increased his position size, stopped using stop loss, and ignored risk.
The next correction wiped out not just his profit, but his entire capital.
His mistake was thinking “luck = skill.”
3. The FOMO Trader, “Sab Log Le Rahe Hain, Main Kyun Chhodo?”
A young trader from Mumbai bought every trending coin, SHIB, PEPE, FLOKI, without checking charts or fundamentals.
He only entered after seeing pumps on Twitter.
He never bought dips, only tops.
Today, he holds a portfolio down 70%, waiting for “next bull run” to save him.
FOMO always makes you late.
4. The Quiet Winner, “Main Kam Karta Hun, Par Sahi Karta Hun”
A disciplined trader from Pune took only 2–3 trades a week.
He risked just 1% per trade, journaled every entry, and treated trading as a skill.
In 18 months, he grew his account slowly but consistently, without blowing up once.
He is not rich yet, but he is stable, confident, and improving every month.
Consistency beats speed, every time.
Rahul’s Tip:
Most Indian traders don’t need more indicators, they need more patience, more control, and more clarity.
Before learning complex setups, learn yourself.
Your psychology decides your wealth more than your strategy ever will.
Conclusion:
These real-life cases show one truth, the Indian market doesn’t destroy traders.
Their habits do.
If you want to be different, think differently.
Trade slow, trade smart, and build discipline before expecting profits.
If this post felt relatable, like it, share your story in comments, and follow for more real-world trading psychology lessons!
Trade ideas

Gold Turning BEARish #XAUUSD turning BEARish 🐻
Now at 4060.
SELL on RISE 🤞
Expecting significant downside moves
that may last for a couple of hours...
Until trades below 4064 weak trend wud remain
&
wud get intensified after crossing 4049-51 range...🤞
Expected to hit-
TP 1: 4041
TP 2: 4029
TP 3: 4019
SL: 4087

xauusd has seeped swing lowprice has seeped swing low, although structure on 15m if bearish but price has seeped low and give us engulfing candle+fvg, so entering here is good idea, sl woud be at $4040.080 and tp would be at $4069.500. price can face resistance at 4058.300, but if it breaks this zone and manages to close above $4069.300, it can blast upside. OANDA:XAUUSD

Gold Trading Strategy for 20th November 2025🟡 GOLD INTRADAY LEVELS – 30-Min Strategy
📈 BUY SETUP (Long Position)
🔸 Entry Condition:
Buy above the High of the 30-min candle after price closes above $4122.
💰 Targets:
🎯 $4132
🎯 $4145
🎯 $4160
📌 Notes for Traders:
Wait for a strong bullish candle close above $4122 to confirm the breakout.
Ideal if volume increases as the breakout happens.
Keep the trendline/market structure in view before executing.
📉 SELL SETUP (Short Position)
🔻 Entry Condition:
Sell below the Low of the 30-min candle after price closes below $4056.
💰 Targets:
🎯 $4044
🎯 $4032
🎯 $4018
📌 Notes for Traders:
Look for a strong bearish candle close below $4056.
Breakdown is more reliable if accompanied by increasing selling pressure.
Always confirm with momentum indicators (RSI, MACD, etc.) if possible.
⚙️ Risk Management (Highly Recommended)
🔒 Use Stop-Loss just below breakout candle for buys / above breakdown candle for sells.
📏 Risk–Reward ratio: Minimum 1:2.
💼 Avoid over-leveraging; trade only with allocated risk capital.
⚠️ Disclaimer
This information is provided only for educational and informational purposes.
It is not financial advice, and trading in gold or any financial instrument involves high market risk.
Always consult your financial advisor and trade at your own discretion.

Gold 30-Min Chart: Sellers Active Near Resistance!Gold is once again testing its falling resistance trendline, which has already rejected the price several times in recent sessions. Each time the price touches this trendline, selling pressure increases, showing how strong this resistance zone is.
Currently, the price is near $4070–$4080, where short-term traders should stay alert. If the price fails to break above this resistance, a pullback toward the $4000–$3980 support zone looks likely. This area has previously acted as a strong demand zone, where buyers may re-enter.
However, if Gold breaks and sustains above this trendline resistance, we could see a fresh upside momentum building up toward $4115–$4135 levels. For now, the structure looks weak near resistance, and traders should wait for a clear breakout or rejection confirmation before taking any position.
Disclaimer: This analysis is for educational purposes only and should not be taken as financial advice. Please do your own research or consult your financial advisor before investing.
Analysis By @TraderRahulPal | More analysis & educational content on my profile.
If you found this helpful, don’t forget to like and follow for regular updates.

Gold XAUUSD – Fresh Resistance Tested Twice, Bears Eye 4057 PullGold gave us a clean reaction today, rejecting the 4107–4110 supply zone not once, but twice. That double tap reinforced a fresh resistance band at 4087–4095, where sellers stepped back in with intention.
As long as 4012 holds on the upside, this resistance zone remains my short-term line in the sand. Any push back into 4087–4095 may attract renewed selling pressure, keeping the door open for a move toward 4057, with momentum potentially extending lower if sellers stay in control.
I’ll be watching how price behaves on each revisit—structure remains king.
Your feedback drives our content and keeps everyone trading smarter. Let’s make those pips together! 🚀
Happy Trading,
– The InvestPro Team

Swing Trading Secrets1. The Secret of Trend Recognition
The biggest secret of profitable swing trading is identifying the dominant trend of the market. Most novices try to pick tops and bottoms, but professionals follow the path of least resistance. Trend recognition means:
Uptrend: Higher highs (HH) + higher lows (HL)
Downtrend: Lower highs (LH) + lower lows (LL)
Range: Price oscillates between support and resistance
Swing traders do not predict; they react. They align trades with the existing trend.
For example:
In an uptrend, they wait for pullbacks to key levels.
In a downtrend, they short the rallies.
In a range, they buy at support and sell at resistance.
Knowing the trend keeps traders on the right side of probability.
2. The Secret of Patience and Timing
Effective swing traders don’t enter randomly. They wait for specific conditions:
A. The market must be near a key level
Trendline touch
Moving average support (e.g., 20-EMA, 50-EMA)
Fibonacci retracement (38.2%, 50%, 61.8%)
Previous swing high/low
Volume clusters
B. Price must confirm the reversal or continuation
Patience allows the market to “show its hand” before entering.
The secret: wait for the candle close, not the candle forming.
Many traders lose because they enter too early. Timing matters more than direction.
3. The Secret of Multi-Timeframe Confluence
Professional swing traders use multiple timeframes:
Higher timeframe (HTF): 1-week or 1-day → Trend direction
Trading timeframe (TTF): 4-hour or 1-day → Entry zones
Lower timeframe (LTF): 1-hour or 15-min → Entry trigger refinement
This is called top-down analysis.
If the weekly chart shows an uptrend, the daily chart shows a pullback, and the 4-hour chart shows a bullish reversal pattern, the probability of success becomes extremely strong.
Multi-timeframe alignment is a powerful edge.
4. The Secret of High-Probability Patterns
Swing traders rely on chart patterns—not lots of patterns, just a handful of powerful ones that repeat reliably.
A. Continuation Patterns
Bull flag
Bear flag
Ascending triangle
Descending channel
These indicate that the trend is likely to continue.
B. Reversal Patterns
Double top / double bottom
Head and shoulders
Morning star / evening star
Hammer / shooting star
C. Breakout Patterns
Cup and handle
Range breakout
Consolidation breakout
Professional traders focus on clean patterns. If the pattern is messy, overlapping, or unclear, they move on.
5. The Secret of Volume Analysis
Price shows direction; volume shows conviction.
High-probability swing trades usually show:
High volume on breakouts
Low volume on pullbacks
High volume on reversal candles
Volume spikes at support/resistance
Volume acts like a lie detector. If a breakout happens on weak volume, it is often a trap.
Understanding volume helps traders avoid false signals.
6. The Secret of Risk Management
Most swing traders fail not because their strategy is bad but because their risk management is weak.
Professionals follow these golden rules:
Risk only 1–2% of capital per trade
Always place a stop-loss
Size positions based on volatility
Avoid overtrading
Never increase lot size after a loss
The greatest secret:
Protecting capital is more important than making profits.
A trader who avoids major losses can survive long enough to catch big winning swings.
7. The Secret of Support & Resistance Mastery
Swing traders obsess over support and resistance levels.
These levels act as price magnets and turning zones.
Key levels include:
Previous swing highs/lows
Daily, weekly, and monthly levels
Psychological numbers (100, 500, 1000)
Fibonacci retracement levels
Supply and demand zones
Swing traders wait for price reactions at these levels and only trade when confirmation appears.
8. The Secret of Using Indicators the Right Way
Professional swing traders use indicators as confirmation, not decision-making tools.
Popular indicator combinations:
A. Trend + Momentum
50-EMA or 200-EMA + RSI
20-EMA + MACD
B. Pullback Identification
Bollinger Bands
Stochastic RSI
C. Breakout Confirmation
Volume + MACD
RSI breakout
The secret:
Use indicators sparingly—2 or 3 maximum.
Clear charts produce clearer decisions.
9. The Secret of Trading Psychology
Swing trading rewards emotional control.
Professionals master:
A. Discipline
Follow the plan strictly.
B. Patience
Wait for the best setups.
C. Emotional Detachment
React to charts, not feelings.
D. Consistency
A few high-quality trades outperform dozens of random trades.
The less emotionally involved a trader is, the better they perform.
10. The Secret of Journaling Every Trade
This is one of the most underrated secrets.
A trade journal includes:
Entry and exit
Stop loss
Chart screenshots
Reason for trade
Mistakes
Market context
Journaling forces self-reflection and dramatically improves discipline and performance.
11. The Secret of Avoiding News-Based Noise
Swing traders avoid making decisions during:
Major economic announcements
Earnings reports
Policy changes
High volatility events
News can create unpredictable spikes that damage swing positions.
Professionals stay defensive during such periods.
12. The Secret of Letting Winners Run
One of the greatest swing trading secrets is knowing when not to exit early.
Successful traders:
Trail their stop-loss
Add positions in trend continuation
Hold until target zones are met
Small losses and big wins create long-term profitability.
Conclusion
Swing trading appears simple but demands mastery of multiple elements—trend recognition, timing, patience, volume interpretation, chart patterns, risk management, and psychology. The real secrets lie not in magical indicators but in disciplined execution and consistent behavior. When traders combine technical analysis with emotional control, they unlock the ability to capture market swings with confidence and accuracy.

Order Blocks Simplified — How Institutions Control Price🔥 Order Blocks Simplified — How Institutions Control Price
Order Blocks are one of the most important concepts in modern trading — because they show where institutions place REAL positions, not where retail traders guess. 🏦📊
When you understand Order Blocks, you stop chasing random candles and start reading the footprints of smart money. Let’s simplify it. 👇✨
📌 What Is an Order Block? 🧱💰
An Order Block (OB) is a price zone where big institutions (banks, hedge funds, market makers) place massive orders.
These zones often appear before strong market moves — because that’s where smart money builds positions.
Think of an Order Block as:
🔹 The origin of a powerful move
🔹 A zone where price reacts repeatedly
🔹 A region that creates imbalance and momentum
🔹 A point where institutional orders remain unfilled
Once price returns to that zone, institutions fill the rest of their orders, causing another strong reaction. ⚡📈📉
📌 Why Do Order Blocks Matter? 🧠🔥
Because institutions control 80%+ of market volume — not retail.
So when they accumulate or distribute positions:
📈 Trends are born
📉 Reversals appear
🌊 Momentum shifts
💥 Big candles print
Order Blocks give you insight into:
✔️ Where big players enter
✔️ Where real support/resistance exists
✔️ Why price reverses at specific zones
✔️ Where high-probability trades form
It’s the closest thing to tracking the “big money blueprint.”
📌 How Order Blocks Form 🛠️📊
Order Blocks are created during periods of:
🔸 Accumulation (smart money buys quietly)
🔸 Distribution (smart money sells quietly)
Then price explodes away from that zone, showing that a major order cluster was executed.
This explosive move creates:
🔥 Imbalance (FVG)
🔥 Break of structure (BOS)
🔥 A directional trend
These are all signs of institutional activity.
📌 Types of Order Blocks 🟥🟩
🟥 Bearish Order Block (B-OB)
The last bullish candle before a strong bearish move.
It marks institutional selling.
🟩 Bullish Order Block (B-OB)
The last bearish candle before a strong bullish move.
It marks institutional buying.
Both act as high-probability reaction zones.
📌 How Institutions Use Order Blocks 🎯🏦
Institutions don’t enter all at once — their orders are too large.
So they:
1️⃣ Place part of their order
2️⃣ Push price away
3️⃣ Wait for retracement
4️⃣ Fill the rest at the same zone
That zone = the Order Block.
Price returning to an OB is not random — it’s smart money completing their business. 💼✨
📌 How You Trade Order Blocks 🧘♂️📈
✔️ Identify the strong move
Big displacement = institutional interest. 🚀
✔️ Mark the Order Block candle
The last opposite candle before the move. 🔍
✔️ Wait for price to return
Smart money loves to rebalance orders. 🔁
✔️ Enter with confirmation
Candles + structure + reaction = high probability. 🎯
Order Blocks are not predictions — they are reaction zones with a smart-money edge.
📌 Why Order Blocks Work So Well 🌟
Because they are built on:
💧 Liquidity
🧠 Smart Money Behavior
📊 Market Structure
⚡ Supply & Demand
🔥 Institutional Order Flow
This is why OBs outperform classic support/resistance.
They show institutional reality, not retail imagination.
✨ Final Thoughts: The Power of Order Blocks 🚀
Once you learn Order Blocks, everything becomes clearer:
✔️ You know where big money enters
✔️ You know where to wait for price
✔️ You stop chasing bad trades
✔️ You trade WITH smart money
✔️ You catch cleaner, stronger moves
Order Blocks are the foundation of modern price action — simple, powerful, and deeply effective. 🔥📈
GOLD / XAUUSD - Classic Example of Liquidity GRAB
TF: 30 Minutes
CMP: 4075
GOLD and Silver seem to have completed the corrective rise and ready to tumble down.
In case of GOLD, price got rejected from the 50% fib level of the A leg and now resuming the C leg down.
The channel, possible price action etc, all are marked in the chart published herein.
In addition, the classic example of Liquidity GRAB concept is explained in the charts below.
The alternate case is that, in this 4th wave (larger degree TF), GOLD could be forming a Triangle (3 subwaves within the abcde triangle wave) and then move higher.
Either case, price should be testing the recent swing lows soon.
It purely depends on how the buyers would react when the price reaches 3900 levels..
My Bias is on the Simple ZIG/ZAG ABC correction to move below 3700 USD
Lets review the moves at each of the levels to come.
Disclaimer: I am not a SEBI registered Analyst and this is not a trading advise. Views are personal and for educational purpose only. Please consult your Financial Advisor for any investment decisions. Please consider my views only to get a different perspective (FOR or AGAINST your views). Please don't trade FNO based on my views. If you like my analysis and learnt something from it, please give a BOOST. Feel free to express your thoughts and questions in the comments section.

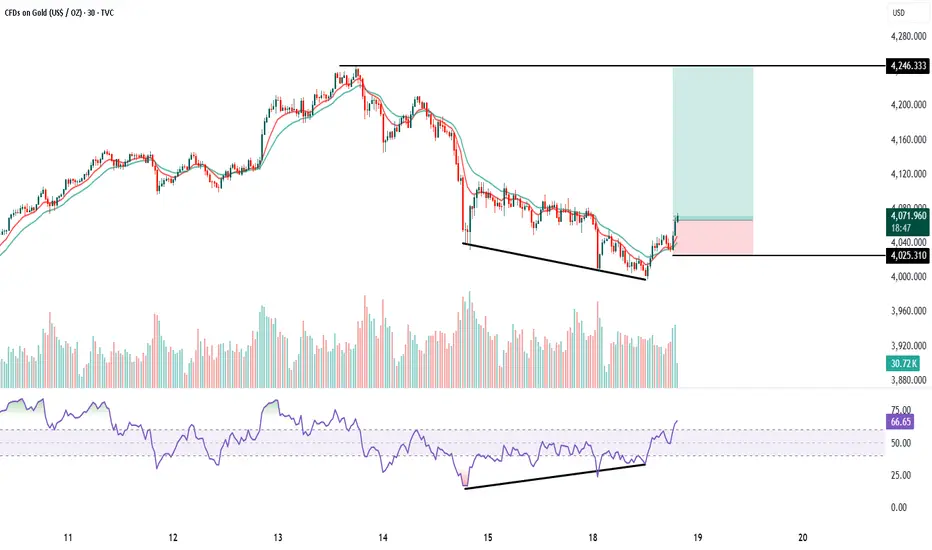
GOLD 30 Min chart analysis1. Trend : Price was in a downtrend with continuous lower highs and lower lows. Now the chart is showing a falling wedge pattern, which is a bullish reversal pattern. Breakout candle is visible with strength, indicating trend reversal from bearish to bullish on the 30-minute timeframe.
2. Volumes: Volumes remained average during the fall.
At the breakout zone, you can see volume expansion, which confirms buyers are stepping in.
This supports a valid bullish breakout.
3. Momentum (Price Action + EMAs): Price is crossing above the 10 EMA and 20 EMA, and both EMAs are starting to turn upward. This shows momentum shift from sellers to buyers. Momentum candles at breakout confirm the start of an upward move.
4. RSI Divergence: Price made lower lows, but RSI made higher lows.
This is a classic bullish divergence, indicating selling pressure is weakening. RSI has now moved above 60, confirming momentum is picking up strongly.
Buy above 4075 after the breakout candle closes above falling wedge.
This ensures confirmation and avoids a false breakout.
Keep SL just below wedge support: SL = 4025
Target : The major horizontal resistance shown on the chart is:
Target = 4246 This is also the measured move of the wedge, matching the resistance zone.
Risk–Reward: RR is approximately 1:3 to 1:3.5, which is ideal for breakout trades. This is a high-probability trend-reversal breakout setup with a clear target and safe stop loss.
XAUUSD MULTI TIMEFRAME ANALYSIS Hello traders , here is the full multi time frame analysis for this pair, let me know in the comment section below if you have any questions , the entry will be taken only if all rules of the strategies will be satisfied. wait for more price action to develop before taking any position. I suggest you keep this pair on your watchlist and see if the rules of your strategy are satisfied.

OVERVIEW FOR TODAY - CHART H1 OVERVIEW
Price is currently sitting inside the POC zone – the area with the highest traded volume → the market usually consolidates here before choosing a direction.
Prior trend: Strong uptrend → distribution → correction.
The ascending trendline has been broken → short-term trend is bearish (downtrend).
Volume Profile shows the VAH above as strong resistance, and VAL below as strong support.
1: Price bounces from POC → moves up toward VAH (medium probability)
Conditions:
Price holds above the POC zone (~4000–4010).
Bullish price action appears (pin bar, engulfing, break of structure on H4).
Targets:
4120–4160 (VAH zone) → this is major resistance.
If VAH breaks → trend may resume upward with a larger target around 4300+.
Assessment:
Possible, but not the highest probability, because recent bearish momentum is still strong.
2: Price breaks below POC → retest → drops to VAL (HIGHEST PROBABILITY)
Current candles show strong rejection from VAH → falling directly into POC → bearish confirmation.
If D1 closes below the POC:
Bearish continuation becomes likely.
Targets:
3920–3950 (VAL zone) → very strong support.
Volume Profile thins out here → price tends to move quickly through this area.
Assessment:
This is the most likely scenario because:
✔ Trendline is broken.
✔ Weak bullish reaction at VAH.
✔ Volume Profile structure favors a move downward into VAL.
3: Price breaks below VAL → deeper drop toward Demand zone (low probability but dangerous)
Conditions:
D1 closes below 3920 (VAL)
Breaks the horizontal support.
Deep Targets:
3550–3600 (major Demand zone).
This is where the longer-term uptrend may recover.
Assessment:
Low probability, but if triggered → gold will make a sharp correction.
FINAL CONCLUSION
Highest probability: BEARISH continuation → drop toward VAL zone (3920–3950)
Because:
Strong rejection from VAH
Price sitting weakly on POC
Short-term structure turning bearish
[bTrading Suggestions
For short setups:
Look to sell on a retest of POC (4000–4010).
SL above VAH (4060–4080).
TP at VAL.
For long setups:
Only buy at VAL zone when clear reversals appear (pin bar, engulfing).
Avoid buying between POC → VAL.
⚠️ Disclaimer
All analyses and insights provided in this content are for informational purposes only and should not be considered financial advice. The financial market carries inherent risks, and every trader is fully responsible for their own decisions. Trade with a plan, discipline, and proper risk management.

LiamTrading – XAUUSD H1 | Monday SetupLiamTrading – XAUUSD H1 | Monday Setup
Wait for gold to retest the upper trendline before choosing a direction
Quick Overview
On the H1 timeframe, gold is still moving inside a triangle pattern with a descending upper trendline and a gradually rising lower trendline. In my view, price still needs a bullish swing to retest the upper trendline – which aligns with the FVG zone + Volume Profile POC – before deciding a new trend (either a breakout to the upside or a reversal downward).
Regarding the USD, many Fed officials have begun signaling that rate cuts may happen, but they remain very cautious. UBS and Barclays both lean towards the scenario that the Fed could cut rates in December if upcoming data continues to weaken. This limits the USD’s ability to strengthen too much, giving gold room for a technical pullback into resistance zones.
H1 Technical Analysis
Current structure: price is consolidating sideways, with lower highs along the descending trendline and higher lows supported by the lower trendline.
Zone 4079–4081:
FVG + Volume Profile POC.
This area aligns with the upper trendline → a strong confluence resistance zone, suitable for a reaction-based short setup.
Nearest support zone: around 4040–4035; if this level breaks, price may likely head back to retest 4010–4000.
A clear bullish reversal signal only forms if an uptrend structure returns, at least when price breaks and holds above 4061, then continues through the descending trendline.
Trading Scenarios (Reference Only)
Sell at FVG + POC + Trendline (Priority setup)
Entry: 4079–4081
SL: 4086
TP: 4060 → 4045 → 4010
Logic: Price is expected to move up to fill the FVG and touch the POC/trendline before sellers step back in. This zone has strong confluence, offering a better win rate than shorting inside the sideway range.
Buy when bullish structure is confirmed
Conditions: Price must break above 4061, close an H1 candle holding above this level, and break out of the descending trendline.
Entry (reference): 4061–4068 (retest of breakout zone)
SL: 4050
TP: 4095 → 4130 → 4150
In this case, the triangle pattern breaks upward, Dow Theory bullish structure returns, and the priority is buying with the new trend rather than trying to short the top.
Trading Notes
Possible scalp levels: 4060, 4040, 4010, 4130 – always wait for clear candle reactions on M5–M15 before entering.
Risk per trade: 0.5–1% of account size; once the trade reaches around 1R, move SL to breakeven to protect your capital.
If you have a different scenario for XAUUSD H1 today, leave a comment and follow LiamTrading for daily gold strategies on TradingView.

Gold Trading Strategy for 24th November 2025✨ GOLD Trading Plan – Breakout Strategy (30-Min Candle)
🟢 BUY Setup (Long Trade)
Trigger: Enter only if the price closes above the high of the 30-minute candle at 4086.
Entry: Buy above 4086 after a confirmed candle close.
Targets:
🎯 Target 1: 4100
🎯 Target 2: 4115
🎯 Target 3: 4128
Stop-Loss Suggestion: Below the breakout candle low or below 4058–4062 zone (adjust per risk tolerance).
Logic:
A close above 4086 signals bullish strength and a possible continuation toward intraday resistance levels. Momentum confirmation is essential before entering.
🔴 SELL Setup (Short Trade)
Trigger: Enter only if the price closes below the low of the 30-minute candle at 4042.
Entry: Sell below 4042 after a confirmed candle close.
Targets:
🎯 Target 1: 4034
🎯 Target 2: 4024
🎯 Target 3: 4010
Stop-Loss Suggestion: Above the breakdown candle high or above 4060–4065 zone.
Logic:
A close below 4042 shows bearish momentum that can push price toward the next support zones.
📌 Extra Notes for Better Execution
⏳ Wait for a confirmed 30-minute candle close before entering — avoid wick traps.
📉 Place stop-loss strictly; gold is highly volatile.
⚙️ Risk–reward should be at least 1:2 or better.
📊 Monitor global cues: USD strength, yields, economic data, and geopolitical news.
⚠️ Disclaimer
This analysis is for educational and informational purposes only. It is not investment or trading advice. Financial markets involve risk, and you should conduct your own research or consult a certified financial advisor before making any trading decisions. You are fully responsible for your trades.

LiamTrading – XAUUSD H4 | Gold accumulates on the trendlineLiamTrading – XAUUSD H4 | Gold accumulates on the trendline, waiting to break the structure for a breakout
After testing the upward trendline twice, gold bounced up and then moved sideways around the 4065 area. On H4, this price zone has accumulated for almost a week – indicating that the selling force is not liquid enough to push the price down deeply, while there is still plenty of price gap above according to Fibonacci. My preferred scenario: gold continues to "compress" within the triangle, then breaks out to create a new wave.
Macro – Fed context
Fed member Collins emphasized that there is still reason to be cautious about cutting rates in the December meeting. She stated:
This is a complex phase, and it's not unusual for internal disagreements within the Fed.
The Fed must balance between the two goals of employment and inflation, which are moving in opposite directions.
This makes it difficult for the market to clearly price the interest rate scenario, so gold continues to choose to accumulate around important technical zones instead of breaking out in one direction.
Technical Analysis – Trendline, Fibonacci, Volume Profile
The current H4 structure is a triangle model with:
A downward sloping trendline from the old peak 42xx.
An upward sloping trendline from the late October low, acting as dynamic support.
Zone 4060–4070: the "balance" price zone last week – where the price moved sideways the longest, serving as a reference point for the short-term trend.
Key levels: 4132: near resistance, coinciding with the VAH area of the current Volume Profile.
4171: higher resistance, near the Fibonacci 1.0 area of the recovery wave.
4242: Fibonacci extension confluence zone (1.618) + historical resistance – where strong profit-taking is likely.
4347: 2.618 expansion zone – reference target if the peak is successfully broken.
4022 and 3997: important support close to the lower trendline – main buy zone if there is a liquidity sweep.
When the price decisively breaks out of one of the trendlines, the new trend on H4 will be clearer; the trading plan will follow this breakout direction.
Risk management and invalidation
H4 closes below 3997: the triangle structure is broken downward, fully prioritizing sell orders to lower zones – at that point, medium-term buy orders should not be held.
H4 closes above 4245 with good volume: considered a successful triangle peak breakout, discard all sell orders in this area and focus on buying according to the new trend.
Which scenario are you leaning towards for next week: breaking up to test 4242–4347 or sweeping down to 4022–3997 before bouncing back? Leave a comment and follow the LiamTrading channel on TradingView for daily XAUUSD updates.

Part 1 Introduction to Candlestick PatternsThe Greeks: Heart of Option Trading
The Greeks measure how options change with market conditions.
1. Delta
Measures how much the premium moves compared to the underlying.
Call delta = +ve
Put delta = –ve
2. Theta
Measures time decay.
Always negative for buyers
Positive for sellers
3. Vega
Measures sensitivity to volatility.
High volatility = expensive options.
4. Gamma
Shows how Delta changes.
High Gamma = fast premium movement.

Gold NY Session Strategy 11/19: Will up to 4162Gold Daily Plan – SMC Outlook (Nov 20)
Framework: CHoCH – BOS – FVG – POI – Premium/Discount Model
1. Market Context
Gold continues to recover after the sharp drop earlier this week. Price is now approaching the Premium zone of the current bullish swing and tapping into H1 supply. The market shows:
Buyers still in short-term control
Momentum weakening as price reaches resistance
A corrective pullback into Discount is likely before any further expansion
2. Structural Overview (SMC Logic)
🔻 Overall Market Structure
A key BOS formed around 4090–4100 → confirms short-term bullish structure
Follow-up CHoCH signals continuation of the intraday uptrend
Price is moving toward the upper FVG + Supply Zone (4160–4162)
🔸 Orderflow Notes
Strong reaction at the 4140 area → clear presence of passive Sell Limit absorption
Demand POI at 4091–4089 held exceptionally well → main bullish mitigation zone
3. Trading Zones (POI)
✅ BUY Zone (Discount Area)
4091 – 4089
Demand + previous CHoCH + fib 1.272 confluence
Ideal low-risk long setup within Discount
Suggested SL: 4087
BUY Scenario:
Price retraces to POI → shows bullish reaction → long toward Premium.
❗️ SELL Zones (Premium Area)
Aggressive Sell Zone:
4143 – 4145
SL: 4147
Optimal Sell Zone:
4160 – 4162
Major supply + imbalance + fib 2.618 extension
Highest probability for reversal
SL: 4165
4. Trade Scenarios
📌 Primary Scenario (High Probability)
Price retraces into 4091–4089 Demand
Look for CHoCH/BOS confirmation on lower timeframe
Enter BUY → target 4143 → 4160
→ Classic SMC model: Buy from Discount → Sell from Premium.
📌 Alternative Scenario
If price rallies straight into 4143–4162 without retracement:
ONLY enter SELL when a clear bearish CHoCH or strong rejection forms
Target: 4100 → 4090
5. Intraday Bias
→ Bullish in Discount zones – Bearish in Premium zones.
Trade based on orderflow → Do not chase price in the middle range.
6. Summary
BUY: 4091–4089 (SL 4087) → TP: 4140 – 4160
SELL:
• 4143–4145 (SL 4147)
• 4160–4162 (SL 4165)
Wait for confirmation at each POI; avoid mid-range entries.

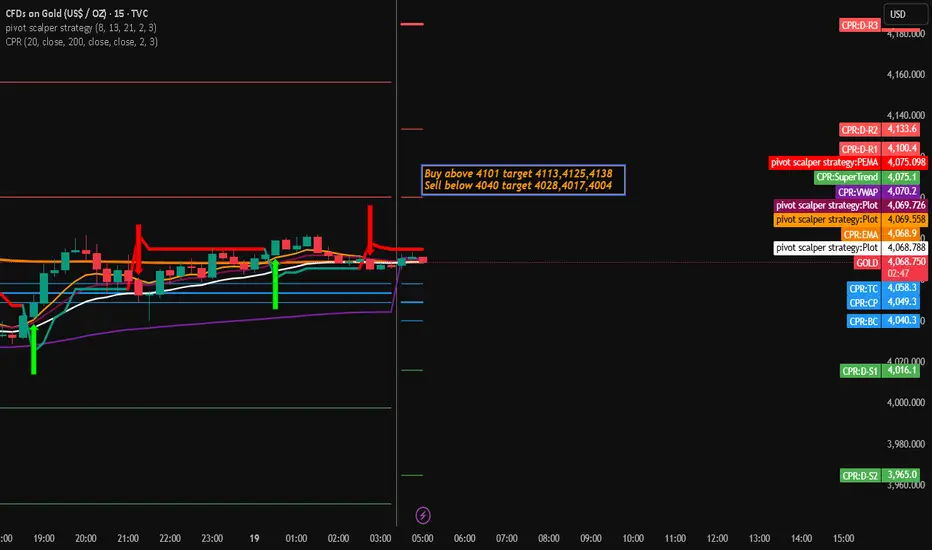
Gold Trading Stategy for 19th November 2025📈 Gold Trading Setup 💰
Buy Setup 🟢
Condition: Enter Buy if Gold (XAU/USD) closes above the high of the 15-minute candle.
Entry Level: Above 4101
Targets:
Target 1: 4113
Target 2: 4125
Target 3: 4138
Sell Setup 🔴
Condition: Enter Sell if Gold (XAU/USD) closes below the low of the 1-hour candle.
Entry Level: Below 4040
Targets:
Target 1: 4028
Target 2: 4017
Target 3: 4004
🛑 Important Disclaimer 📉
This is not financial advice. Trading involves substantial risk and may not be suitable for all investors. Only trade with capital you can afford to lose.
Do your own research (DYOR) before making any trading decisions.
Past performance is not indicative of future results.
Market conditions can change rapidly, and no strategy is foolproof.
Always use appropriate risk management, including stop-loss orders.
Gold Analysis & Trading Strategy | November 19-20✅ From the 4-hour chart, gold experienced a strong rebound yesterday, releasing some short-term bullish momentum. However, the price encountered significant resistance near 4132 (previous high + upper Bollinger Band).
The latest candle shows a large bearish candle with a long upper wick, which is a classic signal of bulls failing to break higher and profit-taking pressure intensifying.
MA5 and MA10 have started to turn downward, indicating weakening short-term momentum.
MA20 (around 4089) still provides partial support, but it has already been broken through quickly.
The upper Bollinger Band (around 4130) remains a strong resistance level, with price quickly falling below the mid-band after the spike.
The lower wick touched 4055, suggesting that short-term buying interest exists in this area.
The short-term rebound structure has been damaged, and the 4-hour timeframe has entered a corrective phase turning weaker again.
If gold breaks below 4058–4050, bearish momentum will strengthen further.
✅ On the 1-hour chart, gold formed a short-term high at 4132, followed by a sharp sell-off.
Two consecutive large bearish candles broke below MA5 / MA10 / MA20 / MA60, forming a classic one-sided reversal signal.
The bullish structure is completely broken, and moving averages have shifted back into a bearish alignment.
Key support lies at 4050–4049, a strong confluence support zone. Breaking below this area will open further downside potential.
The current small rebound is weak and only a technical correction, showing that bears still dominate the short-term price action.
The rebound only reached below MA20 (around 4085), showing that selling pressure above remains strong.
Short-term structure is bearish, and any weak rebound is unlikely to break above 4085–4090. After the rebound, price is still likely to retest the 4050 area.
🔴 Resistance Levels:4085–4090 / 4100–4110 / 4125–4132
🟢 Support Levels:4058–4050 / 4030 / 3998
✅ Trading Strategy Reference
🔰 Strategy 1: Short at 4085–4090 (Main Idea)
If gold rebounds to 4085–4090 and shows resistance:
Light short positions
Stop-loss: 4098
Targets: 4060 / 4050
👉 Current trend is bearish; selling rebounds is the main logic.
🔰 Strategy 2: Short again at strong resistance (Aggressive Short)
If gold rebounds to 4100–4110:
Medium-sized short positions
Stop-loss: 4118
Targets: 4065 / 4050
👉 This area is strong resistance; short-term breakout probability is low.
🔰 Strategy 3: Breakout shorts below 4050 (Trend-following)
If price breaks 4050:
Bearish momentum will accelerate
Targets: 4030 / 4000
👉 4050 is the key level determining whether bears will continue the downward move.
📌 Summary
4H rebound was rejected; structure turning weaker
1H shows a sharp breakdown; bears dominate short-term price action
4085–4090 is the main zone for selling rebounds
4050 is the most important support today—breaking it will open deeper downside
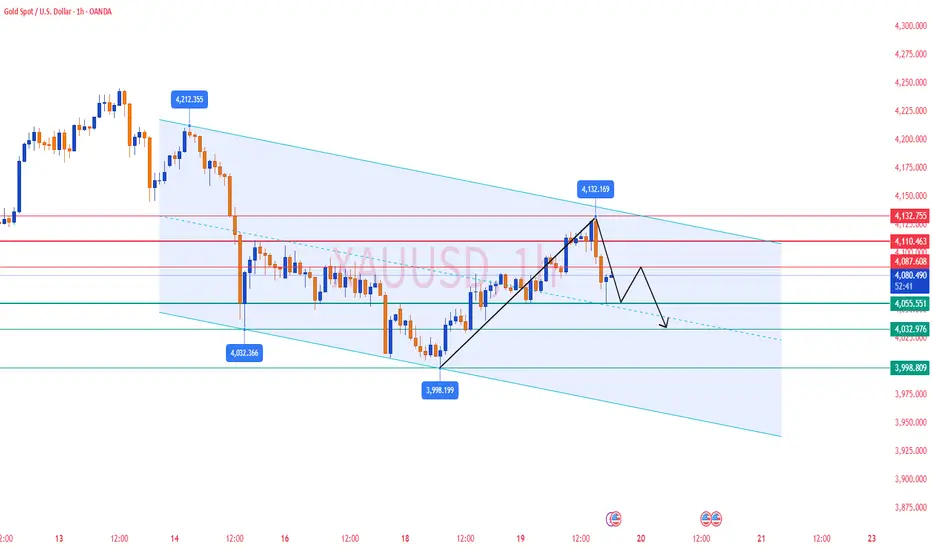

LiamTrading – XAUUSD H1 | Gold breaks bullish structure...LiamTrading – XAUUSD H1 | Gold breaks bullish structure, short-term downside takes control
Gold has dropped sharply by more than $20 in a short time, losing over 1% on the day and moving close to the lower 4,030 area. The previous bullish structure has officially been broken, 4040 failed to hold, and today’s focus continues to be selling with the trend until the 4000–398x support zone shows clear reactions.
Macro Analysis
Gold prices declined as expectations for a December rate cut weakened: JPMorgan no longer forecasts a Fed rate cut in December, opposite to their earlier 25 bps cut scenario.
Some institutions still believe rising unemployment and weaker economic data may force the Fed to cut 25 bps at the upcoming meeting.
The market is currently pricing the probability of a December rate cut at nearly “50–50,” creating strong uncertainty and putting short-term pressure on gold, even though the metal still benefits in the long term if the rate-cut cycle begins.
Technical Analysis H1 – Bearish structure, price channel, and support zones
After breaking below 4040, price formed a series of Lower Highs – Lower Lows, confirming a Dow-theory bearish structure on H1.
A falling channel is forming; the channel’s upper boundary aligns with the short-term resistance zone at 4050–4060.
4000 zone: a key psychological support. If broken decisively, the medium-term structure may shift into a deeper corrective phase.
Buy Zone 3987–3989
Strong support confluence + Fibonacci extensions (1.618/2.272) of the current bearish swing
Optimal area for catching a corrective bounce if clear reversal signals appear
Key Resistance Levels Today
4052–4054: retest of former support + upper boundary of falling channel → ideal area for a pullback-sell setup.
Trading Scenarios Today (LiamTrading)
Scenario 1 – SELL with the prevailing downtrend (priority)
Entry: 4052–4054
SL: 4060
TP: 4030 → 4015 → 3990
Logic: Price retraces to resistance + channel top, suitable for trend-continuation selling. Prefer setups where M15 shows rejection candles (pin bar/bearish engulfing) around 405x.
Scenario 2 – BUY at strong support 398x (counter-trend bounce)
Entry: 3987–3989
SL: 3980
TP: 3999 → 4014 → 4040 → 4080
Logic: 398x is a high-confluence support zone; trigger only when clear price reaction appears (long lower wicks or reversal patterns on M15–H1).
This is counter-trend, so use smaller position sizes and take partial profits.
Risk Notes & Invalidation
H1 closes above 4060: short-term bearish structure weakens → pause all sell setups and reassess.
H1 closes below 3980: buy zone fails → downside could extend further; only sell setups preferred.
Always keep risk per trade at 0.5–1%, and once reaching +1R, move SL to break-even.
Are you leaning towards continuing to sell with the trend, or waiting to buy the dip at 398x?
Follow LiamTrading on TradingView for daily XAUUSD updates

XAUUSD MULTI TIMEFRAME ANALYSIS Hello traders , here is the full multi time frame analysis for this pair, let me know in the comment section below if you have any questions , the entry will be taken only if all rules of the strategies will be satisfied. wait for more price action to develop before taking any position. I suggest you keep this pair on your watchlist and see if the rules of your strategy are satisfied.

Cup and Handle Detected: A Bullish Outlook for XAUUSDOANDA:XAUUSD is forming a very clear Cup and Handle pattern. Price previously dropped toward the 4000 region, rounded out, and then climbed back toward 4080, completing the cup structure. At the moment, the market is making a mild pullback and shaping a tight and well controlled handle.
If price can break this resistance with strong momentum, the next target I expect is around 4150. Until a confirmed breakout appears, patience remains essential. No breakout means no trade.
This is a classic bullish formation, and market expectations are gradually strengthening.
