Elliott Wave Analysis – XAUUSD (October 22, 2025)
🔹 1. Momentum
D1:
The D1 momentum is preparing to turn bullish, signaling the start of a new upward trend.
→ We can expect at least 3–5 consecutive bullish days ahead.
H4:
We need to wait for the H4 candle to close to confirm the reversal signal.
If confirmed, there’s a strong possibility that tod

XAUUSDLast day was consolidating and has generated sell side liquidity. There could be possibility the price sweeps that liquidity and then reverse from the Marked Demand zone.
We have Imbalace left in 15M
We have Equal lows. Srong liquidity pool.
Below Eq low we have Demand zone.

Is Gold (XAUUSD) Set for a Major Pullback? Short Below 4185!Gold has been in a massive range between 3500 and 3120 (a 320-point base). Following the breakout, we witnessed an explosive rally up to 4380 —an 880-point surge, nearly 2.5x the previous range!
But now, caution is warranted. Gold has formed a bearish reversal candle at the peak, and the RS
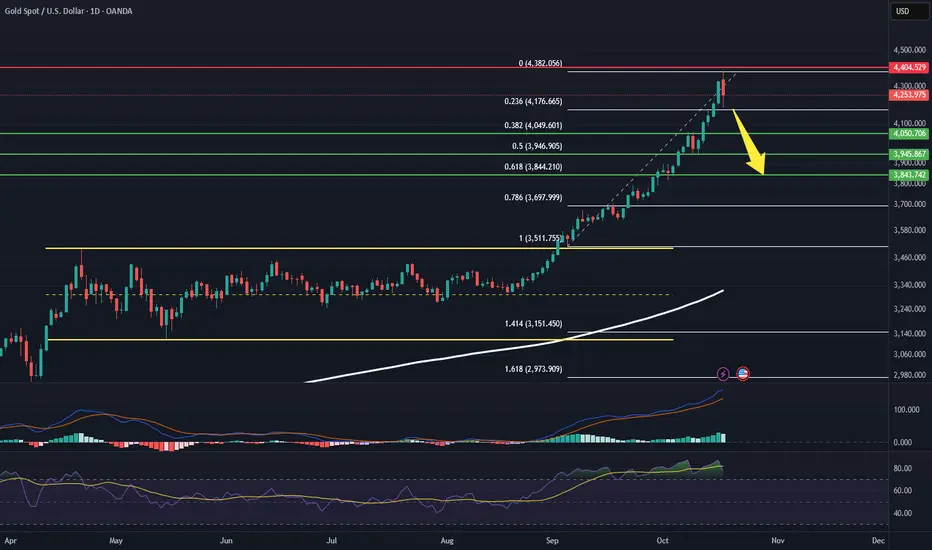
XAU/USD (Gold vs USD) 4H chart:XAU/USD (Gold vs USD) 4H chart:
I can see a clear double top pattern near the 4,330 zone (circled areas).
Price has broken the ascending trendline and is currently retesting near the 4,080–4,100 resistance zone (previous support).
The green zone shows the neckline area that price already broke be

XAU/USD (Gold) chart on the 3-hour timeframe...XAU/USD (Gold) chart on the 3-hour timeframe, I can see my using the Ichimoku Cloud and have marked a range with a potential breakdown area and a target point already indicated on the chart.
Here’s what the chart suggests:
Current price: around 4031 USD
Range low (support): around 4030 USD (which

Fair Value Gap Zones (FVG)🟢 Bullish Scenario
Buyers may step back in around these FVG zones:
Zone 1: 4325–4330
Zone 2: 4310–4315
Zone 3: 4285–4290
These are possible liquidity refill points for another push upward.
📈 Buy Plan
Entry: 4325–4330
Stop-loss: Below 4310
Take-profit: 4355 → 4365


Gold Buy EntryGold has given good sell and requires a short correction as well looking into 4hr time frame double top and can come back neck line and go for short again - logic.
Good break of Trendline and pattern gave confirmation for buy target -
1) 4147
2) 4200

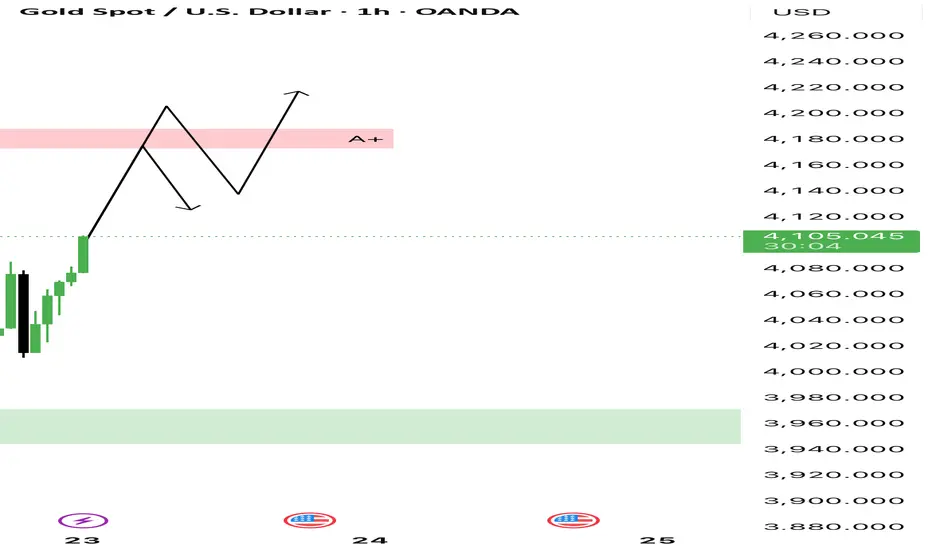
Gold 1H – Slight Correction or Bullish Reaccumulation Ahead?XAUUSD – Intraday Trading Plan | by Khang_Trader
📈 Market Context
Gold is currently trading around $4,110/oz as traders digest a mix of macroeconomic signals and shifting expectations surrounding the Federal Reserve’s next moves.
The market focus today centers on U.S. housing-starts and jobless-cl

Trade Setup Explanation (Elliott Wave Correction)This chart shows a corrective wave structure (A–B–C), indicating that the market has likely completed its downward correction phase and is now gearing up for a potential bullish continuation.
• Wave (A) – Strong bearish leg marking the start of the correction.
• Wave (B) – A temporary pullback bef
See all ideas
Displays a symbol's price movements over previous years to identify recurring trends.