Gold Blockbuster Rally Reaches $4246, Bulls Eyeing $4300-$43506.Inflation Hedge Appeal-
Sticky inflation in key economies keeps investors hedging against potential price surges. Gold remains the ultimate protection in uncertain macro conditions.
7. ETF and Hedge Fund Inflows Rising-
Recent data show renewed ETF inflows, confirming investor conviction that Gold remains a strategic allocation during global market uncertainty.
8.The lingering US government shutdown shows no signs of agreement to resolve the deadlock.
Technical Drivers:
1.Trend Structure:
Gold continues its bullish advance and scorching rally, trading well above the 1 Hour 50 EMA aligning with psychological zone $4200, confirming strong upward momentum.
2.Breakout Confirmation:
Price broke decisively above $4200, confirming continuation of the bullish wave toward immediate resistance $4250 above which way opens to next leg higher $4268 followed by extension to $4280.
3.Support Zone:
Immediate support rests at $4200 below which retracement comes for $4190-$4175, followed by $4160. A sustained move above these levels keeps bulls in control.
4.Resistance Zone:
Next key resistance is seen near $4268-$4280, and a breakout could target $4318–$4350.
5.Momentum Indicators:
4 Hour RSI reading of 77 is indicating bullish strength without extreme overbought conditions. RSI on Daily and Weekly time frames read 85 which indicates overbought conditions. Monthly RSI reading at 92 is extremely overstretched and calls for high caution on heights.
6.Intraday Outlook:
Buying on dips remains the preferred strategy as long as price holds above $4200 support zone.
Trade ideas

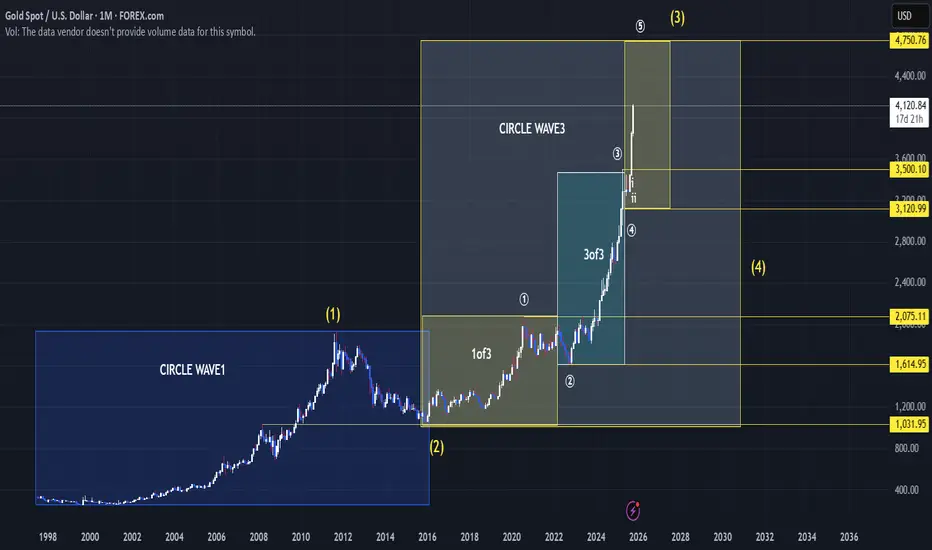
Elliot wave Gold price predictionIn my opinion that gold can hit 4700+ in next few months, as you can see my chart that circle wave 3 is going on and we are in 3 of 3rd wave right now so may be possible price will take pull back after hit 4230 or nearest it and wave 4of 3 will unfold after correction price will take bounce back near 3750 to 3700 then price will complete 5 of 3 and circle wave 3 should complete. its my idea not trading advise.
XAUUSD DOWNSIDE VIEW confirmations aligned for a potential bearish move:
✅ Volume analysis completed
✅ Trendline breakout confirmed
✅ Channel breakout confirmed
✅ Candle confirmation done
Now it’s time to wait patiently for price action to unfold.
⚠️ Important news ahead — expect high volatility, manage risk carefully.

How AI Predicts Market Moves1. Introduction to AI in Financial Markets
Artificial Intelligence refers to machines and algorithms that simulate human intelligence. In financial markets, AI systems process vast amounts of structured and unstructured data to identify patterns, detect trends, and make predictions. Unlike traditional statistical models, AI can learn from data, adapt to new information, and handle complex non-linear relationships that are often invisible to humans.
AI in finance is broadly used in three areas:
Algorithmic trading: Automated buying and selling of securities based on pre-defined rules.
Risk management: Forecasting potential losses, market shocks, or portfolio volatility.
Market prediction: Anticipating stock price movements, market trends, and economic events.
Market prediction is the most dynamic application because it requires analyzing constantly changing data from multiple sources simultaneously.
2. Types of Data Used by AI
The accuracy of AI predictions largely depends on the data it processes. Financial markets generate enormous amounts of data, which AI leverages to make informed decisions. The main types of data include:
2.1 Structured Data
Structured data refers to organized data that fits into rows and columns, such as:
Historical stock prices
Trading volumes
Earnings reports
Economic indicators (GDP, unemployment rates, inflation)
AI models analyze this data to identify trends and correlations. For example, historical price movements can reveal patterns of bullish or bearish behavior.
2.2 Unstructured Data
Unstructured data is information that does not fit neatly into spreadsheets but holds critical insights, such as:
News articles
Social media posts
Financial blogs
Company press releases
Natural Language Processing (NLP), a subset of AI, allows machines to read, interpret, and extract sentiment from this type of data. Market sentiment analysis is particularly powerful in predicting short-term price movements, as it gauges public opinion and investor psychology.
2.3 Alternative Data
Alternative data refers to unconventional sources that provide indirect market insights, including:
Satellite images (e.g., estimating retail sales from parking lot activity)
Web traffic and search trends
Weather patterns affecting commodities
These data points, when integrated with traditional financial metrics, enhance prediction accuracy.
3. AI Techniques Used for Market Prediction
Several AI techniques are used in predicting market moves. Each method has unique advantages, and many successful systems combine multiple approaches.
3.1 Machine Learning
Machine learning (ML) enables systems to learn patterns from data without being explicitly programmed. Some common ML methods include:
Supervised Learning: Uses historical labeled data (e.g., past stock movements) to predict future prices. Algorithms like Random Forests, Support Vector Machines, and Gradient Boosting are common.
Unsupervised Learning: Identifies hidden patterns without predefined labels, useful for market clustering and anomaly detection.
Reinforcement Learning: AI agents learn trading strategies by interacting with the market environment, receiving rewards for profitable actions.
3.2 Deep Learning
Deep learning is a subset of ML that uses neural networks to model complex relationships. Applications in market prediction include:
Recurrent Neural Networks (RNNs): Effective for sequential data like stock prices over time.
Long Short-Term Memory (LSTM): A type of RNN that remembers long-term dependencies, useful for predicting future trends based on historical sequences.
Convolutional Neural Networks (CNNs): Surprisingly, CNNs can process financial charts as images to detect technical patterns.
3.3 Natural Language Processing (NLP)
NLP allows AI to understand human language. In market prediction, NLP is used to:
Analyze news sentiment to anticipate market reactions
Detect insider rumors or earnings reports before they impact prices
Monitor social media for trends, fear, or hype
For example, a sudden surge in negative sentiment about a company on social media might trigger AI algorithms to predict a stock price decline.
3.4 Hybrid Models
Many sophisticated AI systems combine multiple techniques. For instance, an AI model might use deep learning to analyze historical prices, NLP for sentiment analysis, and reinforcement learning to execute trading decisions.
4. The Prediction Process
The process of AI-driven market prediction typically involves the following steps:
4.1 Data Collection
Data is gathered from multiple sources, including stock exchanges, financial news portals, social media, and alternative data providers.
4.2 Data Preprocessing
Raw data often contains noise, missing values, or inconsistencies. AI systems clean, normalize, and structure the data for analysis.
4.3 Feature Engineering
Key attributes (features) are extracted from the data that may influence market movements, such as price-to-earnings ratios, sentiment scores, or trading volume spikes.
4.4 Model Training
AI models are trained on historical data to learn patterns. For supervised learning, the model learns the relationship between features and outcomes, such as predicting a stock’s next-day price.
4.5 Prediction and Validation
Once trained, the model makes predictions on new, unseen data. Performance is validated using metrics like accuracy, precision, or mean squared error. Continuous retraining is often necessary as markets evolve.
4.6 Decision Execution
In trading applications, AI predictions can automatically trigger buy or sell orders. In advisory contexts, the output guides human traders’ decisions.
5. Advantages of AI in Market Prediction
AI offers several advantages over traditional analysis:
Speed: AI processes vast datasets faster than humans.
Accuracy: It identifies complex patterns and non-linear relationships.
Adaptability: Machine learning models evolve with new data, reducing reliance on static rules.
24/7 Monitoring: AI can continuously monitor global markets, news, and social media.
Emotion-Free Trading: Unlike humans, AI is not influenced by fear or greed, which often drive irrational decisions.
6. Challenges and Limitations
Despite its promise, AI in market prediction faces challenges:
Data Quality: Poor or biased data can lead to inaccurate predictions.
Overfitting: Models may perform well on historical data but fail in real-world conditions.
Market Complexity: Sudden geopolitical events or natural disasters can defy even the best AI models.
Interpretability: Deep learning models can be “black boxes,” making it hard to explain why a certain prediction was made.
Ethical Concerns: AI-driven trading can lead to market manipulation or flash crashes if misused.
7. Real-World Applications
AI is already transforming trading floors and investment strategies:
High-Frequency Trading (HFT): Firms use AI to execute thousands of trades per second based on micro-market trends.
Robo-Advisors: AI-driven platforms recommend personalized investment portfolios based on user goals and risk tolerance.
Sentiment-Based Trading: Hedge funds use NLP to predict stock movements based on news sentiment or social media trends.
Risk Management: Banks employ AI to forecast potential market shocks and manage portfolio exposure.
8. The Future of AI in Market Prediction
AI’s role in financial markets is expected to grow, driven by:
Integration of more alternative data: Incorporating satellite data, IoT sensors, and real-time analytics.
Explainable AI: Developing models that provide clear reasoning for predictions.
Hybrid human-AI decision-making: Combining AI speed with human judgment for better outcomes.
Regulatory oversight: As AI-driven trading becomes dominant, regulators are increasingly focusing on risk mitigation and transparency.
The synergy between AI and human expertise promises a future where market predictions are faster, smarter, and more adaptive than ever before.
9. Conclusion
Artificial Intelligence is revolutionizing how market moves are predicted. By processing massive datasets, identifying hidden patterns, and continuously learning, AI empowers investors and traders to make informed decisions. While it is not infallible and carries inherent risks, its ability to analyze complex market dynamics far exceeds traditional methods. As AI technology continues to advance, its predictive capabilities will become an indispensable tool for navigating the fast-paced, unpredictable world of financial markets.

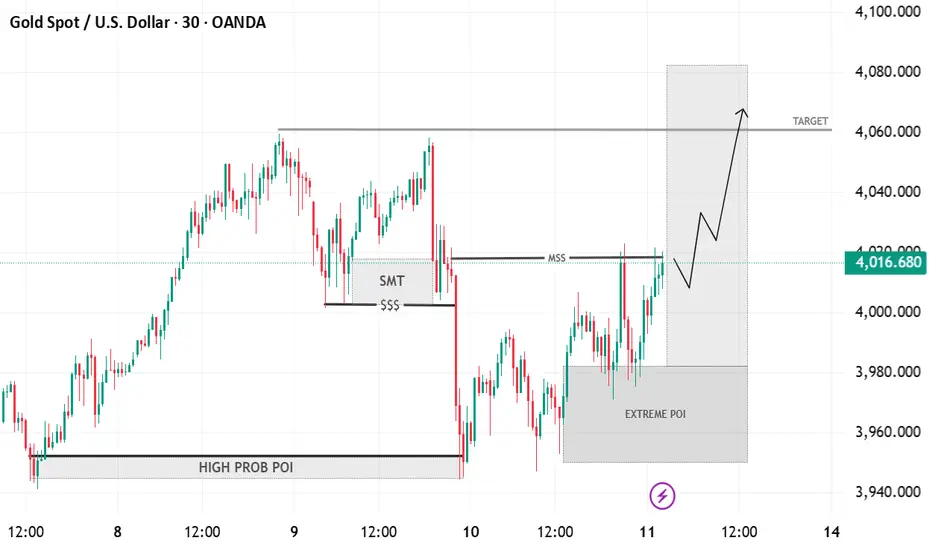
Gold–Bullish Reversal Setup from Extreme POI Toward 4060 TargetTimeframe: 30-minute chart (XAU/USD – Gold Spot vs U.S. Dollar)
Market Structure:
Price made a structural low (SMT) around the $$$ liquidity zone.
A Market Structure Shift (MSS) occurred as price broke above short-term highs.
POI (Point of Interest) Zones:
High Probability POI: Previous accumulation zone that caused a bullish impulse.
Extreme POI: Current demand zone (around 3960–3980), where price is rebounding.
Current Price Action:
Price has reacted bullishly from the Extreme POI.
The breakout above MSS signals possible continuation to the upside.
Target Zone:
The shaded grey target area (~4060–4080) aligns with previous liquidity highs.
Bias:
Bullish short-term bias toward 4060–4080 zone, assuming the demand zone holds.
Break below Extreme POI would invalidate the setup and suggest deeper retracement.
Elliott Wave Analysis – XAUUSD | October 14, 2025📊
________________________________________
🔹 1. Momentum
D1:
Daily momentum has started to turn upward from the oversold zone, suggesting that the bullish pressure may continue throughout the week.
H4:
On the H4 chart, momentum is stuck together in the overbought zone, indicating that a reversal could occur at any moment.
Currently, there have been 13 consecutive bullish candles in the H4 momentum cycle — a typical length before a reversal often appears.
👉 Therefore, avoid chasing long positions (Buy) at this stage.
H1:
H1 momentum is also deep in the overbought area, which means a short-term correction could take place soon.
________________________________________
🔹 2. Wave Structure
D1:
The current pattern shows that Wave 5 is extending, which makes it difficult to project the exact target using Fibonacci ratios.
However, an extended fifth wave usually ends with a sharp and decisive decline, which serves as a confirmation that Wave 5 has completed.
H4:
Price is currently forming Wave 5 (yellow), which also represents Wave 3 (purple) in the higher degree.
Thus, the uptrend is still intact for now.
Once Wave 5 (yellow) — equivalent to Wave 3 (purple) — finishes, the market will likely enter a corrective phase (Wave 4 purple), which would align with a momentum reversal on H4.
H1:
On the Elliott channel drawn from Wave 2 → Wave 4 → Wave 3 (yellow), price has broken above the upper boundary, which could be a throw-over pattern.
If price returns and closes back inside the channel, it would confirm the completion of Wave 5.
Connecting Wave 1 and Wave 3 highs, we can see that price is now above this trendline, and the 4157 zone coincides with the 0.618 Fibonacci extension of Waves 1–3 — forming a strong confluence area where a correction is likely to begin.
________________________________________
🔹 3. Trading Plan
At the moment, price is sitting around a major top, where the Monthly Wave 3 and the Weekly Wave 5 structures converge.
👉 This means volatility could be high and unpredictable.
For now:
• Avoid swing trades,
• Focus only on short-term scalp opportunities with tight targets,
• Wait for a clear confirmation signal at the top zone before entering new positions.

Gold Maintains Upward Channel Toward $4320 TargetAnalysis:
The XAU/USD 45-minute chart shows gold continuing its steady rise within a well-defined ascending channel. The price action maintains higher highs and higher lows, confirming a sustained bullish trend.
Currently, gold is testing the midline of the channel, suggesting a possible minor pullback before resuming upward momentum toward the projected resistance near $4320. This level aligns with the upper boundary of the channel, acting as the next potential target zone for buyers.
As long as the price remains above the lower channel support, the bullish structure remains intact. A breakout above $4320 could open further upside potential, while a drop below the channel could signal early weakness or short-term consolidation.

Gold Trading Strategy for 17th October 2025💰 GOLD INTRADAY TRADE PLAN 💰
🟢 BUY SETUP
📈 Buy Above: The high of the 15-minute candle that closes above $4372
🎯 Targets:
1️⃣ $4383
2️⃣ $4395
3️⃣ $4410
💪 Momentum confirmation required — wait for a strong bullish close above $4372 before entering.
🔴 SELL SETUP
📉 Sell Below: The low of the 15-minute candle that closes below $4278
🎯 Targets:
1️⃣ $4265
2️⃣ $4250
3️⃣ $4235
⚡ Wait for a decisive bearish candle close below $4278 to confirm breakdown.
⚙️ TRADE MANAGEMENT TIPS
💼 Always use a Stop Loss to protect your capital.
📊 Avoid over-leveraging — risk only 1–2% per trade.
🧭 Confirm entries with volume and trend direction before execution.
⚠️ DISCLAIMER ⚠️
This analysis is for educational and informational purposes only.
📉 Trading in commodities and derivatives involves substantial risk and may not be suitable for all investors.
💡 Always conduct your own research or consult a certified financial advisor before taking any trading decision.

Gold sweeps SL, wait for BUY LIMIT at Demand Zone 4,223-4,225Timeframe analysis: H4/30M
Logic: Trend Continuation after liquidity sweep.
MARKET STRUCTURE ANALYSIS (SMC Analysis)
Main Trend: Bullish (Price is moving within a parallel channel).
Structure Confirmation (BOS): The chart has confirmed an upward Break of Structure (BOS), indicating that buyers are controlling the market.
Liquidity Sweep/Fake: The strong bearish candle (marked as "Fake") is a move to sweep Stop Losses of early buyers and gather liquidity before Smart Money pushes the price in the main direction. This is an Inducement action.
Key Demand Zone (POI/Demand Zone/Order Block): The TIMING BUY area (4,223.154 - 4,225.000) is a potential Demand Zone/Order Block identified by Smart Money. The price is expected to retest this area before continuing to rise.
MAIN TRADING SCENARIO (LONG SETUP)
SCENARIO: Wait for the price to Pullback to the POI area to enter a buy order, continuing the main bullish trend.
Parameter
Value
SMC Description
Action
BUY LIMIT
Place a pending buy order
Entry Zone (POI)
4,225.000 - 4,223.150
Demand Zone/Order Block after liquidity sweep.
Stop Loss (SL)
4,214.390
Place below the low of the liquidity sweep candle ("Fake Low"), ensuring safety.
Take Profit 1 (TP1)
4,240.000
Target the nearest Swing High.
Take Profit 2 (TP2)
4,250.000
Target psychological resistance and mid-channel.
Take Profit 3 (TP3)
4,260.000+
Target the upper boundary of the parallel channel.
R:R Ratio
Approximately 1:2.5 to 1:3.5 (Depending on TP)
Good R:R ratio for a trend-following trade.
RISK MANAGEMENT
Risk: Only risk a maximum of 1-2% of the account for this trade.
Breakeven: When the price hits TP1, move SL to the Entry point (Breakeven) to protect capital.
Invalidation: If the price closes the D1/H4 candle below the SL level (4,214.390), the buy plan will be invalidated.

GOLD / XAUUSD – DAILY PLAN (Oct 17, 2025)🧭 MARKET CONTEXT
Main timeframe: M30 / H1
Current structure remains bullish, forming clear HH – HL sequences.
After a strong rally, price is now in a retracement phase toward a nearby demand zone aligned with the ascending trendline.
No sign of structure break yet (no BOS below the previous HL).
📈 PRIMARY SCENARIO (BUY SETUP)
➤ Entry Zone 1:
BUY GOLD 4280 – 4278
Stop Loss: 4275
Target 1: 4335
Target 2: 4350 (new HH)
Reason: This is a Bullish Order Block (OB) and BOS retest zone, aligned with the rising trendline.
Expecting a strong bullish reaction (rejection candle or engulfing bar) before triggering the buy limit.
➤ Entry Zone 2 (CP Setup – Confirmation Point)
BUY 4247 – 4245
Stop Loss: 4239
Target: 4300 / 4330 / 4350
Reason: This is the final demand zone near the main trendline, confluence of prior BOS + SSS (Structure Shift Support).
If price breaks below 4280 without reaction, patiently wait for confirmation around CP zone.
⚠️ ALTERNATIVE SCENARIO (STRUCTURE FAILURE)
If price closes below 4235 on M30, the bullish structure is invalidated.
→ The buy plan is canceled — wait for a pullback sell setup from 4280–4300 resistance.
If the buy stop loss is hit at 4239, monitor 4200 zone as the next H4 demand area.

Part 1 Support and Resistance Role of Option Writers (Sellers):
Option writers, or sellers, play a crucial role in the options market. They create options contracts and earn a premium from buyers. In return, they take on the obligation to buy (for put options) or sell (for call options) the underlying asset if the buyer exercises the contract. While writers benefit from time decay—since options lose value as expiration nears—they also face significant risk, especially in uncovered (naked) positions. For example, a call writer could face unlimited losses if the asset’s price rises sharply. Hence, writing options demands careful risk assessment and margin management.

Elliott Wave Analysis – XAUUSD (13/10/2025)
________________________________________
🔹 1. Overview
In the previous plan, I predicted an upward correction after a panic sell-off, which was identified by an unusually extended blue wave C on H1.
________________________________________
🔹 2. Momentum
D1 Momentum is currently reversing downward, however, since price and momentum are diverging, the bullish pressure remains strong.
H4 Momentum has now entered the overbought zone, so within the next 1–2 H4 candles, a corrective decline may occur.
H1 Momentum is currently falling, while price is moving sideways, so we should continue observing this zone carefully.
________________________________________
🔹 3. Wave Structure
D1 Chart:
• Price is still within the yellow wave 5.
• Although D1 momentum is declining, the extended wave 5 structure suggests that once a correction begins, the first drop will likely be steep and deep.
• The divergence between D1 candles and D1 momentum only signals weakening bullish strength, not yet a confirmed reversal.
H4 Chart:
• Price is currently moving along the upper boundary of the channel.
• Earlier, a blue ABC structure completed, and now price is forming three consecutive peaks near the previous high.
• This setup hints at a WXY pattern, where wave Y may develop as either:
1️⃣ A Flat (5-wave) pattern, or
2️⃣ A Triangle.
H1 Chart:
• A blue ABC correction has been completed, followed by a rally back to the previous top.
• Price is now moving sideways around this zone.
• Given that the ABC correction is done, there are two possible outcomes:
o (1) The correction is complete, and price is now in a 5-wave impulsive rally, meaning further upside.
o (2) The correction is still developing, and price may continue to drop as described in the H4 scenarios.
________________________________________
🔹 4. Additional Notes
• The current wave structure shows significant overlap, and given the previous panic sell, this slow recovery makes sense — it likely represents a leading diagonal (wave 1 triangle).
• In such a case, once price breaks out of the channel, it should accelerate sharply into a strong wave 3.
• However, since price remains sideways, this scenario may instead represent wave X of a continuing correction.
⚠️ Important:
Unlike the Friday Buy setup, which had strong confluence, the current scenario presents two conflicting possibilities, so the probability is not high.
________________________________________
🔹 5. Trade Plan
Sell Setup (Short-Term):
• Sell Stop: 4040
• SL: 4058
• TP1: 4010
Risk Management:
If price rises strongly above, confirming wave 3 behavior, then cancel the Sell setup.
As mentioned, this signal has lower probability and a relatively wide stop, so it’s better to either observe or enter with a small position size.

XAUUSDLadies & Gentlemen, you all are seeing this is the chart of gold (XAUUSD). This is one of the most popular charts in the world. Everyone wants to predict.
We have started counting this cycle from the low created by Gold on 6 October 2023. We have done two cycles in it, the first cycle is of 63 trading days, and the second is its double i.e. 126 trading days.
In the shorter cycle (63 BAR), you will see that it has maximum given 10 to 18% returns till date within EVERY 90 days
It has more than doubled in the last two years.And no down train cycle has started yet. And this is nine Cycles from Small Cycle.
Do you think this cycle will continue to grow like this in the future?

XAUUSD/GOLD 1H BUY STOP PROJECTION FOR 17.10.25Chart Info
Instrument: XAU/USD
Timeframe: 1 Hour (H1)
Price: $4,279.99
Strategy: Buy Stop — Trend Continuation
🟦 Market Structure & Trend:
Price is respecting a strong uptrend channel — clearly defined higher highs & higher lows.
Golden Ratio (Fibonacci) at 0.5 (4242.62) and 0.618 (4251.84) acts as premium entry zone for a retracement buy.
Bullish structure remains intact above 4230 zone.
📊 Entry & Target Zones:
✅ Entry Zone: Around 4250 (Golden Fibo + FVG)
🛑 Stop Loss: Below 4230 (structure break = invalidation)
🥇 Target 1 (R1): 4280 (in-channel move)
🥈 Target 2 (R2): 4310 (new ATH projection)
🧭 Technical Confluences:
📈 Uptrend Channel Support — Price expected to bounce after retest.
🟪 15 min Fair Value Gap (FVG) — potential wick entry below 4250.
📐 Golden Ratio Zone — ideal institutional entry point.
🔄 Break & Retest structure — previous resistance now support.
⚠️ Risk & Confirmation:
If candle closes below 4230, trend structure weakens — setup invalid.
Watch for NY Session volatility or major news for breakout momentum.
Partial profit booking near R1 and trailing SL above entry for R2 recommended.
✅ Summary of Plan:
Buy stop setup at retracement zone (4250 area).
SL tight below structure (4230).
TP 4280–4310 with trend continuation.

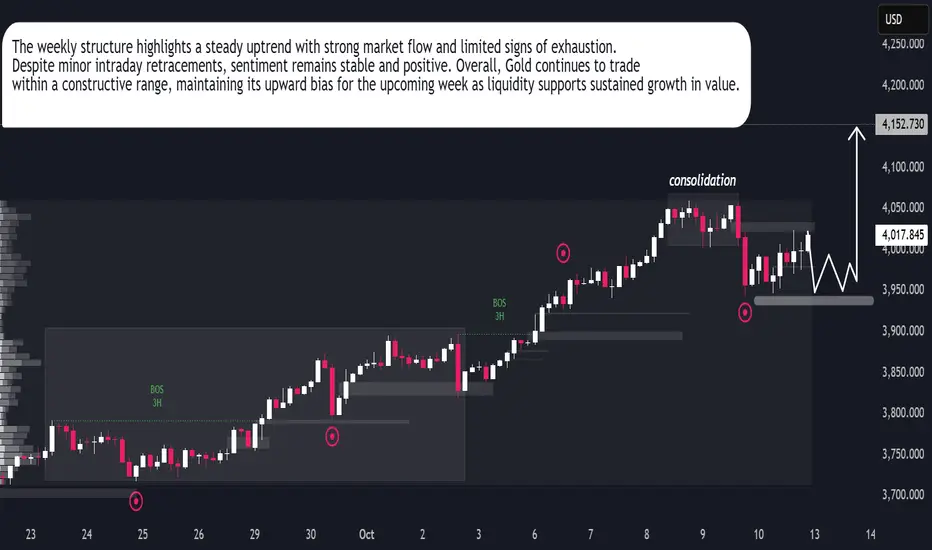
XAUUSD | Bulls Maintain Weekly ControlGold continues to display firm momentum as investor confidence remains stable despite short-term fluctuations. The latest weekly candle structure shows price holding within a steady consolidation range, signaling accumulation rather than weakness. Market behavior suggests large participants are preparing for another expansion phase after absorbing liquidity in the lower zones.
Institutional interest remains evident, with consistent buying pressure observed on dips, indicating sustained optimism for further growth. The current behavior aligns with broader market sentiment favoring safe-haven assets amid global uncertainty. Overall, Gold retains its dominance as capital flows stay supportive of the uptrend, positioning the metal for renewed strength in the upcoming sessions.
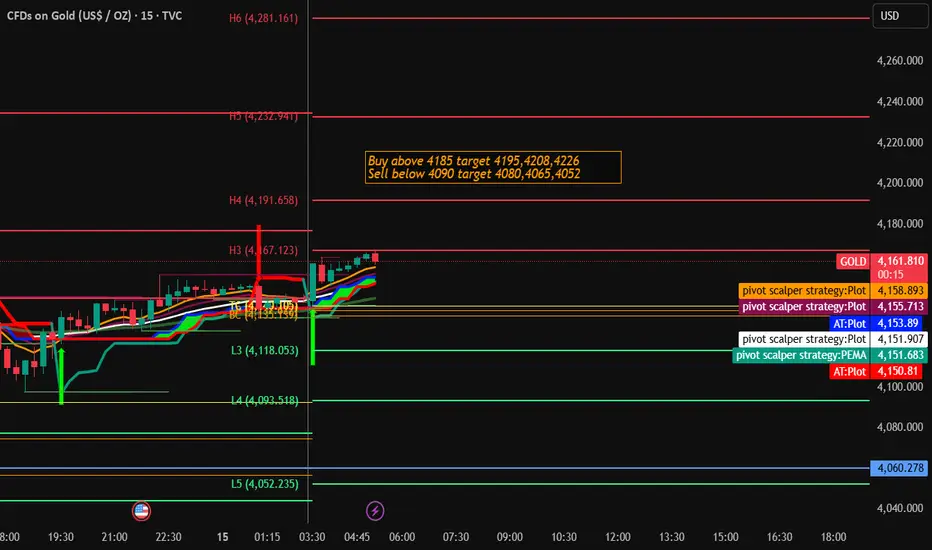
Gold Trading Strategy for 15th October 2025📊 GOLD INTRADAY TRADE PLAN
💰 Buy Setup
🔹 Entry: Buy above the high of 15-min candle if it closes above $4185
🎯 Targets:
$4195
$4208
$4226
🛑 Stop Loss: Low of the breakout candle or as per risk appetite
📉 Sell Setup
🔹 Entry: Sell below the low of 15-min candle if it closes below $4090
🎯 Targets:
$4080
$4065
$4052
🛑 Stop Loss: High of the breakout candle or as per risk appetite
⚙️ Trade Notes:
✅ Wait for a clear candle close confirmation before entry.
✅ Use position sizing based on your capital and risk level.
✅ Book partial profits at each target and trail your stop-loss.
✅ Avoid trading during high-impact news for better accuracy.
⚠️ Disclaimer:
📜 This content is for educational and informational purposes only. It is not investment advice. Trading in commodities, forex, or derivatives involves substantial risk. Please do your own analysis or consult a financial advisor before trading.
XAUUSD // Liquidity Grab // ATH# Gold Spot / U.S. Dollar - Liquidity Analysis
Market Structure Analysis
Key Liquidity Zones Identified
The chart highlights two critical liquidity zones where significant price action is anticipated:
**Upper Liquidity Zone: $4,212 - $4,219**
This zone represents an area of accumulated buy-side liquidity, typically formed by stop-losses from short positions and buy-stop orders. The red shaded area indicates where institutional players may target for liquidity capture before potential reversals.
**Lower Liquidity Zone: $4,157 - $4,162**
This zone marks the sell-side liquidity area, where stop-losses from long positions and sell-stop orders cluster. This level serves as a potential magnet for price action seeking to capture liquidity before any significant directional move.
Technical Setup
**Channel Pattern**
Gold is currently trading within a well-defined ascending channel on the intraday timeframe. The parallel trend lines show:
- Consistent higher highs and higher lows
- Price currently positioned in the mid-range of the channel
- Recent bounce from the lower channel boundary
**Demand Zone**
A marked demand zone is visible at lower levels, indicating previous buying interest and potential support.
Price Action Scenarios
Bullish Scenario (Green Path):
If price maintains support at current levels or the lower demand zone, we could see:
1. Continuation toward the upper liquidity zone ($4,219)
2. Potential liquidity sweep above this zone
3. Possible rejection after capturing buy-side liquidity
Bearish Scenario (Red Path):
If price fails to hold current structure:
1. Drop toward the lower liquidity zone ($4,162)
2. Liquidity grab below this level
3. Potential reversal after capturing sell-side liquidity
#Liquidity Concept
The annotation "Liquidity !!!!!!" emphasizes the importance of these zones. In institutional trading theory, price often moves to areas of high liquidity (where stop-losses cluster) before making significant directional moves. This is commonly referred to as a "liquidity sweep" or "stop hunt."
Trading Considerations
When price approaches either liquidity zone, traders should watch for:
- Rejection wicks suggesting liquidity capture completion
- Break and retest patterns for confirmation
- Changes in momentum indicators
Risk Management Notes
- The 5-minute timeframe requires precise execution and tight risk management
- Liquidity zones can be quickly swept through in volatile conditions
- Always use appropriate position sizing relative to account risk tolerance
- Consider wider timeframe context for overall trend direction
Disclaimer
This analysis is provided for educational purposes only and represents a technical perspective on price structure and liquidity zones.
It is not financial advice or a recommendation to buy or sell. Gold trading involves substantial risk of loss. Always conduct your own research, use proper risk management, and consider consulting with a qualified financial advisor before making trading decisions.

Gold (XAU/USD) Rebound Setup – Support Holding Strong!Analysis:
Gold (XAU/USD) is showing signs of bullish strength after testing the $4,000–$3,970 support zone, where buyers are stepping back in. The recent consolidation above support suggests a potential reversal and continuation of the uptrend.
The setup highlights:
Support Zone: Around $3,970 – $4,000, acting as a key accumulation area.
Bullish Trigger: A breakout above minor resistance could drive momentum higher.
Targets:
🎯 Target 1: $4,101
🎯 Target 2: $4,150
🎯 Target 3: $4,200
Stop Loss: Below $3,970 to protect against a downside breakout.
📈 Outlook: As long as price sustains above support, Gold remains bullish, aiming for a breakout towards $4,150 and $4,200 levels.

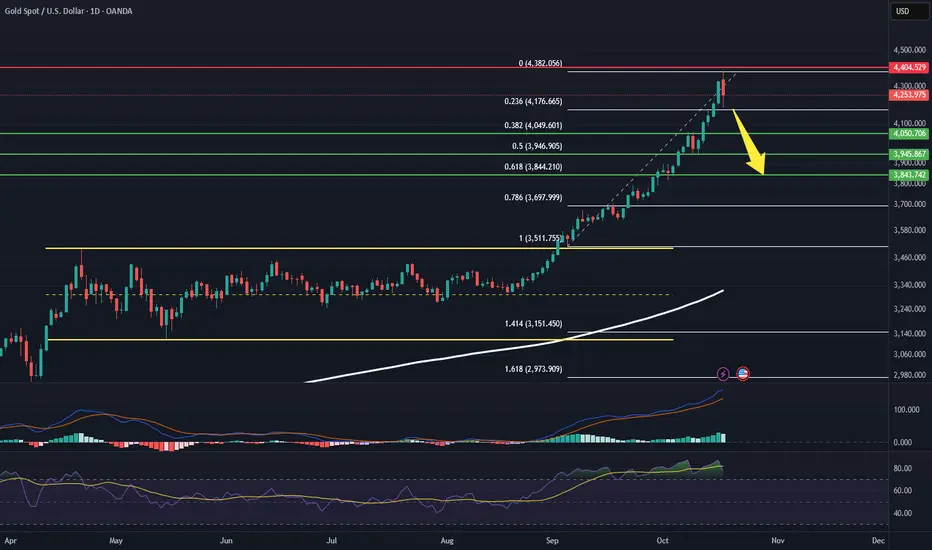
Is Gold (XAUUSD) Set for a Major Pullback? Short Below 4185!Gold has been in a massive range between 3500 and 3120 (a 320-point base). Following the breakout, we witnessed an explosive rally up to 4380 —an 880-point surge, nearly 2.5x the previous range!
But now, caution is warranted. Gold has formed a bearish reversal candle at the peak, and the RSI is deeply overbought . Despite the strong bullish trend, a confirmed short signal will trigger only if Gold breaks below 4185 .
Trade Setup:
Entry: Sell Gold (XAUUSD) below 4185
Sell on Rallies: Add to shorts near 4280
Targets:
1st target: 4050 - 4000
2nd target: 3850
Stop Loss / Invalidation: Close shorts if price moves above 4402
Why this setup matters:
With Gold’s momentum stalling at key resistance and technical indicators signaling overextension, a well-timed short could capture a strong corrective move.
Do you agree with this bearish outlook?
👍 Like if you’re ready to short!
💬 Comment your take or questions below — let’s build a powerful, informed trading community!
Your feedback drives our content and keeps everyone trading smarter. Let’s make those pips together! 🚀
Happy Trading,
– The InvestPro Team
XAUUSD 1H Buy Limit Projection — 15.10.25🟡 Overall Setup
This is a 1-hour timeframe projection chart for XAUUSD (Gold vs USD). The market is currently in a strong uptrend, moving inside an ascending channel (blue trendline).
The price at the time of projection: $4,198.76
🧭 Key Zones & Plan
Entry Zone (Buy Limit):
Marked at $2203–$2206 (FVG zone — Fair Value Gap).
The chart suggests to wait for breakout and retest of the yellow zone before buying.
Support Zone:
Highlighted in yellow box, indicating strong demand area where the breakout is expected to happen.
“CANDLE MOVEMENT AREA” below shows the probable pullback path.
Trade Timing:
Suggested after 11:30 AM (October 15).
Waiting for structure confirmation before entry.
🏁 Target Levels
TP 1: Around $4,228 – $4,243 (0.5–0.618 Fibonacci zone).
TP 2: Around $4,320, which is the top of the ascending structure.
⚠️ Stop Loss Zone
SL is placed below $4,165, under the yellow demand zone.
Protects against false breakout.
📈 Price Movement Projection
The black line arrows project the expected retracement down to entry zone, then bullish breakout and rally upward toward target zones.
Trend continuation is expected until tomorrow with breakout & retest.
✅ Summary of Strategy:
Trend: Bullish
Action: Buy at retest zone (2203–2206)
TP: 4243 (TP1) / 4320 (TP2)
SL: Below 4165
Timing: After 11:30 AM IST

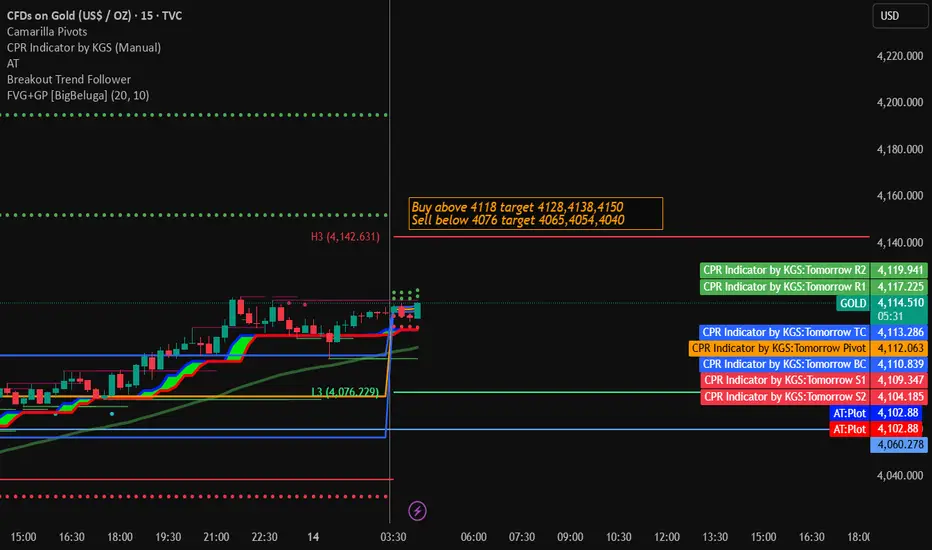
Gold Intra day Trading Strategy for 14th October 2025💰 GOLD INTRADAY STRATEGY – 5 MIN CHART SETUP 💰
(For Educational Purposes Only)
📈 BUY Setup
🔹 Entry: Buy above the high of the 5-minute candle that closes above $4118
🎯 Targets:
1st Target → $4128
2nd Target → $4138
3rd Target → $4150
🛑 Stop-Loss: 3 candles below your entry candle’s low
📉 SELL Setup
🔹 Entry: Sell below the low of the 5-minute candle that closes below $4076
🎯 Targets:
1st Target → $4065
2nd Target → $4054
3rd Target → $4040
🛑 Stop-Loss: 3 candles above your entry candle’s high
⚙️ Trading Tips:
⏱ Trade only after candle close confirmation on the 5-min chart.
💡 Always manage your risk and use a fixed position size.
📊 Wait for volume confirmation and trend direction before entry.
❌ Avoid trading during high-volatility news events.
⚠️ DISCLAIMER:
This setup is for educational and research purposes only.
Trading in Gold or any financial market involves significant risk.
You may lose your capital.
Please do your own analysis or consult a financial advisor before taking any trade.
GOLD 1H Analysis for 20th October 2025 MondayThe 1H trend has shifted to bearish. The current price is above the 1H QML and has retested the 1H SBR zone.
The price is currently positioned in two areas: 1) Supply Zone and 2) Double Top.
The outcome of the market will be determined on Monday.

Part 2 Ride The Big Moves Call Options Explained
A call option gives the holder the right to buy an asset at a predetermined price, known as the strike price, before the contract expires. Traders buy call options when they expect the asset’s price to rise. For example, if a stock trades at ₹100 and you buy a call with a ₹105 strike, you profit if the price surpasses ₹105 plus the premium cost. Call options are commonly used to leverage bullish expectations, offering high potential returns with limited risk exposure compared to directly purchasing the stock.
