gold spot crucial update after made 4142$this is 4th hrs chart showing major rejection from 4145--49$ range now still looking same history at behalf this chart some major update below--
gold spot if sustain abv 4145--49$ than expect up side 4160--70$ or if close above 4160$ than will see 4280--4250$ near terms.
now see in chart almost double bottom 4097--4096$ if mkt sustain blw or mkt again take rejection above lvl than soon 4065--4030$ expect
Trade ideas

Part 4 Learn Institutional Trading Participants in the Options Market
There are four types of participants in the options market:
Buyers of Call Options – Expect the price to go up.
Sellers of Call Options – Expect the price to stay the same or fall.
Buyers of Put Options – Expect the price to fall.
Sellers of Put Options – Expect the price to stay the same or rise.
Buyers take limited risk (the premium) with unlimited profit potential, while sellers take limited profit (the premium received) but unlimited risk.

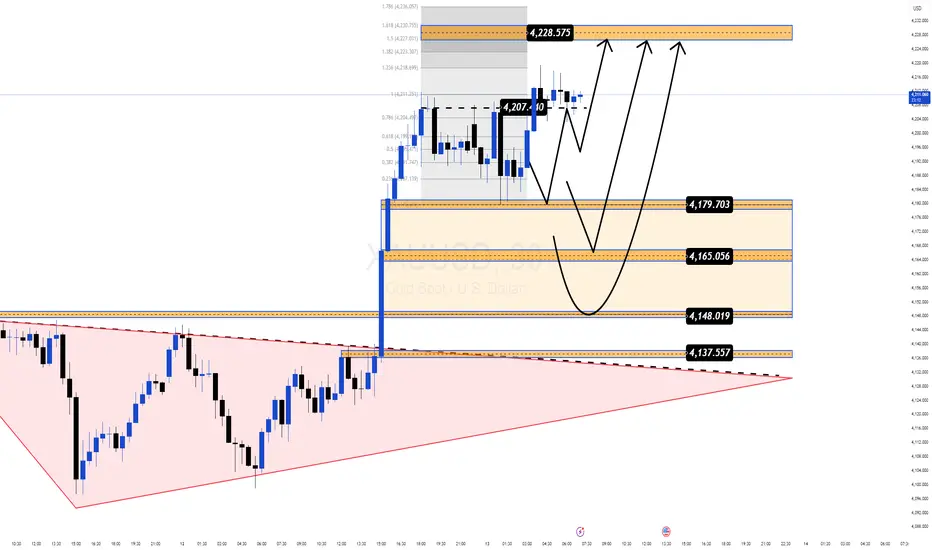
Gold Hits a 3 Week High but the Real Move Might Still Be LoadingGold just tapped $4,213 — the highest level in three weeks, powered by growing expectations of a dovish Fed and optimism around the potential reopening of the US government.
But the real story isn’t the headline spike — it’s the structure forming right beneath it.
📌 Why this zone matters right now
Price is pulling back into $4,179–$4,165, a clean Demand zone aligning with Fibo + breakout structure.
Buyers remain firmly in control despite a mild USD recovery.
The market swept liquidity around $4,207, hinting at accumulation before the next expansion.
The broader pattern resembles a falling-wedge breakout, often appearing before strong upside continuation phases.
🎯 Most Probable Scenario (Mind Insight)
Gold is in a “compression before expansion” phase.
Once this squeeze resolves, momentum is likely to continue in the direction that’s already dominant — and right now, that’s the bulls.
🔶 MMF BUY Zone
$4,179 → $4,165
Looking for a shallow pullback before the next leg.
🔼 Bullish Targets
• $4,207 (liquidity tap)
• $4,228 (Fibo 1.618)
• $4,236 (Fibo 1.786 — major reaction zone)
🧠 Key Takeaway
As long as Gold holds above $4,165, the bullish structure remains intact and the upside expansion toward the upper Fibo cluster stays in play.
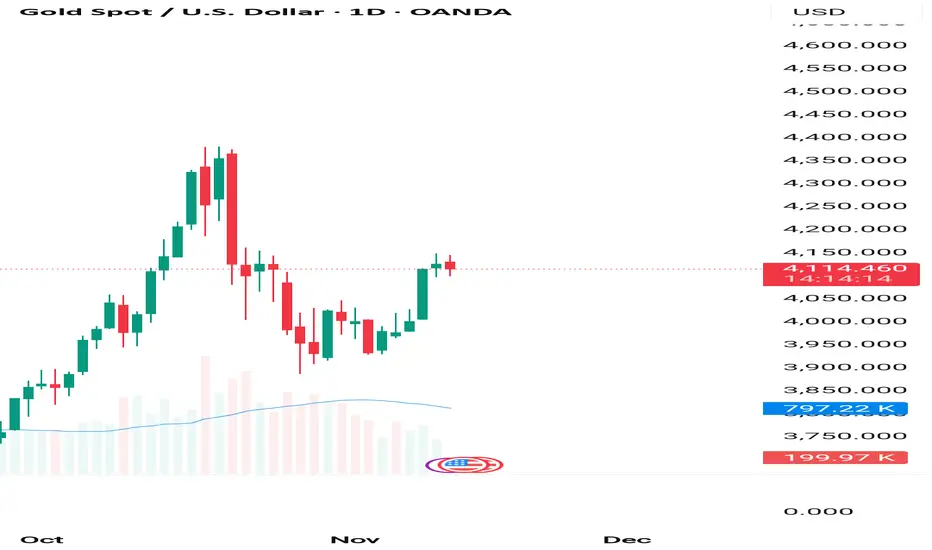
XAU/USD OUTLOOK – TODAY 13/11/25
The US House has approved the reopening of the government, now just awaiting President Trump's signature. This means US economic data will gradually be released again, promising a week of strong and unpredictable fluctuations.
In terms of technicals, gold maintains an upward trend after breaking the H4 sideway boundary, but signs of overbought conditions and H4 peak divergence are emerging.
In smaller time frames (M30 – H1), slight divergence is also beginning to appear, so BUY positions need to be selected carefully, avoiding FOMO. SELL should only be short-term reactive trades.
🎯 Scenario for the day
Morning
Expecting sideway ~30 points within the 4180 – 4212 range
You can WATCH FOR TRADES WITHIN THIS RANGE
if the price breaks through 4212, then wait for a retest back to 4205 to buy up.
Afternoon
Wait for gold to adjust to reasonable BUY zones:
4160 – 4162
4152 – 4148
4123 – 4120
If a strong adjustment occurs:
Beautiful BUY at 4070 – 4040 (deep support zone).
🎯 Target increase:
4280 – 4285
4300 – 4305
🎯 Reactive SELL:
4255, 428X, 430X
(SL 10 – TP 10)
⚠️ Important Note
The overall trend is still uptrend, but attention is needed:
H4 shows signs of overbought + peak divergence.
M30 – H1 shows slight divergence, indicating the market may have a short adjustment before continuing to rise.
BUY should only be entered at beautiful support zones, if a bad candle is seen → close short and exit quickly.
SELL is only reactive selling at strong resistance zones, not holding for long.

XAUUSD – REFERENCE SCENARIO FOR 13/11 – TRACKING ELLIOTT WAVE 5💛 XAUUSD – REFERENCE SCENARIO FOR 13/11 – TRACKING ELLIOTT WAVE 5 🎯
🌤 Overview
Hello everyone 💬
Gold is currently trading around the 4210 region, indicating that the upward momentum has slowed after two strong days of gains.
According to Elliott wave, wave 5 may not have ended yet, and this region is becoming a strong resistance – where prices can accumulate or adjust at any moment.
Besides technical factors, political news from the US President's administration is causing significant USD fluctuations, leading to a wide range of gold movements in the short term. Therefore, today it is crucial to prioritise risk management and monitor price reactions in the 4210–4260 region.
💹 Technical Analysis
📈 On the H4 chart, gold is approaching the resistance area of 4210–4260, which also coincides with the 0.236 Fibonacci and the previous FVG zone.
🟣 The bearish view (ABC correction) will be confirmed when the price breaks below 4180 – targeting an adjustment to 4120–4050.
🔹 The bullish view remains valid if the price closes the H4 candle above 4212, in which case the trend could extend to 4250–4280.
🎯 Reference Trading Plan
💖 BUY Scenario (on breakout)
Entry: 4230–4232 | SL: 4225
TP: 4165 – 4190 – 4250
💢 SELL Scenario (reaction at resistance)
Entry: 4265–4267 | SL: 4273
TP: 4249 – 4215 – 4200
⚠️ Important Note
Closely monitor reactions at the levels: 4246 – 4212 – 4260 – 4280.
USD is highly volatile due to political factors, which may cause rapid fluctuations in gold.
🌷 Gold is at a crucial transition zone – Elliott wave 5 may soon end or expand further 💛
Be patient for clear confirmation, as at this stage, even a small deviation can change the entire price structure.
If you find this useful, please 💛 like – 💬 comment – 🔔 follow LanaM2 to keep updated with daily gold insights with me ✨

GOLD H1 – Awaiting CPI Data for Next Big Move🟡 XAUUSD – Intraday Smart Money Plan | by Ryan_TitanTrader (12/11)
📈 Market Context
Gold remains in a controlled retracement phase after a strong impulsive leg last week. The market is now consolidating within a defined 1H range, showing clear reactions near short-term EMAs as traders await today’s U.S. CPI release, a key driver of intraday volatility.
• A higher-than-expected CPI could reignite USD strength and push gold toward the discount zone.
• A softer CPI print may trigger a renewed push into the premium zone, inviting liquidity grabs above 4200.
Institutional flows remain balanced between short-term profit-taking and position building ahead of the inflation print, suggesting engineered liquidity sweeps before the real move unfolds.
🔎 Technical Analysis (1H / SMC Style)
• Structure: Market structure is still bullish but showing distribution signs at the top of the range.
• Premium Zone: 4201–4199 aligns with unmitigated supply — a prime area for potential sell-side reaction if CPI sparks a bullish liquidity sweep.
• Discount Zone: 4083–4081 overlaps with the 0.618 Fibonacci retracement and sits just above EMA100 — an ideal re-accumulation area for institutional buys.
• Liquidity: Equal lows near 4080 and equal highs near 4200 make both sides vulnerable to engineered stop-hunts before direction is confirmed.
🔴 Sell Setup (Premium Reaction Zone)
• Entry: 4,201 – 4,199
• Stop-Loss: 4,210
• Take-Profit Targets:
→ 4,140 (first liquidity pocket)
→ 4,102 (mid-range equilibrium)
→ 4,083 (discount zone confluence)
📌 Only valid if CPI causes a liquidity sweep into premium, followed by M5–M15 bearish BOS confirmation.
🟢 Buy Setup (Discount Reaction Zone)
• Entry: 4,081 – 4,083
• Stop-Loss: 4,074
• Take-Profit Targets:
→ 4,102
→ 4,140
→ 4,199
📌 Only valid if price sweeps 4080 liquidity and reclaims structure with bullish BOS on M15 timeframe.
⚠️ Risk Management Notes
• Wait for CPI-induced volatility before executing any setup.
• Avoid mid-range trades between 4100–4140 — this is equilibrium noise.
• Reduce size pre-news; volatility spikes can trigger premature stops.
• Scale partials at each liquidity pocket and trail stop-losses accordingly.
✅ Summary
Gold is consolidating ahead of CPI, with dual liquidity zones clearly defined:
• Sell zone: 4201–4199 (premium reaction area)
• Buy zone: 4083–4081 (discount re-entry area)
The market is likely to hunt one side of liquidity before revealing true intent. Traders should remain patient, trade from extremes, and align entries with confirmed structure shifts.
FOLLOW @Ryan_TitanTrader for real-time SMC updates ⚡

Xauusd is top out today 4200 to 4230 is a selling zone tar 3750This is a xau usd cycle top out today
Next tar 3750


Elliott Wave Analysis – XAUUSD | 12 November 2025🔹 Momentum
• D1: The daily momentum has completed its upward phase, indicating that we may expect a bearish wave to bring the D1 momentum back to the oversold zone.
• H4: The H4 momentum is currently preparing to turn upward, suggesting a potential bullish move lasting 4–5 H4 candles before the next larger decline.
• H1: The H1 momentum is also about to turn upward, implying that a short-term rally could begin from the current levels.
🔹 Wave Structure
• D1: On the daily chart, price remains within wave (4) yellow. We expect a downward move aligned with D1 momentum, lasting 4–5 daily candles, to complete this corrective wave.
• H4: On the H4 chart, price is currently inside wave X (purple). As H4 momentum approaches the oversold zone while price continues to move sideways, it suggests that one more upward leg may occur to complete wave X.
• H1: On the H1 chart, price has already formed a 3-wave correction, which I mentioned in yesterday’s update. Currently, wave 4 (red) is forming, and once price breaks above the top of wave 3 (red), wave 5 (red) will be confirmed.
🎯 Wave 5 (red) is expected to target the 4200 zone, which is our primary Sell Zone.
If price breaks above 4145 and RSI forms a lower high compared to RSI at wave 3, this will create a bearish RSI divergence, confirming that wave 5 is forming — a good opportunity to look for Sell setups.
However, if price breaks below the bottom of wave 4 (red), it may indicate a truncated wave 5, which would trigger strong selling pressure and lead to a sharp, steep decline.
📈 Trading Plan
• Sell Zone: 4199 – 4201
• Stop Loss: 4215
• Take Profit 1: 4145
• Take Profit 2: 4046
• Take Profit 3: 3932

Gold Defends $4100 As Senate Works to Resolve Shutdown .Dollar Index consolidates Above 200 Day SMA 99.00
.Global stock Indices show resilience on optimism on US shutdown.
.Markets count on rate cut by Fed in early next year.
.Global economic concerns continue to boost Gold demand.
What's Going on in Gold?
Recent drop in Gold prices reaching $4097 has witnessed mild recovery which faces hurdle at $4145 as global stock indices show resilience in the backdrop of optimism on the US Senate working on a possible resolution to the longest government shutdown in the US history stretching to 42 days. The demand for the greenback shows some limited recovery as the dollar index consolidates above 200 day SMA 99.00
Fundamental Drivers:
US Senate votes to end the longest shutdown.
Dollar Index shows mild recovery above 99.00
Markets expect interest rate cut in early next year though Fed officials maintain neutrality.
Central Banks, especially China and Mid East, continue Gold purchases.
Safe haven demand continues in consistent manner.
Investors position for future inflation hedging.
Technical Drivers:
Price stability above psychological handle of $4100
Bulls defending 5 Day EMA $4090, the first line of defence.
4 Hour RSI reading at 62, still room for extension towards next leg higher before overbought conditions appear.
Immediate hurdle sits at $4145 above which $4155 is next challenge.
Immediate support sits at $4118-$4115 below which $4100 my be exposed.
What's Next High Probability Scenario:
Prevailing price stability above immediate support $4118-$4115 favours further upside on strong break above descending trend line resistance dynamically positioned at $4143-$4145 which next requires clear break above $4153-$4155 to advance towards next target $4193 which aligns with 61.8% Fibonacci retracement of correction from $4381 record high to $3886 low

XAU/USD – Price Accumulating in a Narrow Range, Ready to Expand⏰ Timeframe: 30m
📅 Update: 11/12/2025
🔍 Market Context
Gold maintains a neutral structure after forming a Change of Character (CHoCH) around the 4,144 USD area.
Yesterday's session witnessed a narrow fluctuation between the Demand Zone – Support Zone, indicating the market is absorbing liquidity before determining the next direction.
The medium-term upward momentum remains unbroken, but the price needs a clear balancing phase before continuation.
📊 Technical Structure
Demand Zone (4,144 USD): a short-term supply – demand area where the market previously reacted strongly, now becoming a potential testing zone.
Support Zone (4,099 USD): confluence structure – an area where buying flows may return when the price retests.
Order Block (4,081 USD): a deep defensive zone, corresponding to the main Discount area in the current cycle.
Equal Lows (EQL) & CHoCH: indicate a short-term transition between two sides, but the overall bias slightly leans towards an increase.
🎯 Market Outlook
High probability scenario for the day:
1️⃣ Price may fluctuate within the 4,099–4,144 USD balance zone to attract liquidity.
2️⃣ If a strong reaction occurs from the Support Zone or Order Block, gold may establish a new upward move towards 4,165–4,180 USD.
3️⃣ Conversely, if the price closes below 4,081 USD, the short-term structure will temporarily shift to neutral, prioritizing a re-accumulation phase.
🧠 Analyst’s View
Current price behavior reflects a “pause phase” in the larger upward structure.
When the market balances at lower levels, the key observation is not the bounce, but the reaction when liquidity is swept — where the true momentum of the trend is reignited.
As long as the price does not break the 4,081 USD mark, the medium-term upward trend remains intact.
🛡️ Risk Note
This is a technical analysis, not investment advice.
The market can change rapidly during US sessions – wait for clear confirmation from price action before participating.

XAUUSD H1 – Double Tap Liquidity & Reentry Setup🕊️ Market Context
Gold just delivered a beautiful liquidity sweep from the highs at 4148, after multiple CHoCH–BMS transitions confirmed structural bullish intent.
We are now seeing price forming equal lows, tapping the buy zone (4090–4085) — a clean H1 demand block aligned with the 0.618 retracement.
💎 Technical Analysis (SMC Perspective)
Structure:
Higher-timeframe structure remains bullish, following multiple BMS breaks to the upside.
Current pullback is corrective — a typical liquidity sweep to rebalance inefficiency.
BUY ZONE: 4090 – 4085 (SL 4080)
→ H1 Demand (OB) + 0.618 Fib confluence.
→ Watching for M15 CHoCH confirmation before entering long.
Target: 4148
→ Buy-Side Liquidity (BSL) resting above previous highs — likely magnet for the next push.
🪶 Trading Plan
I’ll wait patiently for a clean sweep + M15 confirmation around 4085–4090 to re-enter long.
As long as price respects 4080, my bias remains bullish, targeting the next BSL @ 4148.
No trade if price fails to confirm on lower timeframe — patience over impulse. 💛
💭 Karina’s Note
This setup perfectly reflects the essence of SMC — liquidity engineering before continuation.
It’s not about catching every move; it’s about aligning with the story the market is telling.
This is my personal view based on SMC principles – not financial advice.
✨ Like & Follow for daily London session updates ✨

Gold H1 – 5-Wave Complete Amid Fed Rate Hopes & Dollar Rebound🟡 XAUUSD – Elliott Wave Intraday Outlook | 12/11 | by Ryan_TitanTrader
📈 Elliott Wave Context
Gold appears to have completed a clear 5-wave impulsive advance on the H1 chart, with wave 5 reaching into the premium zone around 4,149–4,151. Concurrently, macro news is supporting bullion: weaker US labour data and rising expectations of a Federal Reserve rate cut have bolstered safe-haven flows.
Now price is retracing from the highs, suggesting that a classic corrective ABC sequence may be forming.
🔎 Technical Breakdown (Wave Structure)
• Wave 1: Initiation rally from ~3,965
• Wave 2: Shallow pull-back to near ~4,000
• Wave 3: Strong impulse past ~4,080 → extended
• Wave 4: Controlled correction holding trend-line support
• Wave 5: Final push topping near ~4,149–4,151 (SELL ZONE)
With the 5-wave impulse complete, the market is likely shifting into:
Wave A → bear leg
Wave B → corrective rebound
Wave C → deeper decline
📉 Expected Elliott Wave Path (ABC)
Wave A projection:
• Likely break below the 2-4 trend-line
• First reaction zone: ~4,081 (Fibonacci 0.382)
• Main downside target: ~4,059 (BUY ZONE)
Wave B projection:
• Corrective rebound toward either ~4,108 or ~4,149 (upper premium)
Wave C projection:
• Key downside targets:
o ~4,037 (Fibo 0.618)
o ~4,025–4,010 (trend-line support)
Wave C often equals Wave A in length → aligns with ~4,059 zone for potential cycle end.
Intraday Trade Plan (Elliott-based)
Scenario 1 – SELL the corrective wave (A–B–C)
Preferred strategy given completed impulse.
Entry: After H1 candle breaks below 2-4 trend-line, or on Wave B retest into ~4,149–4,151 (SELL ZONE)
Stop Loss: Above wave-5 high: ~4,155
Take Profit zones:
• TP1: ~4,081
• TP2: ~4,059
• TP3: ~4,037
Scenario 2 – BUY only if correction invalidates
If gold refuses to break the 2-4 trend-line and pushes above ~4,155 → wave 5 may extend.
Entry: Above ~4,155
SL: ~4,149
TP: ~4,175–4,200
📌 Summary
For 12/11, gold has completed a textbook 5-wave impulse and is now ripe for a corrective ABC pattern. With macro forces (Fed rate-cut expectations, weaker dollar) providing backdrop, the highest-probability trade is to sell the Wave B retest and ride Wave C toward deeper support near ~4,059. Stay patient, let the structure confirm the impulse → correction transition before committing.

Gold AI tool showing unmove will continue until 4080 not break Price Action: Gold is holding firm above $4,100, showing resilience amid global uncertainty.
- Trend: Long Build‑Up (Price↑ + OI↑), indicating accumulation by funds.
- Supports: $4,100 / $4,080 / $4,050.
- Resistances: $4,130 / $4,150 / $4,180.
- Bias: Bullish continuation if $4,100 holds; corrective pullback risk below $4,080.
XAU/USD – Gold Maintains Bullish Structure, Monitor FVG 4,060📊 Market Structure
After completing the structure break (ChoCH + BoS) at the 4,080 USD zone, gold has sustained a strong upward momentum and created Equal High 4,140 – 4,145 USD , corresponding with the short-term resistance Order Block .
Currently, the price is technically reacting in this area, indicating short-term profit-taking pressure from buyers after a prolonged rally.
The H1 structure remains bullish as the main support zones have not been broken.
A potential scenario is that the price will adjust to FVG zones or support to absorb liquidity before bouncing towards the Liquidity Zone 4,197 USD — the upper liquidity peak.
💎 Key Technical Zones
• OB & Resistance: 4,127 – 4,140 USD
• Support Zone: 4,104 – 4,107 USD
• FVG Zone #1: 4,060 – 4,067 USD
• FVG Zone #2: 4,031 – 4,037 USD
• Liquidity Target: 4,197 USD
🎯 Trading Plan
1️⃣ SELL Setup – Pullback Scalping
If the price reacts sharply downward at the OB zone 4,127 – 4,140 USD:
• Entry: 4,132 – 4,137
• SL: 4,150
• TP1: 4,104
• TP2: 4,067
→ Short-term trade, leveraging the pullback to the support zone to prepare for the next BUY setup.
2️⃣ BUY Setup – Continuation
When the price completes its adjustment to the FVG or Support Zone and a bullish signal appears (rejection / engulfing):
• Entry: 4,067 or 4,037
• SL: 4,020
• TP1: 4,140
• TP2: 4,197
• TP3: 4,210
→ Main setup in the current trend. Prioritize buying at the discount zone after sufficient liquidity is absorbed at the lower zone.
🧠 Vincent’s View
The H1 structure remains buyer-favored. Current adjustments are technical, not reversals.
The FVG zone around 4,060 USD is a key point to observe price behavior — if a clear reaction occurs, this could be the starting point for the next upward wave to 4,197 USD .
“Liquidity fuels the next move — let the market breathe before the impulse.” ⚜️
⏰ Timeframe: 1H
📅 Updated: 11/12/2025
✍️ Analysis by: Captain Vincent

LiamTrading – XAUUSD H2 | USD strengthens again, gold ...LiamTrading – XAUUSD H2 | USD strengthens again, gold consolidates in an upward channel; await correction to 4090/4041 – break 4145 to confirm further rise
Quick context: USD recovery causes gold to move sideways during the Asian session. Price is moving within an upward channel, hitting the upper trendline and reacting around 4100, not forming a lower low yet. To confirm the continuation of the uptrend, a break of 4145 is needed; otherwise, prioritise the technical correction scenario towards liquidity zones.
Technical Analysis (Volume Profile • Trendline • S/R • Fibonacci)
Channel & Trendline: Channel top coincides with 4135–4145 → likely to see profit-taking pressure. Holding the lower edge of the channel ~4085–4090 keeps the upward structure valid.
Liquidity & FVG:
Liquidity 4090: price pull/volume attraction zone before choosing direction.
Fibonacci Retracement + old resistance ~4041–4043: strong confluence for a bounce if deep correction occurs.
Main resistance: 4130–4135 (retest of channel top), 4145 (pivot confirming rise), 4200 (sell scalp area if clear rejection appears).
Main support: 4084–4086 (channel edge/liq), 4041–4043 (Fib + S/R), deeper 4020 is a defensive point for buyers.
Trading Scenarios (optimised for mobile reading)
Scenario 1 – Buy shallow pullback (trend-following priority)
Entry: 4084–4086
SL: 4078
TP: 4098 → 4112 → 4135 → 4160
Suggestion: Wait for rejection candle at 4090 or M15 reversal signal before entry.
Scenario 2 – Buy deep (Fib + S/R)
Entry: 4041–4043
SL: 4036
TP: 4056 → 4072 → 4095 → 4120
Suggestion: Prioritise when price fills the gap and leaves a clear lower wick.
Scenario 3 – Sell scalp at resistance (counter-trend)
Entry: 4130–4132
SL: 4138
TP: 4112 → 4100 → 4088 → 4060
Note: Quick scalp only; abandon if H1/H2 closes strongly above 4145.
Bonus – Sell scalp 4200
Condition: Clear rejection on smaller timeframe.
SL: above the nearest recent high.
Reference TP: 4185 → 4166 → 4145.
Risk Management & Invalidation
Short-term bullish bias remains valid if price holds above 4085–4090.
H2 closes above 4145 → prioritise buying on breakout, limit all sell orders.
H2 closes below 4036 → risk of deeper test around 4020.
Risk per trade 0.5–1%, move SL to breakeven at +1R, do not average against the trend.
Which price zone do you find noteworthy today? Comment below & hit Follow on LiamTrading channel for the earliest updates.

XAU/USD – REJECTION AT 3997 SUPPLY ZONE | SHORT-TERM PULLBACK SE📅 Date: Nov 06, 2025
📊 Main timeframe: H2 confirmation + M30 execution
🎯 Strategy: SMC + Liquidity Grab + OB Rejection
🟡 MARKET CONTEXT:
Gold (XAU/USD) is retesting the 3995–3997 supply zone where a previous liquidity sweep and Break of Structure (BOS) took place.
The higher timeframe bias remains bullish, but intraday price action suggests a short-term pullback before continuation.
🔸 TECHNICAL OUTLOOK:
Strong rejection from OB/Supply Zone (3995–3997)
BOS and CHoCH confirm short-term weakness.
Key buy zones aligning with demand + FVG areas:
• 3968–3966 → first liquidity pocket
• 3957–3955 → main intraday demand
• 3936–3934 → deep liquidity / FVG zone
🎯 TRADING PLAN:
SELL Setup
• Entry: 3995 – 3997
• Stop Loss: 4001 (≤ 6$ risk)
• Take Profit: 3970 / 3968
• Reason: OB rejection + liquidity sweep confirmation
BUY Setup
• Entry: 3968 – 3966 (conservative) / 3957 – 3955 (aggressive)
• Stop Loss: 3949 (≤ 6$ risk)
• Take Profit: 3988 / 3995
• Reason: Demand zone reaction + FVG fill + bullish BOS
📊 BIAS:
Short-term bearish retracement within a bullish higher timeframe trend.
Expecting liquidity sweep below 3970 before potential continuation toward 3995–4000.

Gold Holding Above 4100$ Market Prepares for Next Wave ExpansionGold continues to sustain momentum above 4,100$, maintaining its bullish market structure as traders price in expectations of a Fed rate cut in December.
While the US Dollar shows brief recovery, the underlying flow still supports safe-haven demand — especially as global risk sentiment remains fragile and the US government moves closer to reopening.
📊 Technical Overview (H1 – MMFLOW Structure)
Price is currently consolidating within the 4,108$–4,113$ liquidity pocket, where prior breakout demand aligns with short-term Fibonacci retracement (0.382–0.5).
This zone continues to attract buy-side liquidity, suggesting accumulation rather than exhaustion.
As long as 4,085$ remains protected, the bias stays bullish toward 4,172$ – 4,203$ (Fibo 1.272–1.618). However, failure to break above 4,172$ may trigger a short-term reaction sell before the next impulsive leg resumes.
🎯 Trading Plan – MMFLOW Setup
🌸 BUY Scenario (Liquidity Retest)
Buy Zone: 4,086 – 4,084
Stop Loss: 4,080
Targets: 4,090 → 4,095 → 4,100 → 4,110 → 4,120 → 4,130 → 4,150+
🔥 SELL Scenario (Short-Term Reaction Zone)
Sell Zone: 4,172 – 4,174
Stop Loss: 4,180
Targets: 4,165 → 4,160 → 4,150 → 4,140 → 4,130 → 4,120
🧠 MMFLOW TRADING Insight:
“Price is language — liquidity is intent. The market is not random; it’s engineered to test conviction before expansion.”
Bias remains bullish above 4,085$ – any dip into the liquidity base could offer the last accumulation before the next breakout.

XAUUSD – PRIORITISE BUYING WHEN PRICE ADJUSTS💛 XAUUSD – PRIORITISE BUYING WHEN PRICE ADJUSTS 🎯
🌤Overview
Good morning traders 💬
Gold is experiencing a slight adjustment after encountering resistance at the VAH zone on the Volume Profile. This is a natural reaction in the current uptrend.
The price observation zone for today's adjustment is around the H4 trendline at 4078, deeper is the VAH zone 4020, where there is good liquidity for buyers.
Although there might be a short-term adjustment, the main trend remains upward. Therefore, I prioritise waiting to Buy at the support zone, rather than entering a trade against the trend.
💹 Technical Analysis (ICT Perspective)
📈 The price is maintaining a medium-term upward structure, with no reversal signals yet.
🟣 The 4075–4078 zone coincides with the trendline + liquidity zone – a potential buying area for short trades.
🔹 VAH around 4020 is strong support, suitable for long-term Buy if the price adjusts deeply.
💫 The 4200–4203 zone remains a major resistance (Sell Zone) – expect a downward reaction when the price approaches.
🎯 Reference Trading Plan
💖 Buy scalping (short-term)
Entry: 4075–4078 | SL: 4070
TP: 4095 – 4105
💖 Buy zone (main priority)
Entry: 4018–4021 | SL: 4011
TP: 4035 – 4042 – 4075 – 4095
💢 Sell zone (short reaction)
Entry: 4200–4203 | SL: 4210
TP: 4186 – 4165 – 4140
💢 Sell scalping (short-term)
Entry: 4122–4124 | SL: 4130
TP: 4105 – 4086 – 4060 – 4040
⚠️ Important Note
The 4048 zone is strong resistance – closely observe price reactions here.
Prioritise Buy according to the main trend, Sell should only be considered as a short-term reaction.
🌷Be patient and wait for the price to adjust to the support zone to buy according to Smart Money flow.
If you find this useful, please 💛 like – 💬 comment – 🔔 follow LanaM2 for daily gold insights ✨


XAU/USD – Gold Technical Adjustment Before Continuing Uptrend⏰ Timeframe: 30m
📅 Updated: 11/11/2025
🔍 Market Context
After a strong rally from the start of the Asian session, gold paused around 4,130–4,140 USD, indicating a temporary cooling off after a series of consecutive Break of Structure (BOS).
The current price is situated between a short-term resistance zone and a technical support (Order Block) – clearly reflecting a rebalancing behavior after a rapid expansion.
📊 Technical Structure
Resistance Zone (4,145 USD): a short-term reaction area, coinciding with a Weak High. If the price surpasses this, the uptrend structure will continue towards the Liquidity Zone around 4,198 USD.
Order Block (4,111 USD): a confluence area between 0.382–0.5 Fibonacci, likely to attract buying interest when the price adjusts.
OB Deep (4,081 USD): a deep support area, coinciding with the 0.618 Fibonacci level — where buyers might defend the main trend.
Liquidity Zone (4,198 USD): a potential expansion target if the uptrend structure is reconfirmed.
🎯 Market Outlook
High probability scenario:
1️⃣ Price technically adjusts to OB 4,111 or OB Deep 4,081, creating a reaction at the Discount area.
2️⃣ As buying momentum returns, the price may retest the Resistance Zone 4,145, then expand towards the Liquidity Zone 4,198 USD.
3️⃣ Breaking below 4,081 USD will weaken the short-term structure, shifting to a deeper rebalancing state.
🧠 Analyst’s View
This is a natural “cooldown” phase after a strong rally — the market is seeking liquidity before establishing the next upward move.
As long as the price holds above the 4,081 USD area, the main trend remains bullish.
Observing reactions at the OB will help determine if the upward momentum will continue to dominate in the US session.
🛡️ Risk Note
The market is adjusting within a larger trend — avoid emotional actions when the price has not completed the retracement phase.

XAU Short 11/11/25 Newyork session I am seeing SMT between Gold and Silver on London Highs and Asian Highs both, combined with a Change in State of Delivery. This is totally a time based setup not using PD Arrays.
Do your own research

SONA (XAU/USD): BREAKOUT DONE! FED CUT KA FAYDA. KAB KHARIDEIN?📰 Fundamental Analysis: Bada Game Changer (MUST READ)
Bhaiyon aur Behnon, fundamental factors are very strong for Gold (Sona)!
Rate Cut Ki Umeed (Expectation): Market is expecting more than 60% probability for another Fed Rate Cut in December.
Kam rates means Dollar (DXY) will be weak, aur Gold (non-yielding asset) becomes dhamakedaar (explosive/exciting)!
Economy Thodi Slow Hai: US Consumer Sentiment slid to 50.3 (lowest since June 2022). Yeh data supports a 'Dovish' Fed, jisse Sona ko aur support milta hai (which gives more support to Gold).
💡 Is Hafta Ka Main Focus: Watch out for FOMC member speeches on Wednesday. Poora market unki taraf dekh raha hai (The entire market is looking towards them) for the next direction!
📊 Technical Analysis: Setup Ekdum Solid Hai!
Gold ne ek powerful Breakout diya hai from the consolidation range (4,044 - 4,060). Matlab, trend ab pakka Bullish ho gaya hai! (Meaning, the trend is now definitely Bullish!)
Entry Ka Wait Karo (Patience is key): DON'T JUMP IN NOW! Wait patiently for a pullback to the Demand Zone/CP (4,081 - 4,114). This is the best place to initiate a Long position.
Targets (TP): If the CP zone holds, the targets are 4,155, 4,185, and the big level at 4,236.
Stop-Loss (SL): Keep it safe below 4,044.
🎯 Strategy Summary: Fatafat Dekho!
Strategy: Wait and Buy (Long) in the 4,081 - 4,114 area.
Risk: Dhyaan rakhna (Be careful) if price closes below 4,044.
#XAUUSD #Gold #Sona #FedRateCut #Breakout #TechnicalAnalysis #FOMC #IndianTraders
