technical analysis for your chart on Gold (XAU/USDCurrent Price: $4,002
Trend Structure: The pair is showing a potential reversal setup after a completed downward channel.
Recent Pattern: Price has broken slightly above the descending channel and is now retesting the breakout zone around the support level ($3,950–$3,980).
🔹 Key Technical Levels
Support Zone: $3,940 – $3,980
→ Strong accumulation area shown by multiple rejections and previous demand.
Immediate Resistance: $4,080 – $4,120
→ Minor resistance expected as the first hurdle after breakout.
Major Resistance (Target): $4,385
→ Marked as the final bullish target on the chart.
📈 Bullish Scenario
If price sustains above $4,000, we can expect:
A short-term retest of $4,080–$4,120.
Once momentum confirms above $4,120, bullish continuation toward $4,200 → $4,385 (main target).
✅ Buy Confirmation:
Break and close above $4,050 with volume.
Retest of $4,000 zone followed by bullish rejection candle.
🎯 Bullish Targets:
TP1: $4,080
TP2: $4,200
TP3: $4,385
📉 Bearish Scenario
If price rejects $4,000 and closes below the support zone ($3,950):
Downside may resume toward $3,880 – $3,820 range.
That would invalidate the bullish breakout and confirm channel continuation.
🚫 Sell Trigger:
3H close below $3,940.
🎯 Bearish Targets:
TP1: $3,880
TP2: $3,820
📊 Conclusion
Structure is shifting from bearish to bullish after a channel breakout.
The $3,950–$4,000 area is key — a stronghold for bulls.
Expect a bullish rally if support holds, targeting $4,385 in the medium term. NSE:NIFTY1! NSEIX:NIFTY1! MCX:GOLD1! MCX:CRUDEOIL1! MCX:NATURALGAS1! MCX:SILVER1! NSE:BANKNIFTY1! CME_MINI:NQ1! MCX:GOLDM1! COMEX:GC1! MCX:SILVERM1! MCX:GOLDPETAL1!
Trade ideas

XAUUSD/GOLD 4H WEEKLY BUY PROJECTION 02.11.25XAUUSD (Gold) 4H Weekly Buy Projection for 02.11.25.
Here’s a breakdown of what your chart indicates:
🧭 Technical Overview:
Pattern Forming: Symmetrical Triangle inside a larger Parallel Downtrend Channel.
Key Confirmation: “W” pattern confirmation with 0.618 Fibonacci retracement zone, indicating strong potential reversal.
Current Price Zone: Around 4002, consolidating near triangle resistance.
🔍 Key Levels:
Support S1: ~3960
Support S2: ~3920
Resistance R1: ~4040
Resistance R2: ~4080
Resistance R3: ~4160
📈 Projection Summary:
If Price Breaks Triangle Upward:
→ Strong bullish momentum expected toward R1–R3 zones.
→ “Huge buy expected” once breakout candle closes above the upper trendline with volume.
Invalidation:
→ If price breaks below 3960, the bullish setup weakens.
→ Below 3920, trend may retest the lower parallel channel zone.
💡 Trading Plan (Based on Chart Logic):
Buy Entry: Above 4040 confirmation breakout
Target 1: 4080
Target 2: 4160

Global Cues & GIFT Nifty TradingIntroduction
In today’s interconnected financial ecosystem, no market operates in isolation. Global economic events, central bank policies, geopolitical tensions, and market trends from the U.S., Europe, and Asia all influence trading sentiment in India. This interconnectedness is what we call “global cues.” Traders closely watch these cues to anticipate how the GIFT Nifty (formerly SGX Nifty) and the Indian stock markets might open or behave during the trading day.
GIFT Nifty serves as a key pre-market indicator for the Indian equity market, offering traders a glimpse into potential market direction even before the domestic markets open. Let’s explore how global cues interact with GIFT Nifty trading and shape the overall sentiment in India’s financial markets.
What Are Global Cues?
Global cues refer to signals or influences originating from international markets that impact domestic trading behavior. These cues include movements in:
Major Global Indices like the Dow Jones, S&P 500, NASDAQ, FTSE 100, Nikkei 225, Hang Seng, and DAX.
Commodity Prices, such as crude oil, gold, and base metals.
Currency Movements, particularly USD/INR, EUR/USD, and other major pairs.
Bond Yields and global interest rates.
Macroeconomic Data, including inflation, GDP growth, and employment figures from key economies.
Geopolitical Events, such as wars, sanctions, trade agreements, or political instability.
These global indicators collectively affect investor confidence, risk appetite, and capital flows — which ultimately influence Indian markets and the GIFT Nifty.
Understanding GIFT Nifty
GIFT Nifty, officially known as GIFT Nifty 50 Futures, is traded on the NSE International Exchange (NSE IX), located in the GIFT City (Gujarat International Finance Tec-City) in India. It replaced the SGX Nifty (Singapore Exchange Nifty), which was previously traded in Singapore until 2023.
The transition to GIFT Nifty marked India’s effort to bring offshore Nifty trading back within its borders, giving Indian regulators more control and transparency over derivatives linked to Indian markets.
Key features of GIFT Nifty:
Traded almost 21 hours a day, bridging Asian, European, and U.S. time zones.
Denominated in U.S. dollars, attracting foreign institutional participation.
Tracks the performance of the Nifty 50 index, India’s leading stock market benchmark.
Serves as a pre-market indicator for the direction of the Indian equity market.
Because GIFT Nifty trades while Indian markets are closed, its price movement gives traders an idea of how the Indian stock market may open the next morning.
The Role of Global Cues in GIFT Nifty Movements
GIFT Nifty is highly sensitive to global cues due to its extended trading hours overlapping with international markets. Here’s how global factors typically influence its performance:
1. U.S. Market Performance
The U.S. markets, especially indices like Dow Jones, S&P 500, and NASDAQ, play a dominant role in setting global risk sentiment. A strong rally on Wall Street often leads to bullish sentiment in Asian markets and GIFT Nifty, whereas a sharp decline usually results in bearish trends.
For instance, if the NASDAQ closes higher due to strong tech earnings, GIFT Nifty futures may rise overnight, hinting at a positive start for Indian markets.
2. Asian Market Trends
Since GIFT Nifty overlaps with Asian trading hours, performance in indices like Nikkei 225 (Japan), Hang Seng (Hong Kong), and Shanghai Composite (China) can significantly impact it. Weak Chinese data or yen fluctuations can trigger risk aversion across Asian equities, pulling down GIFT Nifty as well.
3. Crude Oil Prices
India is a major importer of crude oil. Rising oil prices increase India’s import bill, widen the current account deficit, and can fuel inflation—all negatives for the Indian economy. As a result, higher oil prices often pressure GIFT Nifty and the Indian rupee. Conversely, a sharp fall in oil prices tends to boost GIFT Nifty sentiment.
4. Currency Movements (USD/INR)
A weakening Indian rupee against the U.S. dollar usually signals foreign outflows and inflationary pressure, which dampen investor sentiment. GIFT Nifty tends to fall in such scenarios. On the other hand, a strengthening rupee supports positive sentiment and may lift GIFT Nifty.
5. U.S. Federal Reserve and Global Interest Rates
The Federal Reserve’s monetary policy decisions are closely tracked worldwide. Any hint of rate hikes or hawkish tone increases global risk aversion, leading to sell-offs in equities and a drop in GIFT Nifty. Conversely, dovish policies (rate cuts or liquidity support) boost risk-taking and lift markets globally.
6. Geopolitical Developments
Geopolitical events such as wars, trade conflicts, or sanctions can cause market volatility. For example, the Russia-Ukraine war initially led to a spike in oil prices and a global risk-off sentiment, dragging GIFT Nifty lower. Similarly, easing geopolitical tensions can trigger recovery rallies.
How Traders Use Global Cues in GIFT Nifty Trading
GIFT Nifty traders often analyze global cues to predict short-term price action and hedge positions in Indian equities. Some common strategies include:
Pre-Market Direction Prediction:
Traders track U.S. and European market closings to gauge where GIFT Nifty may open. This helps in planning trades for the Indian session.
Arbitrage Opportunities:
Since GIFT Nifty trades almost round-the-clock, traders exploit price differences between GIFT Nifty and NSE Nifty futures when domestic markets open.
Hedging FII Exposure:
Foreign institutional investors (FIIs) use GIFT Nifty to hedge their positions in Indian equities based on global risk factors.
Event-Based Trading:
Key global events like U.S. CPI data, Federal Reserve meetings, or OPEC announcements can trigger quick GIFT Nifty reactions. Traders position themselves accordingly before these announcements.
Example: How Global Cues Drive GIFT Nifty
Imagine this scenario:
The Dow Jones surges by 2% overnight on strong U.S. GDP data.
Brent crude drops below $80/barrel, easing inflation fears.
Asian markets open positive.
Result: GIFT Nifty futures jump 100–150 points, signaling a bullish opening for Indian markets the next morning.
In contrast, if:
U.S. bond yields rise sharply,
Crude oil climbs to $95/barrel, and
China reports weak factory data,
GIFT Nifty might fall 150–200 points, reflecting bearish sentiment before the Indian market opens.
Impact of Global Cues on Domestic Market Opening
Because GIFT Nifty trades overnight, it directly influences pre-market sentiment in India. News anchors and analysts frequently refer to “GIFT Nifty indicates a positive/negative start for the Indian markets.”
For example:
If GIFT Nifty is trading 100 points higher, it indicates a likely gap-up opening for Nifty 50.
If it’s 150 points lower, a gap-down opening can be expected.
This helps traders, especially intraday and short-term players, plan their strategies before the NSE opens.
The Future of GIFT Nifty and Global Integration
GIFT Nifty has strengthened India’s position in the global financial ecosystem. With extended trading hours and growing foreign participation, it acts as a bridge between Indian and international investors. As more global funds use GIFT Nifty for exposure to Indian markets, liquidity and volume are expected to rise.
Additionally, the establishment of GIFT City as a global financial hub aligns with India’s vision of becoming a major player in international finance. Over time, more derivative products linked to Indian indices and sectors may be introduced in GIFT City, further deepening market integration.
Conclusion
Global cues and GIFT Nifty trading are tightly interlinked, forming a vital part of India’s financial market ecosystem. Global economic data, geopolitical developments, commodity prices, and central bank policies directly impact GIFT Nifty’s movement — which, in turn, serves as a real-time barometer for the next day’s market sentiment in India.
For traders, understanding these relationships is essential. Those who effectively analyze global cues can make informed trading decisions, manage risk better, and anticipate market direction with greater accuracy. In essence, GIFT Nifty is not just a derivative product — it is India’s window to the world of global finance.

Fundamental Analysis and Technical Analysis for Traders1. Introduction to Market Analysis
Market analysis helps traders evaluate the future price movements of assets like stocks, commodities, or currencies. The goal is to determine whether to buy, sell, or hold a security.
Fundamental Analysis focuses on intrinsic value — the “true worth” of a company or asset based on its financial and economic data.
Technical Analysis focuses on market behavior — analyzing charts, price movements, and patterns to predict future trends.
Both methods are valuable, and many professional traders use a blend of the two to confirm their strategies.
2. Understanding Fundamental Analysis
Fundamental Analysis is based on the belief that every asset has an intrinsic value determined by underlying financial and economic factors. If the market price is below this value, the asset is considered undervalued (a buy signal). If it’s above, it’s overvalued (a sell signal).
a. Purpose of Fundamental Analysis
The main goal is to determine whether a security is trading at a fair price. It answers the question: “Is this asset worth investing in for the long term?”
b. Key Components of Fundamental Analysis
Economic Analysis
Traders study macroeconomic indicators such as GDP growth, inflation, interest rates, employment levels, and fiscal policies. For example, lower interest rates often encourage borrowing and investment, boosting corporate earnings and stock prices.
Industry Analysis
Each company operates within an industry that affects its performance. Analysts evaluate industry trends, competition, growth potential, and regulatory environment. For example, the renewable energy sector may have strong prospects due to global sustainability trends.
Company Analysis
This involves studying a company’s financial health, management efficiency, and competitive position. Key financial statements used include:
Income Statement – reveals profitability.
Balance Sheet – shows assets, liabilities, and equity.
Cash Flow Statement – measures cash generation and spending.
c. Key Ratios Used in Fundamental Analysis
Price-to-Earnings (P/E) Ratio: Compares a company’s current price to its earnings per share.
Earnings Per Share (EPS): Measures profit allocated to each share.
Price-to-Book (P/B) Ratio: Compares market value to book value.
Debt-to-Equity Ratio: Indicates financial leverage and risk.
Return on Equity (ROE): Measures profitability relative to shareholder equity.
By combining these indicators, traders estimate whether the stock’s current price reflects its actual performance and growth potential.
3. Understanding Technical Analysis
Technical Analysis focuses on studying price action and market psychology through charts and indicators. The key belief is that “price discounts everything” — meaning all fundamental factors are already reflected in the market price.
a. Purpose of Technical Analysis
TA helps traders identify trends, entry and exit points, and potential reversals. It answers the question: “When should I buy or sell?”
b. Core Principles of Technical Analysis
Price Discounts Everything:
All news, earnings, and expectations are already factored into the price.
Prices Move in Trends:
Markets tend to move in identifiable trends — upward (bullish), downward (bearish), or sideways (consolidation).
History Repeats Itself:
Market behavior is influenced by human psychology, and price patterns often repeat over time.
c. Tools and Techniques in Technical Analysis
Charts and Patterns
Line Charts: Simplest form, showing closing prices.
Bar Charts: Show open, high, low, and close (OHLC).
Candlestick Charts: Visual representation of price action using candles.
Common patterns include:
Head and Shoulders: Indicates a reversal trend.
Triangles: Signal continuation or breakout.
Double Top/Bottom: Suggest trend reversal.
Indicators and Oscillators
Moving Averages (MA): Smooth out price data to identify trends.
Relative Strength Index (RSI): Measures overbought or oversold conditions.
MACD (Moving Average Convergence Divergence): Detects momentum and trend reversals.
Bollinger Bands: Measure market volatility.
Volume Profile: Shows traded volumes at different price levels, identifying strong support and resistance zones.
Support and Resistance Levels
Support is where the price tends to stop falling; resistance is where it tends to stop rising. These levels guide traders in planning entries and exits.
4. Comparison Between Fundamental and Technical Analysis
Aspect Fundamental Analysis Technical Analysis
Objective Determines intrinsic value Identifies price trends
Approach Based on financial & economic data Based on charts & indicators
Time Horizon Long-term Short-term to medium-term
Data Used Earnings, assets, economic growth Price, volume, patterns
Focus “Why” the price moves “When” the price moves
Best for Investors Traders
Drawback Slow to react to market moves Can ignore fundamentals
Both methods complement each other. For example, a trader might use fundamental analysis to choose a strong stock and technical analysis to time the entry and exit.
5. How Traders Combine Both Approaches
Many professional traders use a hybrid approach, combining the best of both worlds:
Step 1: Use Fundamental Analysis to select fundamentally strong stocks or currencies with good long-term prospects.
Step 2: Apply Technical Analysis to find the right time to enter or exit trades.
For example, if a company reports rising profits and strong guidance (fundamental strength), but the stock price is currently in a consolidation phase, a trader may wait for a breakout above resistance (technical signal) before buying.
6. Advantages and Limitations
a. Fundamental Analysis
Advantages:
Ideal for long-term investors.
Helps identify undervalued or overvalued assets.
Focuses on financial strength and future potential.
Limitations:
Not effective for short-term trading.
Market prices can remain irrational despite strong fundamentals.
Time-consuming data collection.
b. Technical Analysis
Advantages:
Useful for short-term trading decisions.
Provides clear entry and exit signals.
Reflects real-time market sentiment.
Limitations:
Can give false signals in volatile markets.
Ignores fundamental value.
Requires discipline and experience to interpret correctly.
7. Practical Example
Imagine two traders analyzing Infosys Ltd.
Trader A (Fundamental Analyst): Examines the company’s quarterly earnings, strong IT sector growth, and healthy balance sheet. He believes the stock is undervalued and buys it for the long term.
Trader B (Technical Analyst): Studies price charts, notes a bullish crossover in the MACD, and buys for a short-term rally.
Both traders are profitable but have different objectives and strategies. This shows how FA and TA can coexist effectively.
8. Conclusion
Fundamental and Technical Analysis are two powerful yet distinct methods for understanding market movements.
Fundamental Analysis helps you understand what to buy by identifying assets with strong financial potential.
Technical Analysis helps you decide when to buy or sell by tracking market behavior and sentiment.
In essence, fundamentals tell the story, and technicals tell the timing. Successful traders often combine both — using fundamentals to choose quality assets and technicals to manage entry, exit, and risk. In today’s fast-moving markets, mastering both approaches gives traders a strategic edge and helps them make well-informed, confident trading decisions.
Emotional Discipline and Risk Control in Trading🧠 1. Why Emotional Discipline Matters
Emotional discipline means sticking to your plan regardless of fear or greed.
Markets are designed to test your patience, confidence, and decision-making. Every losing trade tempts you to change your system — but consistency wins.
✅ Key habits of emotionally disciplined traders:
They accept losses without revenge trading.
They follow rules, not impulses.
They manage expectations — no trade will make them rich overnight.
💰 2. Risk Control — Protect Before You Profit
Your risk management defines your survival. Successful traders think in probabilities, not certainties. They never risk too much on one idea.
📏 Golden Rules of Risk Control:
Risk 1–2% of your capital per trade.
Always use a stop-loss, never a “mental” one.
Define your R:R ratio (minimum 1:2 or better).
Never add to a losing position — only to confirmed winners.
Risk control is not about avoiding losses — it’s about limiting damage and staying consistent over time.
🧩 3. How to Strengthen Emotional Discipline
Like a muscle, discipline grows with routine. Try this daily:
Pre-trade routine – review your plan before every session.
Post-trade journal – log your emotions, not just results.
Take breaks – emotional fatigue leads to poor judgment.
Detach from outcomes – focus on process, not profit.
💡 Tip: When you reduce emotional pressure, your clarity and accuracy both improve.
⚙️ 4. Professional Mindset Shift
Amateurs chase profit; professionals protect capital.
Each trade is just one data point — not a reflection of your worth. Once you start thinking like a risk manager first, your results change naturally.
🗣️ “Discipline is choosing what you want most over what you want now.”
📊 Conclusion
To grow as a trader, focus on controlling yourself before controlling the market.
Emotional stability + strict risk control = long-term success.
Be the trader who executes with logic, not emotion. 🧘♂️
XAUUSD MULTI TIME FRAME ANALYSISHello traders , here is the full multi time frame analysis for this pair, let me know in the comment section below if you have any questions , the entry will be taken only if all rules of the strategies will be satisfied. wait for more price action to develop before taking any position. I suggest you keep this pair on your watchlist and see if the rules of your strategy are satisfied.
🧠💡 Share your unique analysis, thoughts, and ideas in the comments section below. I'm excited to hear your perspective on this pair .
💭🔍 Don't hesitate to comment if you have any questions or queries regarding this analysis.

LUCY’S VIEW ON GOLD FOR THE WEEKLUCY’S VIEW ON GOLD FOR THE WEEK 💎
Hey everyone 💕
A fresh week begins, and Gold (XAUUSD) is already showing some interesting setups. It looks like wave 5 is starting to form — which could lead to a stronger directional move soon.
Let’s take a closer look at the technical picture together 🌿
🔍 Technical Outlook
On the 4H chart, Gold is hovering around the 4000 zone after completing its wave (4) correction.
The current structure suggests that wave 5 down may be unfolding.
However, we’ll need a clear break below 3900 to confirm further downside pressure 📉
From the ICT perspective, the Fair Value Gaps (FVG) above are acting as liquidity traps — areas where sellers might step back in if price sweeps higher.
According to Fibonacci levels, the 0.382 zone near 4000 remains a key balance point, while the 1.618 extension around 3550 could become a longer-term target if the bearish wave extends 🔻
⚙️ Key Price Zones to Watch
The area near 4060 is a strong resistance, aligning with an FVG zone — if Gold breaks above, the short-term bias could shift toward 4100–4150, and even 4250 🌸
On the downside, 3995 is the first support, followed by 3920, and deeper near 3850–3900.
A decisive break below these levels could open the way for a stronger wave 5 move toward the 3550 zone.
🎯 Trade Setup
💼 Sell Entry: 4050
⛔ Stop Loss: 4060
🎯 Targets: 4023 – 4000 – 3988 – 3965
I’ll stay focused on selling around the upper FVG zone, but will adjust quickly if price shows a clean breakout above 4060.
⚠️ Note & Closing
This analysis reflects Lucy’s personal view based on Trendline, Fibonacci, and ICT concepts 📊
It’s not financial advice.
Share your thoughts on Gold’s next move in the comments 💬
And don’t forget to follow Lucy for daily insights — where technical precision meets trading emotion 💫🌙

Gold Next Move below or above Gold Next Move below or Above $4000-$4010 only
Gold dropped well with Fed resume the rates

Gold for next week -> 3 Nov 2025I'm expecting a drop into the demand zone and from there expecting a rally into the next supply zone which I marked above.

XAUUSD Down TrendMultiple confirmation shows and confirms that XAUUSD Down Trend entry made on next candle opening good to go
Deslamer: not a financial advice do your own research and enter in a trade its for just educational purpose only to know more message

XAUUSDTrading is easy, but trading with convection is only possible after you have 5-6 years of experience trading in every market.
It is this experience that can tell you how high the market can go, if you are tracking the stock correctly, and only then can you estimate how much profit booking can happen.
This is possible only with experience.

XAUUSDPrice Action Trading is a method of financial market analysis where traders make buying and selling decisions solely based on the asset's price movements over time, without relying on technical indicators.
It's essentially the art of reading a "naked" or clean chart to understand the psychology and behavior of market participants.

GOLD TRAPPED BETWEEN LIQUIDITY ZONES – WAITING FOR SMART MONEY M🧭 DAILY TRADING PLAN – GOLD (XAU/USD)
Date: Oct 31, 2025
Main timeframe: M30 – H1
Strategy: SMC + Liquidity Grab + BOS/CHOCH Confirmation
🎯 Hook:
Gold is currently ranging between two key liquidity zones after a bullish BOS. Will price hunt the weak high or sweep the buy-side liquidity before the next leg?
🌐 MARKET CONTEXT
After a strong recovery from 3960 → 4040, price created a weak high with no significant displacement. The recent rejection from 4037–4039 suggests short-term supply pressure, but overall market structure remains bullish with multiple BOS confirmations.
Current structure shows a liquidity grab → retracement phase before continuation.
📈 TRADING PLAN
Scenario 1 – BUY setup (preferable)
Entry zone: 3996 – 3994
Confirmation: Bullish reaction / CHoCH on lower timeframe (M5–M15)
TP1: 4030
TP2: 4038 (liquidity above weak high)
SL: 3988 (≈ 6$ risk range)
Bias: Continuation bullish leg after mitigation
Alternative BUY zone (deep retracement):
Entry: 3960 – 3958
TP: 4030
SL: 3952
Use only if price sweeps lower liquidity.
Scenario 2 – SELL setup (counter-trade)
Entry zone: 4037 – 4039
Confirmation: M15 bearish CHoCH / rejection candle
TP1: 4010
TP2: 3995
SL: 4045 (≈ 6$ risk range)
Bias: Short-term sell before retest demand
🧩 SUMMARY
Market still shows bullish structure, so buy setups at demand zones are higher probability.
Sell setups should be quick scalps around the weak high, targeting intraday retracement.

XAU/USD – Gold Maintains Short-Term Uptrend, Target $4,108🔍 Market Context
Gold continues to uphold a short-term uptrend structure after forming a clear Change of Character (ChoCH) around the 3,926 USD zone.
Buyers are in control as prices consistently create higher lows and react positively at the Order Block + Supporting Trendline zone.
As long as prices remain above the 3,940–3,926 USD area, the uptrend structure is preserved.
💎 Key Technical Zones
• Order Block Bullish: 3,926 USD → main support zone, confluence with rising trendline.
• Fair Value Gap (FVG): 3,942 – 3,972 USD → potential liquidity absorption zone.
• Resistance Zone: 4,032 USD → short-term resistance, needs to be broken to confirm continued uptrend.
• Liquidity Zone: 4,108 USD → expansion target if the above resistance is breached.
🎯 Trading Scenarios
1️⃣ BUY Setup – Prioritise catching the retracement from support zone
• Entry: 3,942 – 3,926 USD
• Stop Loss: 3,910 USD
• Take Profit:
– TP1: 3,972
– TP2: 4,032
– TP3: 4,064
– TP4: 4,108
✳️ “Buy the discount” – Prioritise orders in the confluence zone of OB + FVG to follow Smart Money flow.
2️⃣ SELL Scalp – Short-term at resistance zone
• Entry: 4,032 – 4,048 USD
• Stop Loss: 4,060 USD
• Take Profit:
– TP1: 4,010
– TP2: 3,972
– TP3: 3,942
✳️ “Sell the premium” – Activate only if clear price rejection signals appear at resistance.
💬 Summary
The current structure still leans towards bullish short-term with the 3,926 USD zone as the key invalidation zone .
As long as prices stay above the trendline, the immediate target is the 4,108 USD liquidity zone.
Optimal strategy: Buy on dip – Sell on reaction.
“Smart Money buys fear, sells greed — follow the footprints, not the noise.”
⏰ Timeframe: 1H
📅 Update: 31/10/2025
✍️ Analysis by: Captain Vincent

XAU/USD – Gold Eyes 4,100$ as Safe-Haven Demand Holds Firm🔍 Market Context
Gold continues to attract buyers for the second consecutive day, as renewed safe-haven demand supports a modest recovery from last week’s lows near 3,890$.
While the Fed’s hawkish stance keeps the Dollar firm, concerns over a prolonged US government shutdown and weaker macro sentiment have limited further USD gains — allowing gold to stabilize above the 3,970–3,990$ zone.
Still, with mixed fundamentals in play, traders remain cautious ahead of next week’s US data releases and policy speeches.
📊 Technical Outlook (H1–H4)
Gold has successfully broken its short-term downtrend, reclaiming momentum from the 3,933–3,973$ liquidity zone.
Price is now consolidating below the psychological 4,000$ handle, forming a clean breakout–retest structure.
Key Levels:
• Immediate Support: 3,973$ – 3,933$ (Breakout & Retest Zone)
• Resistance 1: 4,035$ – 4,050$
• Resistance 2 / Target: 4,114$ – 4,127$ (Fibo 1.618 extension)
• Extended Bull Target: 4,148$+ if momentum sustains
Invalidation: A breakdown below 3,930$ would invalidate the bullish scenario and re-open short-term downside liquidity toward 3,890$.
🎯 Trading Outlook
If gold holds the breakout above 3,970$, the bias remains bullish —
buyers may continue driving price toward 4,100$+, aligned with fib extensions and prior supply structure.
However, any hawkish narrative from Fed speakers could trigger intraday pullbacks before continuation.
⚜️ MMFLOW Insight:
“Smart money never rushes the breakout — it builds conviction where liquidity confirms direction.”

LiamTrading - XAUUSD: Outlook $5,000 USD and Priority BUY... LiamTrading - XAUUSD: Outlook $5,000 USD and Priority BUY Strategy at POC $3973
Hello traders community,
Gold is positioned between an extremely optimistic long-term outlook (forecast $5,000 USD in the next 12-18 months by Bank of America) and short-term technical adjustments.
Although Gold has broken the upward trendline, a sustainable downward trend has not been confirmed.
BUY positions are still prioritised!
🔥 LONG-TERM CONTEXT & INFLATION
Long-Term Push: Gold prices adjusted for inflation have DOUBLED in the past 4 years.
Highlight: Gold reinforces its role as an anti-inflation asset as real prices soar to all-time highs.
📊 DETAILED TRADING PLAN (ACTION PLAN)
Strategy: Buy at POC Zone to leverage liquidity advantage.
🟢 BUY Scenario (BUY Primary) - Buy at High Value Zone
Logic: The $3973 - 3975$ zone is right above the Buy POC (highest value zone).
Entry (BUY): $3973 - 3975$
SL: $3968$
TP1: $3988$ | TP2: $4000
Buy Up Target 2: Buy when price retests the trendline around $4002$.
🔴 SELL Scenario (SELL Scalping) - Preemptive strike at resistance zone
Entry (SELL): $4032 - 4034$
SL: $4040$
TP1: $4022$ | TP2: $4015
📌 SUMMARY & DISCIPLINE (Liam's Note)With the $5,000 USD forecast and inflation factors, the risk of SELL is increasing.
Focus on BUY at POC $3973$ and absolute SL.
Trade responsibly and with discipline!

Arbitrage as the Invisible Hand of Market BalanceUnderstanding the Concept of Arbitrage and Why Cross-Market Opportunities Exist.
Introduction: The Timeless Appeal of Arbitrage
In the world of finance and trading, arbitrage is one of the oldest and most reliable concepts for making profits with minimal risk. The idea is simple yet powerful — taking advantage of price discrepancies for the same asset across different markets or instruments. Arbitrageurs act as the balancing agents of the financial ecosystem. By exploiting small differences in prices, they help maintain market efficiency and price stability.
While it might sound straightforward — buy low here, sell high there — in practice, arbitrage is an intricate process driven by technology, timing, and global financial linkages. Cross-market arbitrage, in particular, shows how interconnected today’s world is, where an event in New York or London can instantly impact prices in Mumbai or Singapore.
Let’s delve deeper into what arbitrage means, its types, and why cross-market opportunities continue to exist despite the rise of advanced trading systems and AI-driven algorithms.
1. What is Arbitrage?
Arbitrage is the practice of simultaneously buying and selling an asset in different markets to profit from the difference in price. The key here is simultaneity — both transactions occur at the same time to lock in a risk-free profit.
In essence, arbitrage ensures that the law of one price holds true: an identical asset should have the same price across all markets. When this is not the case, arbitrageurs step in, quickly exploiting the gap until prices converge again.
Example:
Suppose shares of Company X trade at ₹1,000 on the National Stock Exchange (NSE) and ₹1,005 on the Bombay Stock Exchange (BSE). A trader can buy on NSE and sell on BSE simultaneously, earning ₹5 per share in profit before transaction costs. While this seems small, when executed at scale with automation, such trades can generate significant returns.
2. The Core Principle: The Law of One Price
At the heart of arbitrage lies the law of one price, which states that in an efficient market, identical assets should trade for the same price when exchange rates, transaction costs, and other frictions are considered.
If gold is priced at ₹6,000 per gram in India and $70 per gram in the U.S., and the exchange rate is ₹85 per dollar, then ₹6,000/₹85 = $70.5 per gram — nearly identical. Any meaningful difference would invite traders to move gold (physically or virtually) from one market to another until prices align.
However, real-world markets aren’t always perfectly efficient, which gives rise to temporary price imbalances — and hence, arbitrage opportunities.
3. Types of Arbitrage in Financial Markets
Arbitrage comes in several forms, each suited to different asset classes and market structures. Below are the most common:
a) Spatial (Geographical) Arbitrage
This is the classic form of arbitrage where an asset is bought in one location and sold in another. Common examples include commodities, currencies, or stocks listed on multiple exchanges.
b) Temporal Arbitrage
This occurs when traders exploit price differences across time periods. For instance, buying a stock today and selling a futures contract for delivery next month when the future price is higher.
c) Statistical Arbitrage
Here, traders use quantitative models to identify mispriced securities based on historical relationships. It’s not purely risk-free but relies on probability and mean reversion.
d) Triangular Arbitrage (Currency Markets)
In the forex market, triangular arbitrage involves exploiting discrepancies among three currency pairs. For instance, if EUR/USD, USD/GBP, and EUR/GBP don’t align mathematically, a trader can profit by cycling through the three conversions.
e) Merger or Risk Arbitrage
This form occurs during corporate events such as mergers or acquisitions. Traders speculate on price movements between the target company’s current price and the offer price.
f) Cross-Market Arbitrage
This involves exploiting price differences for the same or related assets across different markets or asset classes — such as spot and futures, or equity and derivatives markets.
Cross-market arbitrage is increasingly important in today’s globalized, interconnected trading landscape.
4. Understanding Cross-Market Arbitrage
Cross-market arbitrage happens when traders take advantage of price differences for the same security, index, or commodity across multiple exchanges or platforms — often across borders.
For example, if Reliance Industries trades at ₹2,500 on the NSE but ₹2,507 on the Singapore Exchange (SGX) as a derivative instrument, an arbitrageur could buy the cheaper one and sell the higher-priced version, profiting from the spread until prices converge.
This form of arbitrage often occurs between:
Spot and futures markets (cash-and-carry arbitrage)
Domestic and international exchanges
Equity and derivative markets
Cryptocurrency exchanges across countries
The profit margins may be narrow, but in high-volume or algorithmic environments, these trades can yield consistent gains.
5. Why Do Cross-Market Opportunities Exist?
If markets are efficient, one might wonder — why do such price differences exist at all? Theoretically, arbitrage should eliminate inefficiencies quickly. However, several real-world frictions allow opportunities to emerge and persist, at least temporarily.
Let’s explore the main reasons:
a) Market Segmentation
Not all investors have access to all markets. Regulatory barriers, currency restrictions, or exchange-specific membership requirements can create segmented markets, allowing the same asset to trade at different prices.
For instance, Chinese A-shares often trade at higher valuations on mainland exchanges compared to Hong Kong-listed H-shares of the same company due to limited investor access in mainland markets.
b) Currency Exchange Rates
When assets are priced in different currencies, exchange rate movements can create temporary mispricing. Even slight discrepancies in forex rates can lead to arbitrage between markets.
c) Liquidity Differences
Some markets are more liquid than others. Lower liquidity can lead to price delays or inefficiencies, allowing faster traders to exploit differences between high-liquidity and low-liquidity venues.
d) Information Asymmetry
Not all markets react to information simultaneously. If news reaches one market faster, prices there adjust sooner, creating short-lived arbitrage opportunities elsewhere.
e) Transaction Delays and Infrastructure Gaps
Even in an era of high-frequency trading, minor lags in data transmission or order execution can result in tiny but exploitable differences between exchanges.
f) Demand and Supply Imbalances
Cross-market demand differences — due to institutional orders, fund flows, or hedging needs — can push prices temporarily away from equilibrium, creating room for arbitrage.
g) Regulatory and Tax Factors
Different tax structures, capital controls, or transaction charges across countries can cause effective price differences for the same asset.
6. How Arbitrage Helps Maintain Market Efficiency
Arbitrage isn’t just about making profits — it plays a crucial stabilizing role in the global financial system.
Whenever arbitrageurs exploit price gaps, their actions force prices back toward equilibrium. For example, buying in the cheaper market increases demand (raising the price) while selling in the expensive market increases supply (lowering the price). This self-correcting mechanism ensures that prices remain aligned across regions and instruments.
In this sense, arbitrage acts as a natural regulator of market inefficiencies, contributing to:
Price uniformity
Efficient capital allocation
Market liquidity
Reduced volatility
7. The Role of Technology in Arbitrage
In earlier decades, arbitrage required manual observation, phone calls, and physical trade execution. Today, it’s dominated by algorithms and high-frequency trading (HFT).
Modern arbitrageurs use advanced systems to:
Track price discrepancies in microseconds
Execute simultaneous trades across exchanges
Manage massive volumes with minimal latency
Technological advancements such as co-location (placing servers near exchange data centers), API connectivity, and AI-driven analytics have transformed arbitrage from human-driven intuition to machine-executed precision.
However, this also means that arbitrage opportunities now close much faster — often within milliseconds — requiring traders to invest heavily in technology.
8. Risks and Challenges in Arbitrage
While arbitrage is considered “risk-free” in theory, in reality, several factors can turn it risky:
Execution Risk: Prices may change before both sides of the trade are completed.
Latency Risk: Delays in order processing can erase profits.
Transaction Costs: Fees, taxes, and slippage can turn a profitable trade into a loss.
Regulatory Restrictions: Some countries restrict cross-border or high-frequency trading.
Currency Risk: Exchange rate fluctuations can alter effective profits.
Thus, while arbitrage is low-risk compared to speculative trading, it demands precision, capital, and infrastructure to succeed consistently.
9. Real-World Examples of Cross-Market Arbitrage
a) NSE–BSE Price Differentials
Large-cap Indian stocks often trade simultaneously on both exchanges. Automated systems constantly scan for minute price differences to execute cross-exchange arbitrage.
b) SGX–Nifty Futures Arbitrage
For years, the SGX Nifty index futures in Singapore traded slightly differently than Indian NSE Nifty futures. Arbitrageurs would buy in one market and sell in the other, balancing the two indices.
c) Cryptocurrency Exchanges
Crypto markets, being decentralized and fragmented, often exhibit significant cross-exchange price differences. For instance, Bitcoin might trade at a premium in South Korea compared to the U.S. — known as the “Kimchi Premium.”
10. The Future of Arbitrage in a Globalized Market
As technology continues to advance and global connectivity deepens, traditional arbitrage margins are shrinking. However, new forms of arbitrage are emerging, especially with the rise of:
Digital assets and tokenized securities
Decentralized finance (DeFi) platforms
Algorithmic and machine-learning-based trading strategies
Cross-market inefficiencies will likely persist in newer, evolving markets where regulatory fragmentation, liquidity gaps, and data asymmetry continue to exist.
In other words, while arbitrage profits might be slimmer, the scope of opportunities is expanding — not disappearing.
Conclusion
Arbitrage is more than just a trading strategy — it’s a mechanism that keeps the global financial system efficient and interconnected. By seizing fleeting opportunities born from imperfections, arbitrageurs ensure that prices reflect true value across geographies and instruments.
Cross-market opportunities exist because no market is perfectly efficient. Differences in time zones, liquidity, regulation, and information flow continuously create temporary imbalances. For traders equipped with speed, strategy, and precision, these moments translate into consistent profits — and for the broader system, into greater market harmony and stability.
In a world that trades 24/7 across borders, arbitrage will always find a way — adapting to new technologies, instruments, and markets — remaining one of the purest expressions of financial logic and opportunity.

XAUUSDGold shows bullish retracement. It will react from inducement zone. and will fall to the Demand and reverse to continue upside.

XAUUSDGold rejected from the support area broke the Trendline and formed a pattern head and shoulders shorting gold here.
Tp - 3959

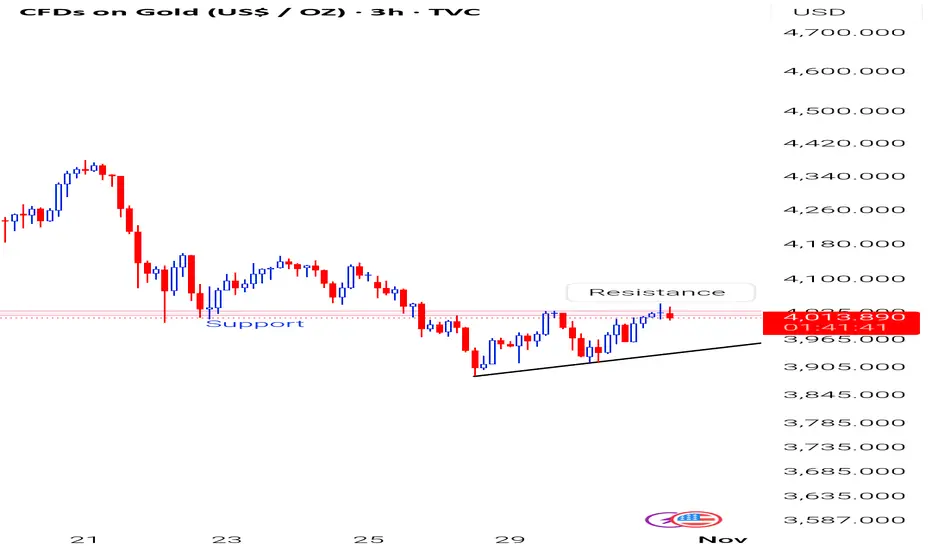
Gold Continues to Struggle at 4000We're seeing a familiar story play out in gold as it makes multiple attempts to reclaim and hold above the 4000 level, but none of these efforts are showing the conviction we need to see from buyers. The price action on the hourly chart is particularly telling ,we're witnessing similar structural patterns repeating themselves, which often indicates indecision or a lack of strong directional commitment from either side. Once again, we've seen the rising support trendline get broken, which is not ideal for the bullish case in the short term.
However, there's a small silver lining worth noting. Today's CPR is showing an ascending structure, which typically carries some positive implications for intraday sentiment. It's not a game-changer by itself, but it does suggest that the technical setup isn't completely bearish. The key level to focus on for today's session is the CPR BC at 3971. This becomes our pivotal point ,if bulls can sustain trading above this level throughout the day, we could see another recovery attempt materialize toward the higher side. The ability to hold above 3971 would at least keep the door open for further upside exploration.
On the flip side, if we fail to maintain support at 3971 during the intraday session, it could trigger another leg down toward lower levels. Given the repetitive failed attempts at 4000 and the breakdown of support trendlines, the market is clearly at a crossroads here. We need to see some decisive action one way or the other to break out of this choppy, repetitive pattern.
As for my positioning, there's no change to my approach. I'm still holding my buy positions and actively managing the trades as this price action develops. The patience game continues, and while these repeated failures at 4000 are testing that patience, the broader picture still supports the long-term bullish thesis.

Xauusd TradePrice has just touched my entry zone and trade is active. Now staying patient and focused — will hold until it reaches the target zone. Trusting the setup, not emotions 💪✨

Gold : if fails to hold recent high 4046 then be ready for Gold taken resistance at previous support which is very crucial juncture. Expecting a sharp fall in coming day is ready .. here RR is favourable in terms of seller .
Check your set-up .
# No recommendation
Gold Trading Strategy for 31st October 2025📈 TVC:GOLD TRADING PLAN (31 OCT 2025)
💰 BUY SETUP:
➡️ Enter GETTEX:BUY above the high of the 1-hour candle — only after candle closes above $4063
🎯 Target Levels:
1️⃣ $4073
2️⃣ $4083
3️⃣ $4095
🛡️ Stop Loss: Low of the breakout candle or as per your risk appetite
📊 Confirm with strong bullish momentum (RSI rising / volume spike) before entry.
📉 SELL SETUP:
➡️ Enter $Sell below the low of the 1-hour candle — only after candle closes below $3993
🎯 Target Levels:
1️⃣ $3983
2️⃣ $3973
3️⃣ $3963
🛡️ Stop Loss: High of the breakdown candle or as per your risk appetite
📊 Wait for bearish confirmation (strong red candle / volume support) before selling.
⚠️ DISCLAIMER:
📜 This analysis is for educational and informational purposes only. Trading in TVC:GOLD or any other financial instrument involves market risk. Always perform your own analysis or consult a certified financial advisor before taking any trade. The author is not responsible for any profits or losses.
