Gold Analysis & Trading Strategy | November 19-20✅ From the 4-hour chart, gold experienced a strong rebound yesterday, releasing some short-term bullish momentum. However, the price encountered significant resistance near 4132 (previous high + upper Bollinger Band).
The latest candle shows a large bearish candle with a long upper wick, which is a classic signal of bulls failing to break higher and profit-taking pressure intensifying.
MA5 and MA10 have started to turn downward, indicating weakening short-term momentum.
MA20 (around 4089) still provides partial support, but it has already been broken through quickly.
The upper Bollinger Band (around 4130) remains a strong resistance level, with price quickly falling below the mid-band after the spike.
The lower wick touched 4055, suggesting that short-term buying interest exists in this area.
The short-term rebound structure has been damaged, and the 4-hour timeframe has entered a corrective phase turning weaker again.
If gold breaks below 4058–4050, bearish momentum will strengthen further.
✅ On the 1-hour chart, gold formed a short-term high at 4132, followed by a sharp sell-off.
Two consecutive large bearish candles broke below MA5 / MA10 / MA20 / MA60, forming a classic one-sided reversal signal.
The bullish structure is completely broken, and moving averages have shifted back into a bearish alignment.
Key support lies at 4050–4049, a strong confluence support zone. Breaking below this area will open further downside potential.
The current small rebound is weak and only a technical correction, showing that bears still dominate the short-term price action.
The rebound only reached below MA20 (around 4085), showing that selling pressure above remains strong.
Short-term structure is bearish, and any weak rebound is unlikely to break above 4085–4090. After the rebound, price is still likely to retest the 4050 area.
🔴 Resistance Levels:4085–4090 / 4100–4110 / 4125–4132
🟢 Support Levels:4058–4050 / 4030 / 3998
✅ Trading Strategy Reference
🔰 Strategy 1: Short at 4085–4090 (Main Idea)
If gold rebounds to 4085–4090 and shows resistance:
Light short positions
Stop-loss: 4098
Targets: 4060 / 4050
👉 Current trend is bearish; selling rebounds is the main logic.
🔰 Strategy 2: Short again at strong resistance (Aggressive Short)
If gold rebounds to 4100–4110:
Medium-sized short positions
Stop-loss: 4118
Targets: 4065 / 4050
👉 This area is strong resistance; short-term breakout probability is low.
🔰 Strategy 3: Breakout shorts below 4050 (Trend-following)
If price breaks 4050:
Bearish momentum will accelerate
Targets: 4030 / 4000
👉 4050 is the key level determining whether bears will continue the downward move.
📌 Summary
4H rebound was rejected; structure turning weaker
1H shows a sharp breakdown; bears dominate short-term price action
4085–4090 is the main zone for selling rebounds
4050 is the most important support today—breaking it will open deeper downside
Trade ideas

LiamTrading – XAUUSD H1 | Gold breaks bullish structure...LiamTrading – XAUUSD H1 | Gold breaks bullish structure, short-term downside takes control
Gold has dropped sharply by more than $20 in a short time, losing over 1% on the day and moving close to the lower 4,030 area. The previous bullish structure has officially been broken, 4040 failed to hold, and today’s focus continues to be selling with the trend until the 4000–398x support zone shows clear reactions.
Macro Analysis
Gold prices declined as expectations for a December rate cut weakened: JPMorgan no longer forecasts a Fed rate cut in December, opposite to their earlier 25 bps cut scenario.
Some institutions still believe rising unemployment and weaker economic data may force the Fed to cut 25 bps at the upcoming meeting.
The market is currently pricing the probability of a December rate cut at nearly “50–50,” creating strong uncertainty and putting short-term pressure on gold, even though the metal still benefits in the long term if the rate-cut cycle begins.
Technical Analysis H1 – Bearish structure, price channel, and support zones
After breaking below 4040, price formed a series of Lower Highs – Lower Lows, confirming a Dow-theory bearish structure on H1.
A falling channel is forming; the channel’s upper boundary aligns with the short-term resistance zone at 4050–4060.
4000 zone: a key psychological support. If broken decisively, the medium-term structure may shift into a deeper corrective phase.
Buy Zone 3987–3989
Strong support confluence + Fibonacci extensions (1.618/2.272) of the current bearish swing
Optimal area for catching a corrective bounce if clear reversal signals appear
Key Resistance Levels Today
4052–4054: retest of former support + upper boundary of falling channel → ideal area for a pullback-sell setup.
Trading Scenarios Today (LiamTrading)
Scenario 1 – SELL with the prevailing downtrend (priority)
Entry: 4052–4054
SL: 4060
TP: 4030 → 4015 → 3990
Logic: Price retraces to resistance + channel top, suitable for trend-continuation selling. Prefer setups where M15 shows rejection candles (pin bar/bearish engulfing) around 405x.
Scenario 2 – BUY at strong support 398x (counter-trend bounce)
Entry: 3987–3989
SL: 3980
TP: 3999 → 4014 → 4040 → 4080
Logic: 398x is a high-confluence support zone; trigger only when clear price reaction appears (long lower wicks or reversal patterns on M15–H1).
This is counter-trend, so use smaller position sizes and take partial profits.
Risk Notes & Invalidation
H1 closes above 4060: short-term bearish structure weakens → pause all sell setups and reassess.
H1 closes below 3980: buy zone fails → downside could extend further; only sell setups preferred.
Always keep risk per trade at 0.5–1%, and once reaching +1R, move SL to break-even.
Are you leaning towards continuing to sell with the trend, or waiting to buy the dip at 398x?
Follow LiamTrading on TradingView for daily XAUUSD updates

XAUUSD MULTI TIMEFRAME ANALYSIS Hello traders , here is the full multi time frame analysis for this pair, let me know in the comment section below if you have any questions , the entry will be taken only if all rules of the strategies will be satisfied. wait for more price action to develop before taking any position. I suggest you keep this pair on your watchlist and see if the rules of your strategy are satisfied.

Cup and Handle Detected: A Bullish Outlook for XAUUSDOANDA:XAUUSD is forming a very clear Cup and Handle pattern. Price previously dropped toward the 4000 region, rounded out, and then climbed back toward 4080, completing the cup structure. At the moment, the market is making a mild pullback and shaping a tight and well controlled handle.
If price can break this resistance with strong momentum, the next target I expect is around 4150. Until a confirmed breakout appears, patience remains essential. No breakout means no trade.
This is a classic bullish formation, and market expectations are gradually strengthening.

XAUUSD Double Bull Flag — Danger AheadHello my dear traders, Laura here.
This week, the market has been extremely tense, and the price action reflects it well.
As I mentioned before, we are currently seeing the formation of a large bull flag. Just above it, a smaller flag is developing, and this smaller structure is the key trigger for any potential continuation. The bullish outlook remains valid only if this smaller flag breaks cleanly.
The recent pullback dipped deeper than expected, which signals hesitation from buyers. When confidence fades, even a promising breakout can turn into a sweet trap that lifts briefly before falling sharply.
Because of this, patience becomes essential. Before entering, we need a clear and decisive breakout that confirms strength. Specifically, we should look for a candle that breaks through resistance with firmness and clarity. If such a confirmation appears, the path toward the 4,300 level becomes structurally supported.
On the other hand, if the price falls below the lower trendline, the bullish scenario is invalidated immediately. At that point, the setup no longer holds and should not be traded.
For now, the principle is straightforward.
No breakout means no entry. Stay disciplined and avoid letting the market pull you into unnecessary risk.

LiamTrading – XAUUSD H1 | Continue to watch for SELL at the ...LiamTrading – XAUUSD H1 | Continue to watch for SELL at the start of the week – wait for price to retrace to the trendline & resistance for a perfect entry
Gold is experiencing a sharp decline amidst global market liquidity pressures. The simultaneous drop in gold, stocks, and Bitcoin indicates that capital is being withdrawn from risky assets and even safe havens, similar to tense periods like the 2008 crisis or the early 2020 pandemic. Investors are selling profitable assets to cover losses elsewhere.
In the long run, gold usually recovers sooner, but in the short term, the downtrend still prevails.
On H1, the price is below the descending trendline, under the 4100 resistance, and is moving in a clear Lower High – Lower Low structure. This is a good signal to continue prioritising SELL orders retracing to resistance.
🔍 Technical Analysis (Trendline • S/R • Fibonacci • Liquidity)
The descending trendline is the biggest barrier; each time the price hits the trendline, it is strongly rejected.
Main Resistance:
4098–4100: resistance area + confluence with the trendline.
4120–4130: stronger area if the price retraces deeply (close to Fibo 0.382).
Target Support:
4065: intermediate support – where the price has bounced slightly several times before.
4040 – 4025: large liquidity area – confluence with the H1 FVG bottom.
3985–3995: the end zone of the down wave if the selling force expands.
Liquidity Zone:
Many liquidity sweep bottoms continuously → indicates that the selling force still prevails.
The lower FVG area (around 4025–4040) is highly likely to be filled within the week.
📉 Trading Scenario (prioritise SELL retracement)
Scenario – SELL retracement to trendline + resistance (priority)
Entry: 4098–4100
SL: 4106
TP: 4088 → 4065 → 4040 → 4025
💡 Suggestion: Wait for M5–M15 to form a rejection candle (pin bar / bearish engulfing) before executing the order.
When to BUY?
Only BUY if:
H1 closes above 4120, breaking the descending trendline → short-term trend phase change.
If this signal is not present → do not rush to buy against the trend.
⚠️ Important Note
The phenomenon of “selling everything to hold cash” may continue → gold may remain under pressure in the short term.
Which price range are you watching for today's session?
Comment below & Follow LiamTrading channel for the fastest updates!

XAUUSDTrading is easy, but trading with convection is only possible after you have 5-6 years of experience trading in every market.
It is this experience that can tell you how high the market can go, if you are tracking the stock correctly, and only then can you estimate how much profit booking can happen.
This is possible only with experience. Its the time to book profit in gold. gold ready for create a new lower high formation.

LiamTrading – XAUUSD H1 | Gold Holds 0.618, Bullish Scenario...💛 LiamTrading – XAUUSD H1 | Gold Holds 0.618, Bullish Scenario Preferred for Wednesday 🎯
Gold continues to recover after the previous decline and is currently sitting right at the 0.618 Fibonacci level on the H1 timeframe — indicating buyers still have the upper hand. Price is also holding above the rising trendline and the thick Volume Profile area around 407x, so for today’s session, I continue to prioritise BUY setups in line with the trend.
📰 Macro – News Context
After the U.S. government reopened, the market is preparing for a series of economic data today and tomorrow → both USD and Gold may experience strong volatility.
President Trump attacked Fed Chair Powell, calling him “stupid and incompetent,” saying he once wanted to fire him immediately but was stopped by advisors.
👉 Because of this, market sentiment is very sensitive: if data leans towards a rate-cut scenario, Gold could gain additional support.
📊 Technical – H1 with Fibonacci, Trendline & Volume Profile
Fibonacci 0.618: Price is holding at the 0.618 level of the latest downswing; if this level holds, the natural target will be the upper FVG + resistance zone 4120–4150.
H1 Uptrend Line: The trendline from the recent low is supporting price very well; each retest generates a bullish reaction → an ideal area to wait for BUY entries.
Volume Profile & Liquidity:
The 4075–4080 zone is Buy Liquidity — thick volume, lots of order flow → suitable as an entry point if price retests.
VAL ~4040 and the Support + FVG area around 4020 are the next defence zones if the market sweeps deeper.
Upside liquidity:
Past H1 FVG remains unfilled up to at least 4150, so if the bullish scenario plays out, Gold can easily extend into this zone.
🎯 Trading Scenarios (LiamTrading)
1️⃣ Primary Setup – BUY with Trend
Entry: 4078–4080 (trendline retest + strong volume cluster)
SL: 4073
TP: 4094 → 4120 → 4140 → 4175
💡 Notes:
Wait for a clean M5–M15 bullish reaction (long lower wick, pin bar, or bullish engulfing) around 4078–4080 before entering.
Once price moves ~1R in profit, move SL to breakeven for account protection.
2️⃣ Short-term Scalping Zones
Support – quick buys: 4048–4023 (VAL + lower FVG zone).
Resistance – quick sells: 4121–4151 (FVG + upper liquidity zone).
These are only for scalping, so:
Enter on smaller timeframes (M5–M15).
Take profits quickly, avoid holding through major news.
✅ Summary
Short-term trend: Bullish bias as long as price holds above the H1 trendline and the 0.618 zone.
Main plan: Wait for BUY at 4078–4080, targeting 4120 → 4140 → 4175.
So, what do you think — will Gold push straight to 4150, or will it sweep down toward 404x first?
👉 Share your view in the comments & Follow LiamTrading to get daily XAUUSD plans on TradingView.

XAUUSD MULTI TIMEFRAME ANALYSIS Hello traders , here is the full multi time frame analysis for this pair, let me know in the comment section below if you have any questions , the entry will be taken only if all rules of the strategies will be satisfied. wait for more price action to develop before taking any position. I suggest you keep this pair on your watchlist and see if the rules of your strategy are satisfied.

Gold (Neowave Trading Idea)Hello everyone
# Gold is started walking again in daily charts and its going or atleast try for the time being to break its all time again.
## Stoploss will be 3964 if breaks dont sell just exit.
Thanks

XAUUSD: Likely continuation following pullbackXAUUSD has surged into a strong uptrend, and I predict that this momentum will continue, with a potential target around 4,150, as shown on my chart.
The current price level may be a critical turning point. Here, the price could find support and continue to rise, or if it breaks below, we might see an extension of the downward trend.
If I had to choose a direction, I would lean towards more upside, but the final decision should be based on price action to determine the next move.
However, if the price breaks decisively below the trendline, it would invalidate the bullish scenario, indicating that the uptrend could pause or even reverse in the short term.
These are just my personal views based on chart analysis, not financial advice. Always verify your setups and manage your risk carefully.

GOLD: The Bigger Picture is Finally Getting Clearer !Gold finally showed some clarity after weeks of structure, and now the bigger picture is lining up perfectly across the daily and multi-year weekly charts. The rejection from the 4250–4350 zone triggered the first meaningful retracement after a parabolic rally, and price is now hovering right above the 4030–4060 daily support the only level holding back a much deeper corrective cycle. This entire region is critical because it marks the last breakout base, the liquidity origin, and the midpoint of the 3600-4300 vertical leg. As long as this shelf holds, gold will continue to move in a compressed range, but once a clean daily close breaks below it, the market naturally opens up a fast move toward the 3500–3550 target zone. All confluences measured move, channel midline, point to this same cluster, making it a high-confidence retracement level inside a long-term bullish trend.
On the upside, the structure is very clean. Only a sustained breakout above 4300–4350 invalidates the entire correction and flips the bias back to full-bull mode, where gold can easily run toward 4600–4800 as the next discovery leg. Anything below that zone still falls under the extended correction category, not a bullish continuation. This is why the invalidation level is drawn exactly where it is to protect from guessing the reversal too early.
On the weekly chart, gold has slipped back inside the multi-year ascending channel after briefly wicking above it. That wick was nothing but a classic blow-off extension followed by a reversion to mean. Now price is sitting comfortably inside the same long-term structure . The upper red band remains the multi-year resistance, the green midline is the structural backbone of the trend, and the purple lower band is the deep cycle accumulation zone. As long as gold stays inside this channel, the macro remains strongly bullish and corrections within this structure are normal and healthy. The mid-channel region around 3500 also aligns perfectly with the expected daily correction, which adds even more confirmation that this retracement is simply part of the long-term trend and not a trend reversal.
Commodity index on both daily and weekly frames is cooling off from extreme levels, which supports a deeper pullback rather than an immediate rally. No new bullish divergence has appeared yet, meaning momentum still favors a downside sweep before any major upside continuation. Combine that with the lack of fresh macro drivers and a stabilization in rate-cut expectations, this cooling phase was overdue.
In simple below daily support, gold continues the correction toward 3500-3650 above 4350, the correction thesis dies and the bull trend resumes aggressively. Until then, this is a textbook retracement inside a long-term uptrend nothing broken, nothing unexpected, just a parabolic market taking a breath. Trade safe !

The Gold Bullish Setup You Can't Miss!OANDA:XAUUSD The price is clearly approaching a critical support zone, one that has previously triggered positive reactions in the market. This zone also aligns closely with the psychological level of $4,000, which tends to capture the market’s full attention.
Given the current momentum, there’s a strong possibility that buyers will step in and push prices higher. A confirmation, such as a solid rejection pattern, a bullish engulfing candle, or a long lower shadow, would significantly increase the likelihood of a rebound. If my analysis proves accurate, and buyers regain control, we could see the price rise to around $4,070.
However, if the price breaks below this key support, it would negate the bullish outlook and could lead to further declines.
Please note, this is not financial advice!

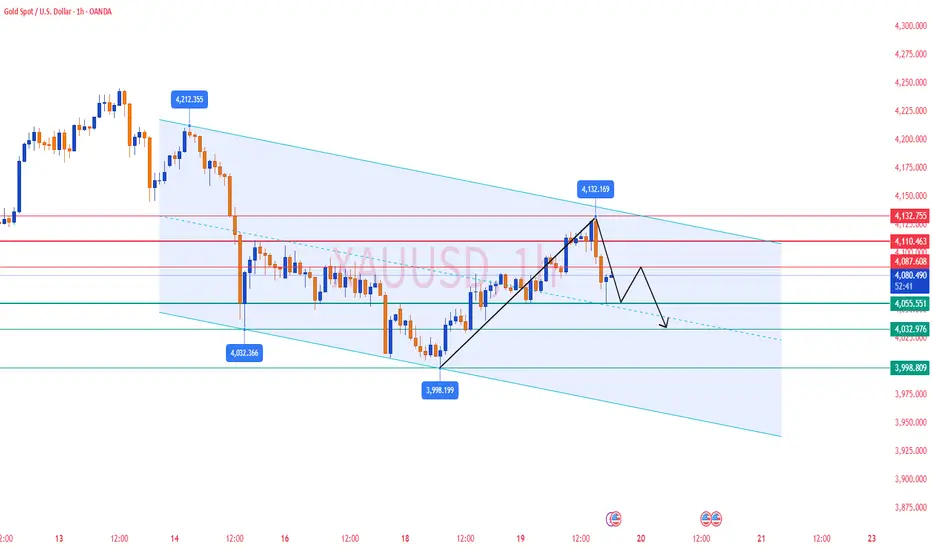
Gold Technical Rebound to FVG, Prioritise WATCHING FOR SELL at 4📊 Market Structure
Gold has completed a strong decline from the peak of 4.21x, leaving consecutive Break of Structure (BoS), confirming a short-term bearish structure.
The drop through the Breakout zone of 4.10x indicates a dominant selling force.
Currently, the price is bouncing from the Premium Zone 4.05x, aligning with the technical rebound behaviour after a strong sell-off.
The BUY side is merely pulling the price back to the abandoned liquidity zones (FVG 4.12x – 4.15x) before the SELL side can regain control.
The upper FVG zone is where the price often returns to fill after a steep fall. This is also the confluence zone between:
FVG (Fair Value Gap)
Old candle body Breaker
Fibonacci Premium
→ The risk of selling at these zones is very high.
💎 Key Technical Zones
Rebound zone for Sell
FVG 1: 4.101 – 4.126
FVG 2 (Strong Confluence): 4.126 – 4.150
Support zone – target to hit
Premium Zone $$$: 4.050 – 4.052
Lower FVG: 4.030 – 4.035
High probability price scenario: Rebound to FVG → reaction → continue to decline to 4.03x.
🎯 Trading Plan – Prioritise SELL
1️⃣ SELL Setup – High Probability
Wait for price to rebound to the above FVG zones:
Entry SELL:
4.118 – 4.126
Can add orders at higher: 4.140 – 4.150
Stop-loss: above 4.158
TP1: 4.101
TP2: 4.050
TP3: 4.030
✔️ This is a trend-following setup, selling at premium, adhering to SMC principles.
✔️ The current price is just beginning the rebound, not yet meeting BUY conditions.
2️⃣ BUY Setup – Only activate on deep Discount
Entry BUY: 4.030 – 4.035 (Lower FVG)
SL: below 4.020
TP: 4.070 – 4.100
→ BUY is only for counter-trend traders and must wait for a clear discount.
🧠 Vincent’s View
The market is in a distribution – decline phase, every rebound aims to pull liquidity.
As long as the price does not close above 4.150, SELL remains the optimal strategy for the day.
Observe closely when the price hits 4.12x – 4.15x, this is a “high-risk” zone for the BUY side and a “great opportunity” for the SELL side.
“Sell where the liquidity lives — that’s where institutions strike.” ⚜️
⏰ Timeframe: 1H
📅 Update: 17/11/2025
✍️ Analysis by: Captain Vincent

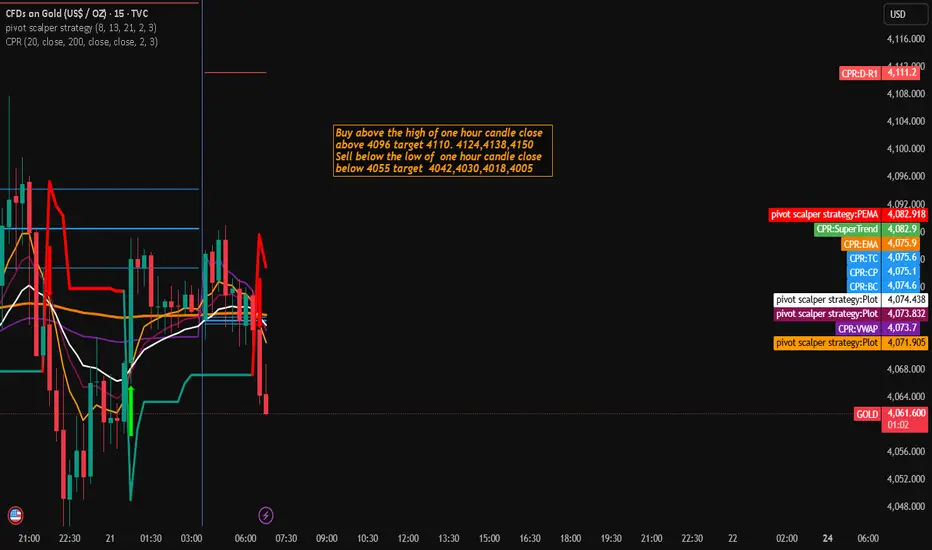
Gold Trading Strategy for 21st November 2025📈 BUY SETUP (Long Position)
➡️ Condition to Enter Buy:
Enter a BUY only if the 1-Hour candle closes above the high of 4096.
This confirms bullish momentum and reduces false breakouts.
🎯 Buy Targets:
TP1: $4,110
TP2: $4,124
TP3: $4,138
TP4: $4,150
🛑 Recommended Stop Loss:
Place SL below the breakout candle low or ≈ $4,085–4,088 based on your risk comfort.
📝 Reasoning:
A strong close above $4096 indicates buyers gaining control.
Targets move in 14–16 point intervals, ideal for intraday or short swing trades.
📉 SELL SETUP (Short Position)
➡️ Condition to Enter Sell:
Enter a SELL only if the 1-Hour candle closes below 4055.
This signals bearish continuation.
🎯 Sell Targets:
TP1: $4,042
TP2: $4,030
TP3: $4,018
TP4: $4,005
🛑 Recommended Stop Loss:
Place SL above the breakdown candle high or ≈ $4,062–4,067 depending on volatility.
📝 Reasoning:
A close below $4055 confirms downside pressure.
Targets decrease in 12–15 point steps, matching typical gold volatility on breakdowns.
🧠 TRADING TIPS
Always wait for candle close confirmation, not wick break.
Use 1–2% risk per trade to avoid major drawdowns.
Check news events (FOMC, CPI, NFP) before entering any trade.
Watch market structure on 15m for refined entries.
⚠️ DISCLAIMER
This analysis is for educational & informational purposes only.
It is NOT financial advice, and trading involves high risk.
You are responsible for your own trading decisions.
Always do your own analysis and use strict risk management.
Brian here with the gold outlook for November 20thGood morning everyone, Brian here with the gold outlook for November 20th. The ABC correction phase of gold is nearly complete, and the market is preparing to enter a new wave phase amidst a flurry of USD data today.
Fundamental Analysis
Today's focus remains on the US labor data: NFP (or revisions), Unemployment Rate, and Initial Jobless Claims.
If the data shows a cooling labor market, expectations for the Fed to soon pivot to a rate-cutting cycle will rise, weakening real yields, putting pressure on the USD, and supporting gold prices.
Conversely, "too good" data will strengthen the dollar, allowing for a short-term repricing move, potentially dragging gold down to lower liquidity zones before recovering.
US session liquidity may be thin before the news release, making it prone to spikes due to algorithms and large flows simultaneously adjusting positions.
Overall, the macro backdrop still favors "buying the dip" for gold, but you must accept strong volatility around news time.
Technical Analysis
On the chart, gold has completed an ABC corrective wave within a descending channel, part of a larger uptrend.
The current descending channel only serves as a corrective leg after the previous upward wave; prices are trading above the "mean" area of the bullish structure, indicating the larger market structure remains bullish.
Below is the liquidity zone / demand zone 4013–4015, coinciding with the previous low and the lower channel boundary – if there's another stop-hunt to this area, it is still considered an opportunity to join the upward move, as long as 4008 is not breached.
Above, the 4086–4100 cluster is the decision zone: breaking and holding above here will confirm exiting the corrective channel, triggering an impulsive leg towards resistances 4132–4146 and further to 4187.
In summary, the main bias remains bullish, prioritizing buy strategies at support zones or after breakout confirmation.
Key Price Levels
Resistance: 4086 – 4100 – 4110 – 4132 – 4146
Support: 4040 – 4030 – 4015
Trading Scenarios
Buy Scenario 1 – Continuation Breakout
Entry: 4086
SL: 4078
TP: 4100 – 4120 – 4140
Prioritize when price breaks up and retests 4086–4100 as a new support zone, confirming exit from the descending channel.
Buy Scenario 2 – Deep Liquidity Sweep
Entry: 4015–4013
SL: 4008
TP: 4030 – 4045 – 4070
Watch for strong price reactions at the demand zone, with pin bars or engulfing candles signaling order flow returning to buyers.
Sell Scenario – Sell Reaction at Strong Resistance
Entry: 4144–4146
SL: 4151
TP: 4132 – 4120 – 4100
Short-term sell strategy, leveraging the high supply zone if price rises straight up without sufficient accumulation.
The medium-term upside target if the bullish wave develops as expected remains the 4187 area.
What do you think of this scenario? Remember to follow Brian for daily gold insights and comment your views below to join the discussion.

#XAUUSDPlease stick to your strategies
Any resistance will lead to big losses
Never take revenge on the market if a loss is triggered
Close the trade if the channel ceiling is broken

this is the tringle pattern , tringle contines the trendthis is the tringle pattern , tringle contines the trend, so we can continew with the trend

Pressured Below 4050$ as Bears Target the 4,000$ Liquidity BreakGold continues to trade under heavy selling pressure, staying capped beneath 4,050$ and hovering just above the major liquidity floor at 4,000$.
With fading expectations for a December Fed cut and cautious global sentiment, buyers remain defensive while sellers maintain structural control.
📊 Technical Outlook (H1)
Price remains inside a tight 4,053$ → 4,000$ distribution zone, with the descending trendline keeping gold suppressed.
The POC around 4,053$ is acting as a firm ceiling; every retest so far has been rejected.
Fibonacci projections from the last drop highlight two major downside liquidity zones:
3,945$ → first liquidity cluster
3,876$ → deeper extension and key demand
Current structure resembles a bear flag, hinting that the market may be preparing for another downside expansion.
🎯 Key Scenarios
1️⃣ Bearish Breakdown (Primary Scenario)
If gold loses 4,000$, expect momentum to accelerate into:
3,945$
3,876$
This remains the most probable path while price holds below 4,053$.
2️⃣ Liquidity Sweep → Short-Covering Bounce
If price sweeps 3,945$ and forms bullish rejection wicks:
A relief bounce could develop back toward 4,000$,
Then 4,053$ (POC)
And possibly 4,098$ if buyers gain traction.
Still a corrective move unless bulls reclaim the upper structure.
❌ Invalidation (Bearish Bias Weakens)
H4 acceptance above 4,098$
→ would shift the narrative and force a reassessment of trend direction.
⚜️ MMFLOW TRADING Insight
Gold is still trading below value and below the trendline — this is not a bullish environment yet.
The market must either break 4,000$ or reclaim 4,053$–4,098$ before any stronger directional conviction returns.
“Let the market show its hand. In a downtrend, weak rallies are opportunities — not reversals.”

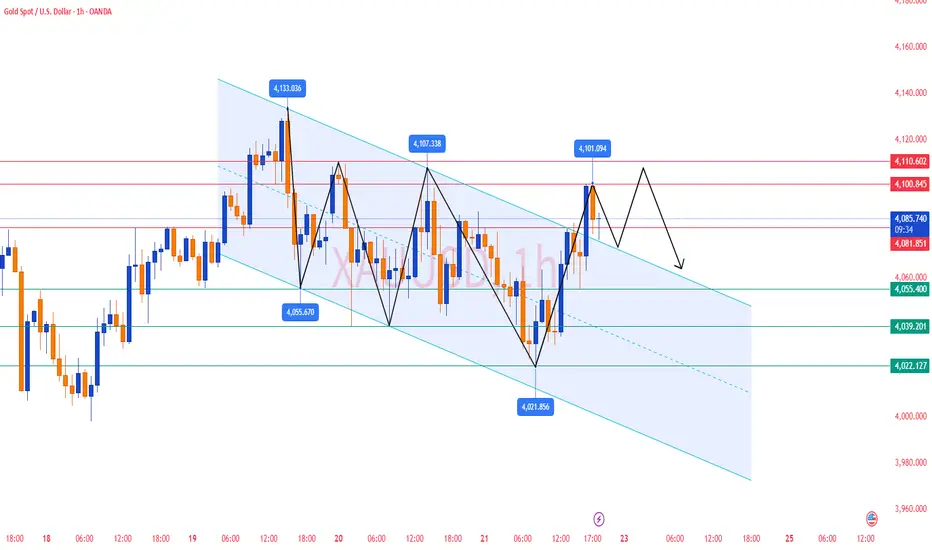
Gold Analysis and Trading Strategy | November 21-22✅From the 4-hour timeframe, gold rebounded strongly to 4101 (previous high + Bollinger upper band + MA20 resistance) and then quickly fell back to the 4080 area, indicating that selling pressure at higher levels remains very strong.
1️⃣ Moving averages remain bearish
MA5 and MA10 have turned upward slightly, but overall still remain below MA20.
MA20 (around 4155) acts as strong resistance, and the failure to break above shows the rebound is still a weak corrective move, not a trend reversal.
2️⃣ Bollinger Bands remain weak
Price continues to trade near the Bollinger mid-band (around 4071) and has failed multiple times to break the upper band.
The Bollinger Bands have not expanded upward, indicating the market is still in a weak, range-bound structure.
3️⃣ Clear rejection signal
A long upper wick formed at 4101 — a classic “spike and reversal” pattern.
Bears aggressively sold at resistance, forming a clear short-term top.
📌 H4 Conclusion:
Rebound met resistance, the market remains in a weak corrective phase, and no bullish reversal structure has formed.
✅ On the 1-hour timeframe, gold rebounded strongly from 4022 → 4101, but still failed to break through key resistance.
1️⃣ Rebound failure at 4101 → structure shifts to consolidation
After touching 4101, gold quickly pulled back to the 4080 area, showing weakening bullish momentum.
This level corresponds to previous highs + Bollinger upper band resistance, making a breakout difficult.
2️⃣ Moving averages continue to suppress
MA10 / MA20 / MA60 remain in a bearish configuration; the H1 structure has not turned bullish.
Although 4080 provides support, rebound highs are gradually decreasing, signaling fading momentum.
3️⃣ Short-term rebound strength is limited
The most recent rebound only reached MA10 and failed to regain key levels.
This confirms the bounce is a weak correction, not a structural trend change.
📌 H1 Conclusion:
Short-term spike faded, structure remains weak, and rebound is unlikely to break above the 4100–4110 strong resistance zone.
🔴 Resistance Levels
4100–4110 (major resistance zone: previous high + MAs + Bollinger upper band)
4132
4155
🟢 Support Levels
4075–4070
4044–4038
4022
3997
✅If you would like to receive real-time trading signals and professional guidance, you are welcome to join our membership. We provide comprehensive services including account risk management, position control, and strategy adjustments to help you achieve stable and consistent profits in the market🤝
✅ Trading Strategy Suggestions (Key Focus Today)
🔰 Strategy 1: Sell the Rebound (Primary Strategy)
If gold rebounds to 4095–4105 and faces rejection:
✔️ Light short positions
❌ Stop-loss: 4118 (exit immediately if price breaks above 4110)
🎯 Targets: 4075 / 4055 / 4040
👉 Reason: 4100–4110 is extremely strong resistance with low probability of a breakout.
🔰 Strategy 2: Short After a Failed Breakout
If price makes a false breakout above 4110 but fails to hold:
✔️ Enter short immediately
🎯 Same targets as above
⚠️ A long upper wick is a bearish signal.
🔰 Strategy 3: Trend-Following Short on Breakdown
If gold breaks 4038–4044:
✔️ Follow with breakout shorts
🎯 Targets: 4022 / 4008 / 3997
👉 This zone is the key dividing line; breaking it gives full control to the bears.
🔥Trading Reminder: Trading strategies are time-sensitive, and market conditions can change rapidly. Please adjust your trading plan based on real-time market conditions.
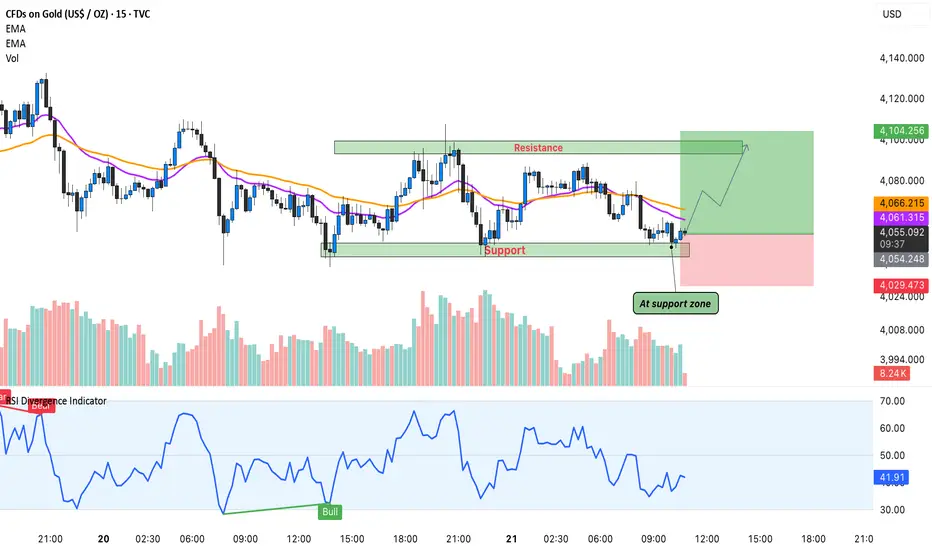
Gold’s Intraday Reversal – Buyers Stepping In!Hello Guy's Let's analyse Gold and it is once again respected the intraday support zone highlighted on the chart. This level has acted as a strong demand area multiple times, and today price reacted from the same zone with clear bullish intent.
Price is also sitting above EMA 20 & EMA 50, and the RSI bullish divergence confirms that momentum could be shifting back toward the upside.
If buyers hold this support, we can see a short-term push toward the 4,090–4,105 resistance region. A clean breakout above that may open more upside, but for now the focus remains on this bounce setup.
This is not breakout trading, this is simply reacting to a level where buyers have shown strength many times.
As long as this support holds, the risk-reward favors the bullish side.
Analysis By @TraderRahulPal | More analysis & educational content on my profile.
XAU/USD Near Breakdown – Bears Eying Liquidity SweepGold remains under pressure after a stronger-than-expected NFP print reduced near-term Fed rate-cut expectations.
The USD stays moderately supported, while weak risk sentiment keeps gold in a cautious, defensive phase.
📊 Technical Snapshot (H1–M30)
Price continues to reject the descending trendline and the supply zone 4,054–4,078.
Lower highs structure intact → bearish momentum remains dominant.
Liquidity pockets sit at 4,013 and especially 3,989, a key downside magnet.
Any pullback toward 4,054 is likely just a retest before continuation lower.
🎯 MMF Intraday Plan
Primary Bias: SELL – follow the trend
Sell 4,054–4,078
SL: 4,090
TP: 4,013 → 3,989 → 3,975
Countertrend BUY (only at deep liquidity):
Buy 3,985–3,990
SL: 3,972
TP: 4,013 → 4,054
⚡️ MMF View
As long as price stays below the trendline and lower-high structure, gold remains in distribution.
A sweep of the 3,99x liquidity zone is highly likely before any meaningful reversal can form.
