Gabling in Gold?
Technical View:
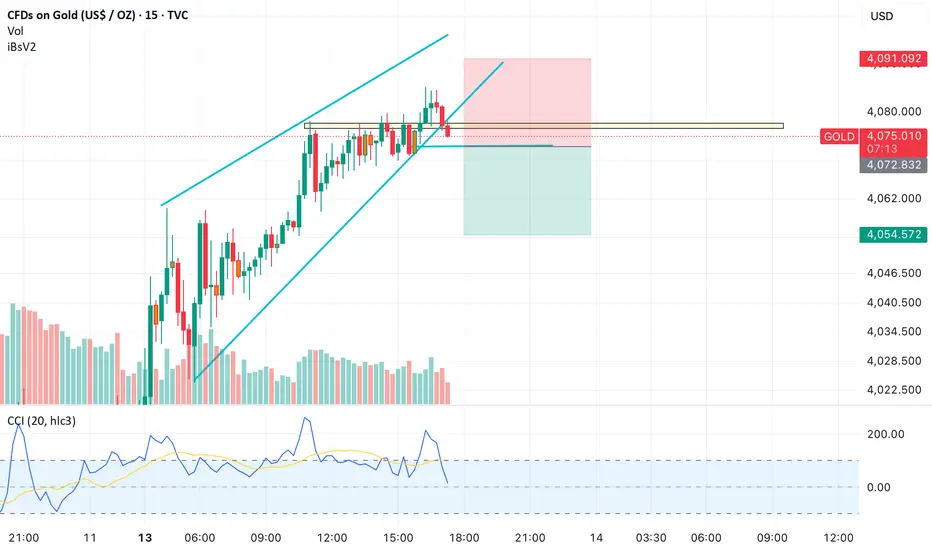
Gold has been moving within a rising channel, but the recent rejection from the upper boundary near $4,078 indicates potential exhaustion. The price has now broken below the immediate channel support, signaling the start of a corrective phase.
The CCI indicator has rolled over from the overbought zone, confirming loss of upward momentum. Volume analysis suggests weakening buying interest on each successive rally.
This structure favors a short-term pullback if $4,072 breaks decisively.
Macro View:
Broader macro sentiment remains mildly negative for gold in the near term:
• US Dollar Index (DXY) has regained strength, supported by higher US Treasury yields ahead of key inflation and retail sales data this week.
• Market expectations of an extended Fed pause are giving way to speculation of a “higher-for-longer” stance, keeping real yields positive — a headwind for non-yielding assets like gold.
• ETF inflows remain tepid, suggesting institutional money is cautious at current high levels.
• Additionally, oil price stability and easing geopolitical risk premium have reduced safe-haven demand for gold.
Together, these factors point to limited near-term upside for bullion.
Trade Setup:
• Action: Initiate short positions below $4,072 only on breakdown confirmation.
• Stop Loss: $4,091 (closing basis)
• Target 1: $4,055
• Target 2: $4,030
• Extended Target: $4,000
Execution Note:
The trade will be executed strictly as per the chart levels. It is possible that the entry level may not trigger today, in which case the setup becomes invalid and should be re-evaluated. No trade should be taken without price confirmation below $4,072.
Note:
Gold remains technically stretched, and the pattern breakdown aligns with a consolidative phase in global commodities. Short-term sentiment is tilting bearish unless the metal sustains above $4,091 on volume-backed strength.
Trade ideas
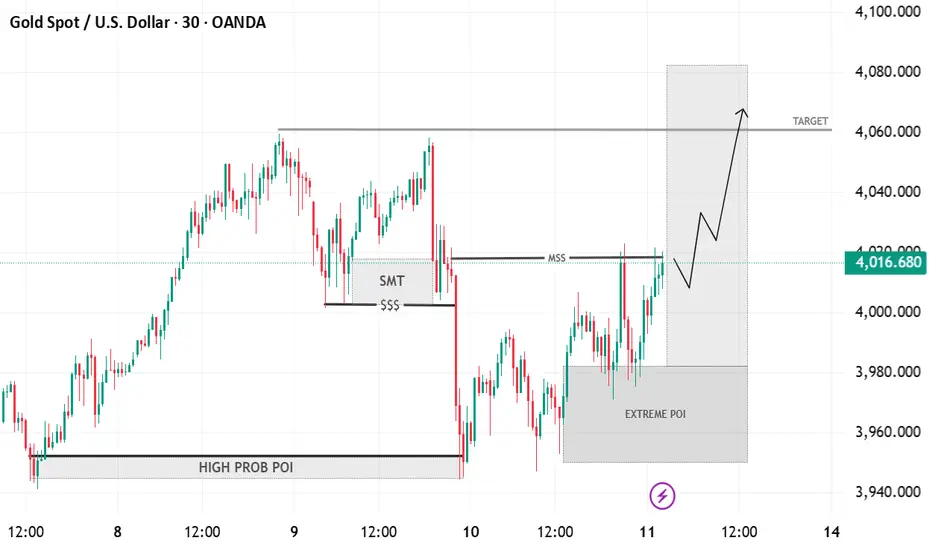
Gold–Bullish Reversal Setup from Extreme POI Toward 4060 TargetTimeframe: 30-minute chart (XAU/USD – Gold Spot vs U.S. Dollar)
Market Structure:
Price made a structural low (SMT) around the $$$ liquidity zone.
A Market Structure Shift (MSS) occurred as price broke above short-term highs.
POI (Point of Interest) Zones:
High Probability POI: Previous accumulation zone that caused a bullish impulse.
Extreme POI: Current demand zone (around 3960–3980), where price is rebounding.
Current Price Action:
Price has reacted bullishly from the Extreme POI.
The breakout above MSS signals possible continuation to the upside.
Target Zone:
The shaded grey target area (~4060–4080) aligns with previous liquidity highs.
Bias:
Bullish short-term bias toward 4060–4080 zone, assuming the demand zone holds.
Break below Extreme POI would invalidate the setup and suggest deeper retracement.
WAVE 5Spotting strong bullish momentum — price holding above key support with rising volume and RSI confirmation. Looking for continuation toward next resistance zone.

XAU/USD: GOLD HITS NEW ATH! Buy or Sell Now?Gold (XAU/USD) is absolutely on fire, hitting a Fresh All-Time High (ATH) this morning! This massive breakout isn't random; it's a direct outcome of global risk factors lining up, making gold the ultimate safe haven:
🇺🇸🇨🇳 Trade War Reloaded: Trump's shocking 100% tariff threat on China exports has brought back major global uncertainty. Though he's softened his tone, the damage to sentiment is done, pushing money into gold.
⚠️ Geopolitical Heat: Warnings about sending Tomahawk missiles to Ukraine keep geopolitical tensions brewing, acting as a continuous tailwind for the metal.
🏛️ US Shutdown Drama: The ongoing US government funding deadlock is a big worry, further driving flight-to-safety flows.
✂️ Fed Rate Cut Confidence: High probability of Fed rate cuts in Oct/Dec (96%/87%) provides strong support, reducing the opportunity cost of holding non-yielding gold.
🔍 TECHNICAL ANALYSIS: Structure is Full-On BULLISH!
The price action today is textbook, showing exactly how Smart Money operates:
Liquidity Sweep & FVG: Price first wicked sharply below 4000 for a classic Liquidity Sweep—hunting weak hands' Stop-Losses—and created a temporary Fair Value Gap (FVG), before reversing with massive momentum.
Structural Break (BOS & MSS): This aggressive move resulted in a clean Break of Structure (BOS) above the old ATH at 405x, confirming a major Market Structure Shift (MSS). The trend is now unequivocally BULLISH.
Trading Plan - The Right Way:
Priority: Stick with BUY positions! The bias remains bullish as long as price holds above the Order Block (OB) support at 405x. This is the key level.
Big Warning: Don't try to short the top (sell dò đỉnh)! The risk of getting caught in a liquidity grab or price trap at these highs is extremely high. Stay away from counter-trend moves.
Sell Scenario (Only if): We only consider a short-term SELL if there's a strong, confirmed candle close below 405x. In that case, we might target a minor pullback to 4000 for profit booking, but the main goal remains to BUY on dips.
👉 Bottom Line: Fundamentals and technicals are singing the same tune. 405x is the line in the sand. Trade carefully, manage your stop-loss, and always do your own research (DYOR).
#GOLD #XAUUSD #ATH #MarketUpdate #TradeWar #FED #SmartMoney #ICT #TechnicalAnalysis #SafeHaven #DYOR

Part 1 Intraday Master ClassIntroduction to Option Trading
Option trading is one of the most dynamic, flexible, and powerful financial instruments in the modern market. It allows investors not only to profit from price movements but also to protect their portfolios, speculate, or earn regular income. Unlike buying stocks directly, options give traders the right but not the obligation to buy or sell an underlying asset (like a stock, index, or commodity) at a predetermined price within a certain time frame.

XAUUSD HIT MY STOP LOSSGold just broke above our previous OB/Liquidity resistance around 4040–4055, taking out the short-side liquidity and confirming a bullish market structure shift (MSB) on 15M and 1H timeframes.
🔹 Previous plan: Sell-limit at resistance — invalidated as price made a new high.
🔹 Current bias: Bullish continuation towards 4078 → 4095 → 4120.
🔹 Pullback zones to watch:
• 4035–4045 (OB retest / liquidity grab area)
• 4005–4020 (golden pocket confluence)
🧠 Trading Plan:
Wait for price to retrace into key support zones.
Look for bullish rejection / confirmation before entering long.
First TP near 4078, extended targets 4095+
SL below 4020 zone (structure invalidation).
💬 Price action respected structure beautifully. Remember — the market doesn’t care about our limits, only about liquidity.
Trade what’s visible, not what’s emotional.
#XAUUSD #GoldForecast #ForexTrader #SmartMoneyConcepts #LuxAlgo #OrderBlockTrading #LiquiditySweep #PriceAction #GoldAnalysis #TradingStrategy #TechnicalAnalysis #ForexSetup #DayTrading #ChartAnalysis #TradingView #alphatechfinances

Sniping the Next BUY Zone for Maximum Gains.The sentiment is clear: Bulls are running the show, preparing for potentially an eighth consecutive weekly gain. Our strategy is simple—wait for the intelligent retest to join the momentum.
🎯 THE TARGET ZONES (M30/H1)
We're focusing on the two most crucial zones derived from Fibo React Logic:
1. PRIME BUY ENTRY (The Sweet Spot):
Zone: 4018 - 4014 (Our key Fibo Retest Zone).
Action: Wait for Gold to pull back to this area. Execute a BUY (Long) only upon confirmed M30/H1 candle rejection (e.g., Bullish Engulfing/Pin Bar).
2. TAKE PROFIT TARGET (The Next Peak):
Zone: 4094 - 4098 (Fibo Extension/SELL React Zone).
Action: This is the primary TP for our Long entries, representing the next major target for the buyers.
📈 TRADING SCENARIO
Strategy: Patience is key. Let the market retrace to 4018 - 4014. Once confirmation hits, ride the wave up to 4094 - 4098.
🚨 Risk Alert:
Be disciplined with your Stop Loss. Maintain strict risk management, especially if the price fails to hold the 4018 - 4014 zone.
Let's trade with precision today!

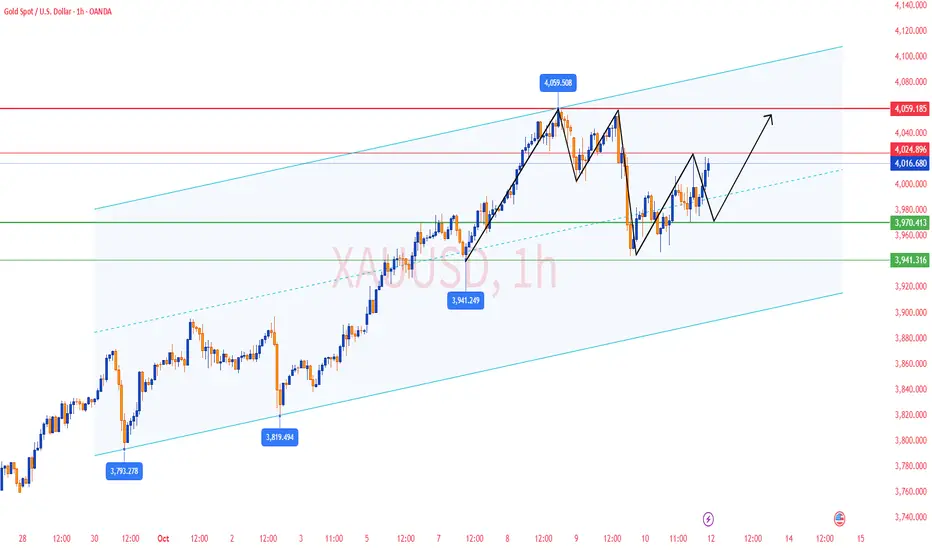
LiamTrading – GOLD: Continuing the trend towards 4,130Gold has broken 4,060 and set a new historical peak thanks to the US-China trade tensions and the expectation of an early Fed rate cut. The main trend remains upward; the next target level according to the channel structure is 4,130.
Technical H4→H1
The upward channel has been maintained for several weeks; breaking 4,060 confirms continuation.
Nearest liquidity zone: 4,030–4,032.
Medium-term volume POC: ~3,988.
Target/resistance clusters by rhythm: 4,050 → 4,072 → 4,088 → 4,100 → 4,130.
Trading Plan
Buy 1 (retracing to the liquidity zone)
Entry: 4,030–4,032
SL: 4,025
TP: 4,050 → 4,072 → 4,088 → 4,100 → 4,130
Buy 2 (medium-term POC)
Entry: 3,988
SL: 3,980
TP: 4,022 → 4,050 → 4,088 → 4,100 → 4,130
Sell reaction (higher risk)
Entry: 4,130
SL: 4,140
TP: flexible according to price reaction; prioritize closing at 4,070 if a clear rejection candle appears.
Invalidation: short-term upward structure weakens if H1 closes below 3,980.
Quick Notes
Prioritize “buy-the-dip” at 4,03x and 3,988; sell orders are only reaction trades at 4,130.
When TP1 is reached, move SL to entry to protect the position.
Volatility around US data release times may create false breaks; maintain disciplined risk management.
I will provide immediate updates as price paths change, real-time trading is the best way to be accurate and successful.

XAUUSD – Safe-Haven Demand Keeps Gold StrongMarket Overview:
Gold stays firm as fresh US–China trade tensions and ongoing geopolitical concerns push investors toward safe assets.
Expectations of another Fed rate cut are putting pressure on the USD, giving extra strength to gold.
Even though short-term indicators show some overbought signs, overall sentiment still favours the bulls.
Near-Term Outlook:
As long as price remains inside the rising channel, we expect a possible move toward the 4,090–4,100 liquidity zone.
A rejection from 4,092–4,095 could lead to a short-term pullback before continuation.
Important Levels:
Liquidity Buy Zone 1: 4,039 – 4,037
Liquidity Buy Zone 2: 4,017 – 4,015
Liquidity Sell Zone: 4,092 – 4,095
Support: 4,010 – 4,000
Resistance: 4,110 – 4,126
Trading Plan:
🔹 Buy Setup #1
Entry: 4,039 – 4,037
Stop Loss: 4,032
Targets: 4,044 → 4,048 → 4,052 → 4,056 → 4,060 → 4,070
🔹 Buy Setup #2
Entry: 4,017 – 4,015
Stop Loss: 4,010
Targets: 4,022 → 4,026 → 4,030 → 4,040 → 4,050 → 4,060
🔹 Sell Setup (Scalp Opportunity)
Entry: 4,092 – 4,095
Stop Loss: 4,100
Targets: 4,090 → 4,085 → 4,080 → 4,070 → 4,060
Summary:
Bias stays bullish while gold holds above 4,015 – 4,020.
Safe-haven demand and softer USD outlook continue to support the upside move.
Look out for a liquidity sweep around 4,092 before further continuation upward.
📊 What do you think — will gold break higher or reject from 4,090?
👉 Follow MMFLOW TRADING for daily market structure updates and precise trade plans.
🟣 Chart: XAUUSD H1 – Smart Money Flow structure highlighting liquidity areas and OB zones.

Elliott Wave Analysis – XAUUSD (13/10/2025)
________________________________________
🔹 1. Overview
In the previous plan, I predicted an upward correction after a panic sell-off, which was identified by an unusually extended blue wave C on H1.
________________________________________
🔹 2. Momentum
D1 Momentum is currently reversing downward, however, since price and momentum are diverging, the bullish pressure remains strong.
H4 Momentum has now entered the overbought zone, so within the next 1–2 H4 candles, a corrective decline may occur.
H1 Momentum is currently falling, while price is moving sideways, so we should continue observing this zone carefully.
________________________________________
🔹 3. Wave Structure
D1 Chart:
• Price is still within the yellow wave 5.
• Although D1 momentum is declining, the extended wave 5 structure suggests that once a correction begins, the first drop will likely be steep and deep.
• The divergence between D1 candles and D1 momentum only signals weakening bullish strength, not yet a confirmed reversal.
H4 Chart:
• Price is currently moving along the upper boundary of the channel.
• Earlier, a blue ABC structure completed, and now price is forming three consecutive peaks near the previous high.
• This setup hints at a WXY pattern, where wave Y may develop as either:
1️⃣ A Flat (5-wave) pattern, or
2️⃣ A Triangle.
H1 Chart:
• A blue ABC correction has been completed, followed by a rally back to the previous top.
• Price is now moving sideways around this zone.
• Given that the ABC correction is done, there are two possible outcomes:
o (1) The correction is complete, and price is now in a 5-wave impulsive rally, meaning further upside.
o (2) The correction is still developing, and price may continue to drop as described in the H4 scenarios.
________________________________________
🔹 4. Additional Notes
• The current wave structure shows significant overlap, and given the previous panic sell, this slow recovery makes sense — it likely represents a leading diagonal (wave 1 triangle).
• In such a case, once price breaks out of the channel, it should accelerate sharply into a strong wave 3.
• However, since price remains sideways, this scenario may instead represent wave X of a continuing correction.
⚠️ Important:
Unlike the Friday Buy setup, which had strong confluence, the current scenario presents two conflicting possibilities, so the probability is not high.
________________________________________
🔹 5. Trade Plan
Sell Setup (Short-Term):
• Sell Stop: 4040
• SL: 4058
• TP1: 4010
Risk Management:
If price rises strongly above, confirming wave 3 behavior, then cancel the Sell setup.
As mentioned, this signal has lower probability and a relatively wide stop, so it’s better to either observe or enter with a small position size.

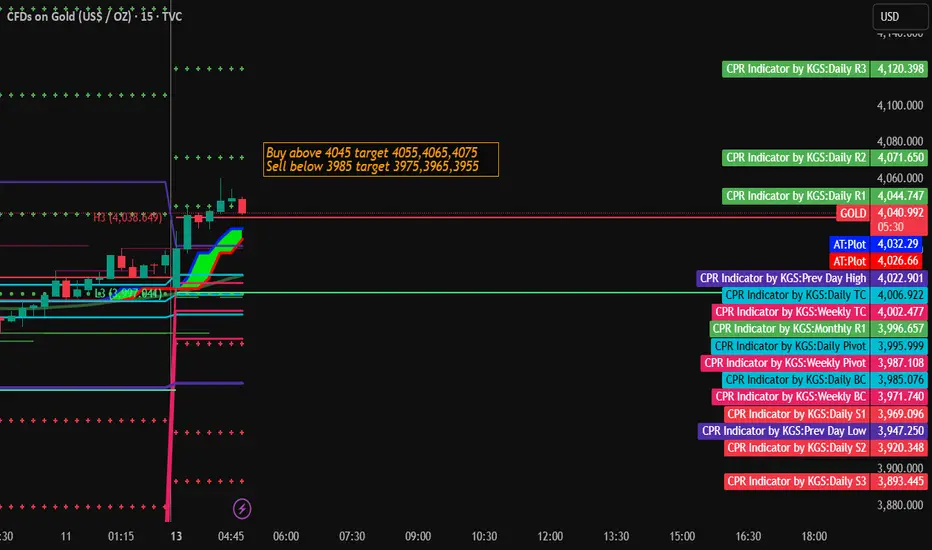
Gold Trading Strategy for 13th October 2025📊 TVC:GOLD Intraday Trading Plan
🟢 Buy Setup:
➡️ Buy Above: High of the 1-hour candle that closes above $4045
🎯 Targets:
1️⃣ $4055
2️⃣ $4065
3️⃣ $4075
🔴 Sell Setup:
➡️ Sell Below: Low of the 1-hour candle that closes below $3985
🎯 Targets:
1️⃣ $3975
2️⃣ $3965
3️⃣ $3955
⚙️ Strategy Notes:
Wait for 1-hour candle close confirmation before taking entry.
Maintain strict stop loss based on your risk appetite.
Avoid trading during high volatility news events.
⚠️ Disclaimer:
This analysis is for educational and informational purposes only. It does not constitute financial advice or a recommendation to buy or sell any security. Trading involves risk; please do your own research or consult a qualified financial advisor before making any trading decisions.
Gold Trading Strategy for Next Week✅ Gold has recorded eight consecutive bullish weekly closes, indicating that bullish momentum continues to dominate the market. From the weekly structure perspective, the trend remains strong, and the short-term outlook stays bullish.
✅ On Friday, gold rebounded after a second dip failed to make a new low, reaching as high as 4022 in the evening and closing with a long lower shadow bullish candle, showing strong buying support below.
If the rebound continues early next week, the price could extend higher; however, if a second rally fails to break a new high, gold may face short-term pressure and enter a sideways consolidation phase before launching another upward move.
✅ If the price fails to break above 4059, gold will likely remain in a high-level consolidation range — no need to be overly bearish.
But if it reclaims 4059 decisively, the market could resume its upward trend, with an additional upside potential of 50–100 dollars.
✅ In its latest report, Goldman Sachs raised its gold target from $4,300 to $4,900, reflecting the institution’s strong medium-to-long-term bullish outlook.
As long as there are no clear signs of a trend reversal, the overall strategy should remain “buy on dips.”
🔴 Resistance Levels: 4025–4030 / 4040–4059
🟢 Support Levels: 3970–3975 / 3944–3884
✅ Trading Strategy Reference:
Based on both technical and fundamental analysis, the key focus next week will be the 3970 support area.
🔰 If gold pulls back and stabilizes around 3970, it will likely mark the end of the short-term correction, and the price may resume an upward consolidation pattern.
🔰 If gold breaks below 3970, attention should shift to the 3944–3884 defensive support zone.
As long as the price holds above 3970, the short-term structure remains bullish, with potential for another test of the recent highs.
🔥Trading Reminder: Trading strategies are time-sensitive, and market conditions can change rapidly. Please adjust your trading plan based on real-time market conditions.
XAUUSD / GOLD 1H BUY PROJECTION – 12.10.25The 1H structure is showing a clean breakout and retest, indicating strong bullish continuation.
✅ Technical Breakdown:
Price broke above the resistance zone and retested the breakout level, confirming support at $4,007–$4,012.
Fibonacci 0.618 Golden Ratio aligned with the support adds confluence for a long setup.
An upward trendline is being respected, signaling controlled bullish structure.
A fair value gap remains unfilled below, but since it’s in the order block zone, it’s less likely to break for a sell.
Strong bullish momentum candles indicate buyers in control.
🎯 Targets:
TP1: $4,030 (Resistance R1)
TP2: $4,050 (Resistance R2 / ATH Zone)
🛡️ Invalidation:
A clean break below $3,996 (order block zone) would weaken this bullish projection.
📈 Summary:
Entry: $4,007–$4,012 zone after retest
TP1: $4,030
TP2: $4,050
SL: Below $3,996
Bias: Bullish
Timeframe: 1H
⚠️ Always use proper risk management and follow the trend structure.

XAUUSD / GOLD WEEKLY BUY PROJECTION – 12.10.25The market is currently showing strong bullish momentum after a clean V-shaped reversal from the support zone around $3,960–$3,980.
✅ Key Technical Highlights:
Support S2 Zone held well, forming a reversal V pattern, confirming buyers stepping in.
Price has broken and retested the breakout zone around $4,000, indicating buying strength.
A bullish momentum candle confirms continuation towards higher levels.
Fibonacci 0.5–0.618 retracement zone aligned perfectly with the support, giving more confluence for long entries.
If momentum sustains, price is projected to push towards:
📍 Resistance R1: $4,060 zone (first TP)
📍 Resistance R2 / New ATH Zone: $4,120 zone (final TP)
🛡️ Invalidation:
A clean break below the $3,960 support and the fair value gap would signal weakening momentum and cancel the bullish outlook.
📈 Summary:
Entry: After retest of breakout zone ($4,000–$4,010)
TP1: $4,060
TP2: $4,120
SL: Below $3,960 (Fair value gap)
🚀 Bias: Bullish
📅 Timeframe: 4H / Weekly
⚠️ Note: Always manage risk with proper position sizing and SL discipline

What if we are about to see some historical event!If Powell increased a sudden rate hike! We will see some historical event like 1980!
Just be aware of this!
$4024 Gold: 8-Week Jhakaas Record! BUY Pivot $398x!Hello, traders!
Gold just wrapped up an impressive 8-week winning streak, closing the session at $4,024.40/oz (Futures). This bada (big) rally was immediately triggered by President Trump's unexpected tariff threat on China, which, boss, fueled a massive rush toward safe-haven assets.
Fundamentals & Technical Bias: Buying the Pivot
Core Drivers: Escalating trade panga (conflict) thanks to Trump, steady Fed rate cut expectations, and ongoing global gadbadi (instability) are all making Gold the top safe haven.
Technical Recovery: After a deep correction to $394x, Gold recovered super fast and closed firmly above $399x. This confirms that buying power is dominant and the bullish momentum is pakka (confirmed).
Priority Bias: BUY (Long). $398x is the critical short-term pivot point. Risk management is key, remember that.
Risk Warning: Only switch to SELL (Short) if the price rapidly breaks below $398x due to major negative news.
Key Price Levels:
Resistance: $4064, $4084, $4104, $4124
Support: $3984, $3951, $3934
Trading Strategy (Prioritize BUY at the Pivot)
BUY ZONE (Pivot $398x): $3984 - $3982
SL: $3974
TPs: $3992, $4002, $4012, $4022, $4032
SELL ZONE (Counter-Trend): $4024 - $4026
SL: $4034
TPs: $4016, $4006, $3996, $3986, $3976
Will this trade war tension take Gold past $4100 next week? Kya lagta hai? 👇
#Gold #XAUUSD #4KGold #TrumpTariffs #8WeeksUp #Pivot #TradingView #PaisaBanega

Gold Xauusd uptrend will continue on tarrif uncertainty rate cutGold XAUUSD uptrend will continue on tarrif uncertainty and rate cut bets .
Updated levels given on chart for next week
How My Harmonic pattern projection Indicator work is explained below :
Recent High or Low :
D-0% is our recent low or high
Profit booking zone ( Early / Risky entry) : D 13.2% -D 16.1 % is
range if break them profit booking start on uptrend or downtrend but only profit booking, trend not changed
SL reversal zone (Safe entry ) : SL 23.1% and SL 25.5% is reversal zone if break then trend reverse and we can take reverse trade
Target : T1, T2, T3, T4 and .
Are our Target zone
Any Upside or downside level will activate only if break 1st level then 2nd will be active if break 2nd then 3rd will be active.
Total we have 7 important level which are support and resistance area
Until , 16% not break uptrend will continue if break then profit booking will start.
If break 25% then fresh downtrend will start then T1, T2,T3 will activate
1,3,5,10,15,20 minutes are short term levels.
30 minutes 60 minutes , 2 hours,3 hours, ... 1 day and 1 week chart positional and long term levels

XAUUSD GOLD 15 MINTUS ANANLYSIS BULLISH OUTLOOK 📊 Technical Analysis:
1. Pattern Identification
Double Bottom Formation:
Found near the support area — indicates a reversal from bearish to bullish.
Price bounced twice from the same zone, showing strong buyer activity.
Breakout Confirmation:
After forming the double bottom, the price broke above the neckline/trendline, confirming a bullish reversal.
Upward Channel:
The price movement after breakout is confined between parallel ascending lines, showing a controlled bullish trend.
Each dip to the lower boundary offers a buy opportunity within the channel.
Double Top Formation (Near Resistance):
This pattern forms at the top of the bullish channel, indicating a potential short-term correction or pullback before continuation.
---
💹 Key Levels:
Support Area: Around $3,960 – $3,980
Resistance Area: Around $4,040 – $4,060
Entry Point: Near $3,980 (bottom of the channel / breakout retest zone)
Target Point: Around $4,140+ (upper resistance & measured move target)
Stop Loss (Suggested): Below $3,950 (to protect from false breakouts)
---
📈 Market Sentiment:
Overall Trend: Bullish (due to breakout + double bottom confirmation)
Short-term Risk: Possible minor pullback from double top area before resuming upward.
Bias: Wait for small correction → look for bullish confirmation candle near support → enter long targeting resistance.

XAUUSD GOLD BULLISH NOW 4028📈 XAU/USD (Gold) Trade Alert ✨
Gold (XAU/USD) is showing strong bullish momentum, presenting an excellent buy opportunity at the entry point of 4028. The support level at 4001 provides a solid foundation for this upward move, indicating potential strength in price action. Our target point is set at 4100, offering an attractive risk-to-reward setup for traders. Keep an eye on the resistance area around 4060, as a breakout above this zone could confirm continued bullish momentum. Manage your positions wisely and follow price action closely for optimal results.

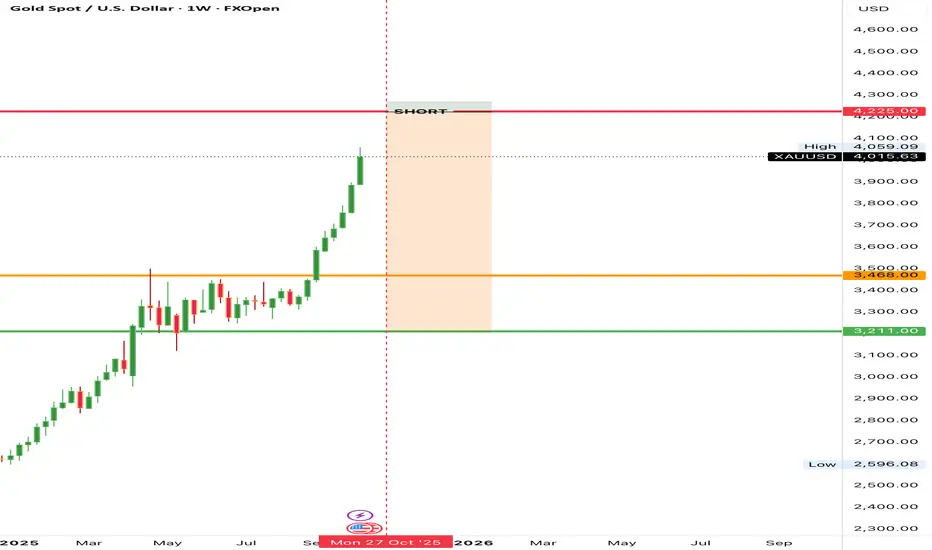
LiamTrading – GOLD: Risk of ABC Correction Wave..LiamTrading – GOLD: Risk of ABC Correction Wave, Short-term Sell at 4028
Hello traders,
Gold has had an impressive growth week, but as prices hit new highs, the risk of correction always increases. Let's examine this week's Gold scenario based on wave analysis and market liquidity.
📊 Technical Analysis (Chart H4 – XAUUSD)
Based on the H4 chart, Gold (GOLD) seems to have completed the Push Wave 5 (Elliott Wave 5) in the current uptrend cycle, reaching strong resistance around 4050–4060.
Current Structure:
The price is within a sustainable Uptrend Channel.
The 4050–4060 range is a significant resistance where selling pressure may emerge.
An ABC correction wave scenario appears after completing Wave 5.
Key Liquidity Zones:
Potential Resistance Zone (Sell Wave C): Around 4028–4033 (Price area to watch for the reaction of the final Wave C).
Confirmed Drop Support Zone: 3972 (Critical price area confirming if selling pressure is strong enough).
Attractive Buy Zone: 3976 (Temporary liquidity if price corrects, waiting for Breakout confirmation).
Long-term Buy Zone (POC Buy): ~3850 (Price area with a huge Volume Profile, ideal for long-term buy orders).
🎯 New Week Trading Scenario
📉 Short-term Sell
This scenario is based on the expectation of an ABC correction wave starting from the resistance zone.
📍 Entry: 4033
🛑 SL: 4040 (Very tight SL, suitable for short-term Sell strategy at the wave peak)
🎯 TP: 3976 → 3943 → POC (~3850)
📈 Long-term Buy
This setup waits for a correction to lower liquidity zones to enter Buy orders with optimal R:R ratio.
📍 Entry: 3976 (Temporary liquidity buy zone)
🛑 SL: 3970
🎯 TP: 4040 → 4090 → 4150
🛑 Failure Scenario (Wait for Breakout Confirmation)
If the price breaks the 4060 peak and creates a new ATH (All-Time High), the ABC wave scenario will fail.
Action: Continue to prioritize Buying. The best entry is to wait for the price to retest the broken liquidity zone (Breakout Retest) around 3976.
🧭 Fundamental & Long-term Analysis
Macroeconomic Sentiment: The Royal Bank of Canada (RBC) forecasts Gold to rise to $4,500 in the next two years, bolstered by long-term inflation concerns. This confirms the long-term uptrend of Gold remains intact.
US Dollar Impact (USD): The traditional view is that USD rises as investors seek liquidity during market stress. However, Gold's rise alongside USD shows the market prioritizes gold as an inflation hedge rather than just a safe haven.
Long-term Strategy: The buy zone at POC (~3850) according to Volume Profile is extremely suitable. Large liquidity here will help traders enter optimal orders and hold long-term, leveraging the pressure from the Seller's Liquidity to push prices up.
📌 Conclusion
Gold is at a critical crossroads. Although the long-term trend is up, the short-term correction risk (ABC Wave) at the 4028–4033 zone is very high.
Priority: Watch for short-term sells at the resistance zone with a tight SL.
Safe strategy: Wait to Buy at liquidity support zones like 3976 or POC (~3850) to optimize risk/reward (R:R).
I will continue to update Gold scenarios daily with insights from 8 years of trading experience.
👉 Follow me to not miss important updates!
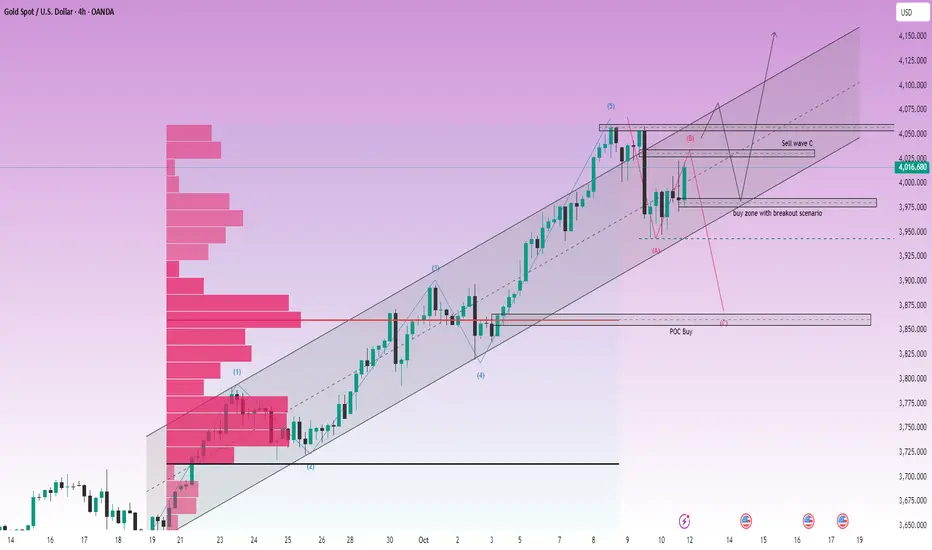
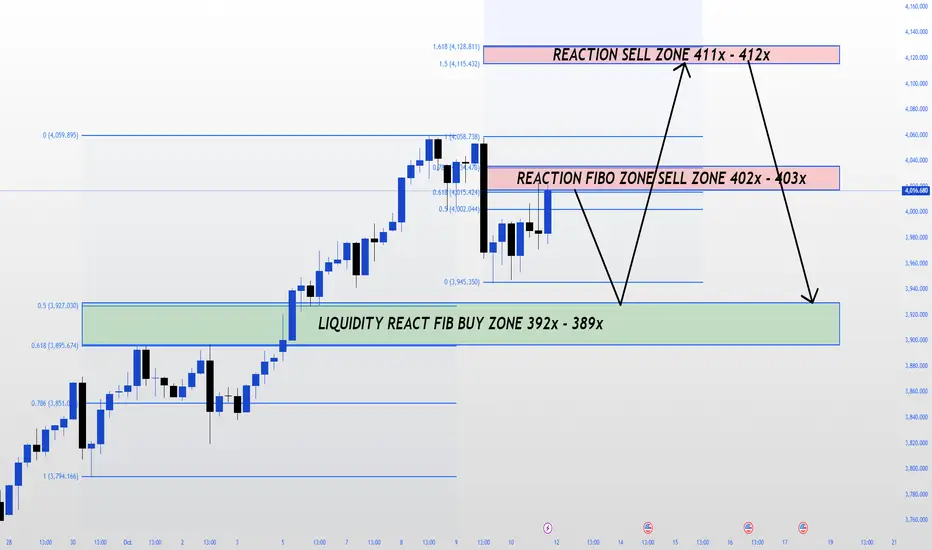
$4,000 RECLAIMED! Targeting Fibo Extremes on H4.The big picture is clear: Gold has strongly pushed past the $4,000 mark, driven by major safe-haven demand amidst US-China tensions. Buyers are pushing for an eighth straight weekly gain!
But where are the high-probability zones?
🔑 THE FRANCI$$_FIBOMATRIX PLAN (H4)
We're keying in on two critical Fibo Reaction Zones for the perfect entry:
1. SELL ZONE (Correction/Reversal Focus):
Zone 1 (FIBO): 402x - 403x (4,025.424 - 4,032.844). Action: Look for H1/H4 candle rejection here to initiate a corrective short trade.
Zone 2 (Extension): 411x - 412x (4,115.422 - 4,128.811). Action: The ultimate target if momentum holds; watch this for the major supply zone.
2. BUY ZONE (Trend Continuation):
The Sweet Spot: 392x - 389x (3,907.030 - 3,895.674). This is our key Liquidity React Fibo Buy Zone. Action: Wait for the deep pullback here, confirm with bullish signals, and join the main trend with a target back to the 402x/411x range.
🚨 Critical Risk Alert:
A decisive weekly close below $3,962 signals a high risk of deep correction towards $3,900. Manage your Longs tightly below this level!
XAUUSDLadies & Gentlemen, you all are seeing this is the chart of gold (XAUUSD). This is one of the most popular charts in the world. Everyone wants to predict.
We have started counting this cycle from the low created by Gold on 6 October 2023. We have done two cycles in it, the first cycle is of 63 trading days, and the second is its double i.e. 126 trading days.
In the shorter cycle (63 BAR), you will see that it has maximum given 10 to 18% returns till date within EVERY 90 days
It has more than doubled in the last two years.And no down train cycle has started yet. And this is nine Cycles from Small Cycle.
Do you think this cycle will continue to grow like this in the future?

13 oct my ideaI use here only 15 tf for support and resistance. Because now a days the volatility of gold is awesome. So 15 timeframe is good. Take entry based on 5 minutes.
