XAUUSD- Trend Reverse for a short term Daily It's need a little pullback back to the daily FVG
4H - We have one candle close in our Direction which is bearish
15M - Entry in a 15M FVG with a conformation of the Engulying candle
Trade ideas

Gold Neowave Bulletin| 10/10/2025
Namaskaram Everyone
Welcome to intelligent investor, we provide market insights by synchronising and combining all the price action waves from different time frames and gives you single trend.
Here are all our previous gold analysis, with this you will understand how with Neowave Theory you will have an edge in the market.
Previous Neowave Bulletin
09/12/2025
07/10/2025
01/10/2025
30/09/2025
29/09/2025
OANDA:XAUUSD FOREXCOM:XAUUSD FX:XAUUSD VANTAGE:XAUUSD MCX:GOLD1!

A strongly bullish outlook for goldThe current price is testing the 0.382 ($3,982.313) retracement level, a common support area for a Wave 4 correction.
A Fibonacci extension tool projects potential targets for the upcoming Wave 5. The key target area highlighted is near the 2.0 extension level at $4,247.340, with other potential levels noted, such as the 1.618 level at $4,140.453.
The gold is in a powerful uptrend. The recent pullback is interpreted as a temporary and normal correction (Wave 4) within this larger trend. According to this Elliott Wave count, if the price holds support around the current level (~$3,980), the expectation is for a new upward impulse (Wave 5) to begin, potentially targeting the $4,250 area. The bullish outlook is strongly supported by the signals from the Ichimoku Cloud indicator.

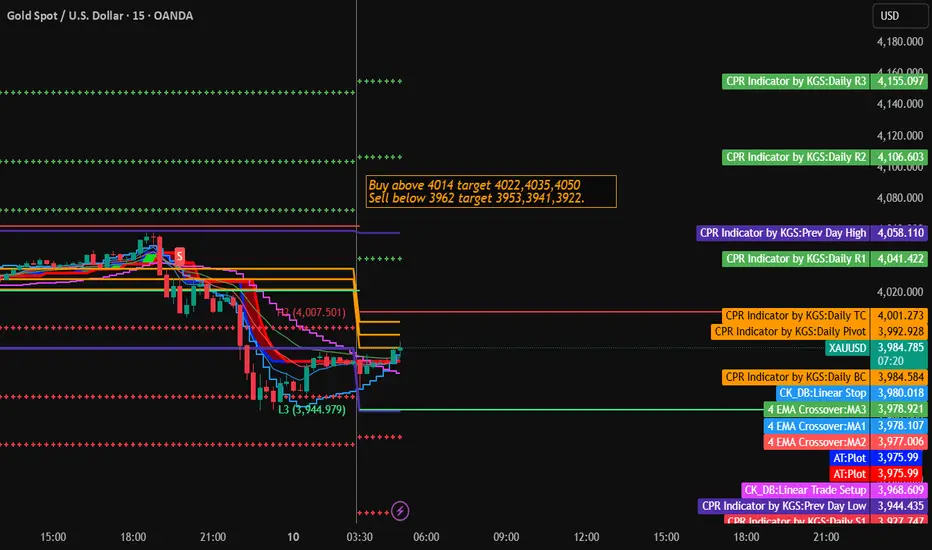
Gold Trading Strategy for 10th October 2025💰 GOLD (XAU/USD) Trading Setup
⏰ Timeframe: 1 Hour & 15 Minutes
🟢 Buy Setup
💹 Entry: Buy above the high of the 1-hour candle — once it closes above $4014
🎯 Targets:
🎯 Target 1: $4022
🎯 Target 2: $4035
🎯 Target 3: $4050
🛡️ Stop Loss: Below $4005 (adjust with risk tolerance)
📈 Trade Logic:
If the hourly candle closes above $4014, it indicates bullish strength. Look for confirmation before entering a long position. Momentum above this level could push prices towards the next resistance zones.
🔴 Sell Setup
💹 Entry: Sell below the low of the 15-minute candle — once it closes below $3962
🎯 Targets:
🎯 Target 1: $3953
🎯 Target 2: $3941
🎯 Target 3: $3922
🛡️ Stop Loss: Above $3975 (adjust with market conditions)
📉 Trade Logic:
If the 15-min candle closes below $3962, bearish momentum is likely to continue. Break below this level may open room for further downside.
⚠️ Disclaimer
📜 This analysis is for educational and informational purposes only.
💼 Not financial advice. Always conduct your own research or consult with a certified financial advisor before making any trading decisions.
📊 Trading in commodities and financial markets involves significant risk. Past performance is not indicative of future results.
Gold trading strategy | October 9-10✅Gold prices formed a double-top pattern around the 4059.2 level and the previous high, followed by a sharp decline. During the drop, the 3996 (previous support) level was broken, and the price is now consolidating around the 3950 area.
On the short-term chart, consecutive bearish candles indicate strong bearish momentum.
Key short-term support lies in the 3950–3920 zone; if this level breaks, further downside potential will open up.
✅On the 4-hour chart, the price has broken below the MA5 and MA10, quickly pulling back toward the MA20. The bullish momentum near the upper Bollinger Band has already faded, and candles have fallen directly below the mid-band, signaling a phase of correction. If the 3950 support fails, the price may test the 3920–3900 area. On the upside, resistance lies at 3996–4000, and only a sustained break above this zone would allow the bullish trend to resume.
🔴Resistance Levels: 3996–4000 / 4028–4035
🟢Support Levels: 3950–3940 / 3920–3910
✅Trading Strategy Reference:
🔰If the price rebounds but fails to break 3996–4000, short positions can be considered, targeting the 3950 area.
🔰If the price holds steady around 3950 and shows a bottoming signal, long positions can be considered, targeting the 4000 area.

Gold (XAU/USD) Rebound Setup – Support Holding Strong!Analysis:
Gold (XAU/USD) is showing signs of bullish strength after testing the $4,000–$3,970 support zone, where buyers are stepping back in. The recent consolidation above support suggests a potential reversal and continuation of the uptrend.
The setup highlights:
Support Zone: Around $3,970 – $4,000, acting as a key accumulation area.
Bullish Trigger: A breakout above minor resistance could drive momentum higher.
Targets:
🎯 Target 1: $4,101
🎯 Target 2: $4,150
🎯 Target 3: $4,200
Stop Loss: Below $3,970 to protect against a downside breakout.
📈 Outlook: As long as price sustains above support, Gold remains bullish, aiming for a breakout towards $4,150 and $4,200 levels.

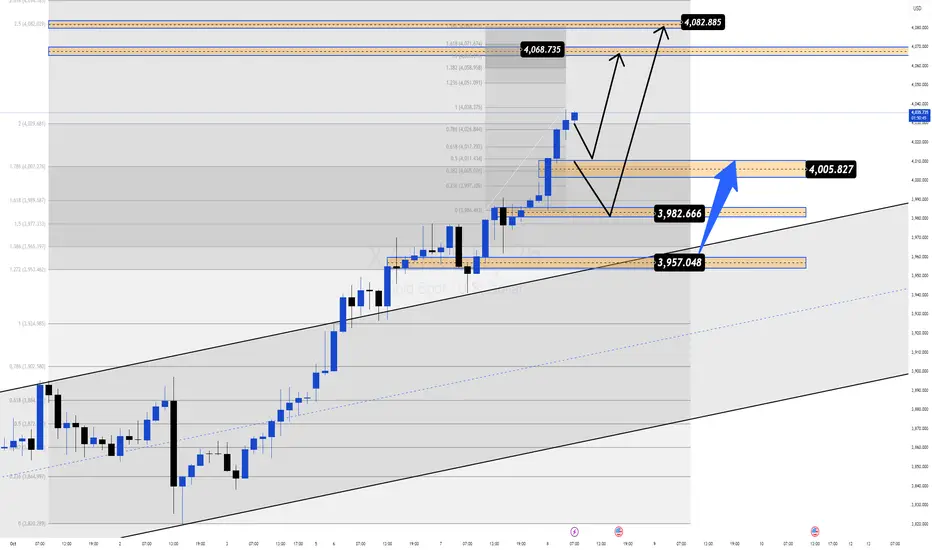
XAUUSD| Unstoppable Uptrend, Gold Benefits from Fed & ETF Inflow📊 Market Context
Gold continues to maintain its upward trend amidst the political and economic instability in the US. The US government has entered its second week of shutdown with no signs of reaching an agreement, raising further concerns about the impact on economic performance.
Simultaneously, the Fed's entry into a monetary easing cycle since September, with expectations of further 25-point rate cuts in October and December, is driving strong buying momentum in gold.
Not just investors, but global central banks are also continuing to accumulate gold, adding 15 tonnes to reserves, indicating a gradual shift away from US public debt.
All these factors combined continue to reinforce a sustainable upward trend, opening up opportunities for strategic BUY moves.
🔎 Technical Analysis (H1/H4)
Prices remain within the upward channel, continuously retesting and bouncing off support zones.
Buy Scalp Zone 4004–4002: a quick reaction zone in the short term.
Main Buy Zone 3986–3984: key support, combined with FVG.
Target Resistance: 4068–4082 (Liquidity Zone).
📈 Trading Plan
✅ BUY SCALP: 4004–4002
SL: 3996
TP: 4008 - 4012 - 4016 - 4020 - 4030 - 4040 - ????
✅ BUY ZONE: 3986–3984
SL: 3980
TP: 3990 - 3995 - 4000 - 4010 - 4020 - 4030 - 4040 - ????
⚠️ Risk Management Note
The 4000 level is a psychological resistance – prone to liquidity sweeps.
Prioritise waiting for clear price action signals at BUY zones.
Adjust volume sensibly as volatility may increase with political news & Fed impacts on market sentiment.
✅ Summary
Gold's uptrend remains solid thanks to political instability, Fed easing, record ETF inflows, and central banks continuing to hoard gold. Strategy prioritises BUY at 4004–4002 and 3986–3984 with targets aiming at 4068–4082.
GOLD UPDATE – Bulls Defend $4,000 Ahead of Powell’s SpeechGold continues to hold firm above the key $4,000 psychological level, even after a sharp correction from the all-time high near $4,059. The market’s focus now shifts to Fed Chair Jerome Powell’s speech, which could set the tone for the next directional move.
Despite the recent dip, the overall structure remains bullish, and the FiboMatrix setup still signals that buyers are not out of the game yet.
Technical Structure (H1 – FiboMatrix View)
Support Zone (BUY Setup):
4010 – 4012 → Retest of breakout trendline + Fibo 0.618 reaction zone.
Strong intraday base where liquidity may reload for another bullish leg.
Reaction Buy Zone:
402x → Potential confirmation area if price reacts positively.
Resistance Zone (ATH):
4060 → Previous intraday top, acting as the first major barrier before retesting 408x.
SELL Reaction Zone:
4084 – 4086 → Fibo 1.5 – 1.618 expansion zone, potential scalp short zone with tight stop above 4090.
🎯 Trading Plan (Francis Strategy)
✅ BUY Setup:
Entry: 4010 – 402x (wait for confirmation).
TP1: 4060
TP2: 4084
SL: Below 3996
⚠️ SELL Setup (Short-term scalp):
Entry: 4084 – 4086 (if rejection forms).
Target: 4040 → 4020
SL: Above 4096
🔑 Francis Outlook
Gold’s short-term correction looks more like a controlled retracement than a trend reversal.
As long as the price holds above the $4,000 handle, the bullish bias stays intact.
👉 Expect potential consolidation before Powell’s remarks, followed by a sharp reaction depending on the tone of his speech.
A clean breakout above 4060 – 4086 will open the path toward $4,100+ and new ATH targets.
🚀 Trend Bias: Bullish above 4010 – Buy the Dip, Sell only at Fibo extremes with confirmation.

October 9 Gold AnalysisOctober 9 Gold Analysis
Looking back at this week's performance, gold, driven by rising expectations of rate cuts and geopolitical risks, has performed exceptionally strongly, breaking through the $3,900 and $4,000 levels in succession and reaching new all-time highs. Despite a sharp drop in Thursday's Asian session due to the sudden news of a ceasefire agreement, gold prices quickly found strong support at the key psychological level of $4,000 and rebounded, having largely recovered the lost ground. This clearly demonstrates that the core driving forces of the current market remain unchanged, with strong buying appetite on dips and the overall upward trend remaining intact.
Analysis of Core Drivers
1. Expectations of Federal Reserve rate cuts: This is the fundamental driving force behind this surge in gold prices. Market expectations of further Fed rate cuts in October and December continue to build, reducing the opportunity cost of holding non-interest-bearing gold and providing a solid underlying support for gold prices.
2. Spreading risk aversion: The US government shutdown entered its second week, with bipartisan negotiations repeatedly breaking down, and market concerns about a prolonged shutdown intensified. This political risk has triggered widespread panic, driving continued safe-haven flows into the gold market.
3. Strong Technical Breakout: After breaking through $4,000, gold prices have confirmed entering a new price range. Although technical indicators suggest short-term overbought conditions and correction potential, the moving averages are bullish, and the upward trend remains solid.
Trading Strategy
Downward Support:
Primary support: $4,022 (the intraday low of the European session). A breakout here would indicate that market sentiment remains positive.
Core Support: $4,000. This is a key level that has been tested and successfully stabilized multiple times in the past two days and is the lifeline for determining the continuation of this upward trend. As long as gold prices hold above this level, the overall bullish outlook remains unchanged.
Upward Resistance:
Near-term resistance: $4,045 (the morning opening price and the rebound high in the Asian and European sessions). A breakout here would confirm the end of the short-term correction and reassert buying momentum.
Key Resistance: $4,060 (near the all-time high). A successful breakout above this level will open up further upside potential, with the next target likely reaching $4,100.
Trading Recommendations:
We recommend a volatile bullish outlook. Focus on stabilizing signals near the support area.
I've shared strategies earlier on my channel. Profitable traders can continue to increase their positions at lower levels, targeting 4,060-4,100.
Trade with caution and manage risk! Best of luck!

Gold holding buy trade from 4010 today morning upside 4060-90Gold holding buy trade from 4010 upmove will continue, upside levels given on chart
How My Harmonic pattern projection Indicator work is explained below :
Recent High or Low :
D-0% is our recent low or high
Profit booking zone ( Early / Risky entry) : D 13.2% -D 16.1 % is
range if break them profit booking start on uptrend or downtrend but only profit booking, trend not changed
SL reversal zone (Safe entry ) : SL 23.1% and SL 25.5% is reversal zone if break then trend reverse and we can take reverse trade
Target : T1, T2, T3, T4 and .
Are our Target zone
Any Upside or downside level will activate only if break 1st level then 2nd will be active if break 2nd then 3rd will be active.
Total we have 7 important level which are support and resistance area
Until , 16% not break uptrend will continue if break then profit booking will start.
If break 25% then fresh downtrend will start then T1, T2,T3 will activate
1,3,5,10,15,20 minutes are short term levels.
30 minutes 60 minutes , 2 hours,3 hours, ... 1 day and 1 week chart positional and long term levels

Gold Rally Pauses at $4060, Awaits Powell's Speech for AdvanceGold continues to extend its scorching bullish momentum reaching $4060 yesterday. Today's early Asian session witnessed mild pullback towards psychological zone $4000 and the dip was quickly absorbed by bargain hunters. The recovery seems capped at overhead resistance $4048-$4053 which bulls need to clear for resuming upside momentum that targets $4065-$4073-$4085-$4095 above which next leg higher may reach $4115 aligning with 261.8% Fibonacci extension.
Fundamental drivers
The US Government shutdown continues with no clear signs of agreement in Congress about debt ceiling and spending limits raising concerns among investors and elevated risk sentiments which further boost safe haven demand for Gold.
Fed minutes hint at relatively dovish bias suggesting policymakers are more concerned about growth risks than inflationary pressures which add to safe haven appeal for Gold. Markets eagerly await speech by Federal Reserve Chairman J Powell for further clues on interest rate cuts.
Geopolitical risks remain on edge as Middle East tensions and European political woes continue to be matters of global concern.
Global central banks continue to accumulate Gold despite record high prices which create strong structural demand for the metal in the long run.
Bond yields have been dull making non-yield Gold attractive for store of value.
Technical drivers
Gold continues to maintain a strong bullish market structure supported by price stability above psychological zone $4000 and further confirmed by a precise sequence of Higher Highs and Higher Lows which is essentially a clear evidence of bullish rally continuation.
Each correctional decline has been quickly bought and absorbed around liquidity zones implying smart money flow controlling the bullish momentum.
Immediate resistance $4048-$4053 caps upward bounce attempts which bulls need to clear through for further advance towards next leg higher.
4 hourly 5 EMA at $4032 is carrying immediate bullish momentum below which $4018-$4008 may offer another value buying opportunity.
RSI readings of 90 on Daily time frame as well as Monthly time frame are showing overbought conditions urging caution on heights and vulnerability of a sharp price correction either from these areas or from next bullish leg $4115.
Overall outlook
Gold remains extremely bullish in line with the primary trend. However, it looks like the bullish momentum is approaching point of inflection with growing possibilities of a price correction somewhere nearby, possibly $4115 or earlier. Any news of agreement to resolve the US Government shutdown will witness a sizeable price rebalancing at the drop of a hat.
For now, as long as the sequence of Higher Highs and Higher Lows remain intact, the bullish rally keeps going.

Gold Eyes New Highs Within Ascending ChannelAnalysis:
The XAU/USD 1-hour chart shows gold trading firmly within an ascending parallel channel, maintaining a clear pattern of higher highs and higher lows — a hallmark of sustained bullish momentum.
Currently, price action is consolidating near the mid-level of the channel, preparing for a potential breakout toward the upper boundary near $4,110–$4,120. The projected path (blue arrows) suggests a minor retracement or sideways move before buyers push prices higher again.
As long as gold remains above the lower channel support around $4,000–$3,990, the bullish outlook stays intact. A confirmed breakout above the upper boundary could open the door for a new leg upward, supported by ongoing momentum and strong market sentiment.
Key Levels:
Resistance: $4,110 – $4,120
Support: $3,990 – $4,000
Trend Bias: Bullish within ascending channel

$4070 Gold: New Record! Recent Dip Was a Bada Sell Trap?Hello, traders!
Gold just set a New Record at $4,070.5/oz (Futures). Kya momentum hai! This rally, up 54% YTD, is fueled by two main engines, boss: 1) Confirmed Fed rate cuts (FOMC Minutes pakka it) and 2) Super-strong safe-haven demand due to global gadbadi (US Shutdown, conflict, etc.).
Technical Analysis & BUY Dips Strategy Confirmed
That sharp pullback from $405x to $4000 (the Fib 0.5 zone) made many people panic-sell. But look closely: buyers overpowered them and broke $402x resistance.
Technical Conclusion: That dip was clearly a Sell Trap and just a Consolidation phase. The primary bias is confirmed: BUY on Dips is the absolute priority. Risk ko control karo.
Risk Warning: If $4000 is cleanly broken with heavy volume, then long positions will be in trouble.
Key Price Levels:
Resistance: $4049, $4057, $4064, $4074, $4084, $4094
Support: $4021, $4009, $3992, $3978
Trading Strategy (Prioritize BUY at Support)
BUY SCALP: $4019 - $4017
SL: $4013
TPs: $4023, $4028, $4033, $4038
BUY ZONE (Strong Demand): $3992 - $3990
SL: $3982
TPs: $4000, $4010, $4020, $4030, $4040
SELL SCALP: $4056 - $4058
SL: $4062
TPs: $4053, $4048, $4043, $4038
SELL ZONE (High Risk): $4084 - $4086
SL: $4094
TPs: $4076, $4066, $4056, $4046, $4036
Will this momentum take us past $4100 this week? Chalo, dekhte hain! 👇
#Gold #XAUUSD #4070USD #ATH #Fed #BUYDIPS #SellTrap #TradingView #PaisaBanega

Gold 1H – Watch for Liquidity Hunt Before Fed Minutes💎 XAUUSD – Intraday Trading Plan | by Ryan_TitanTrader
📈 Market Context
Gold continues to shine past the ₹4,000 mark, driven by persistent safe-haven demand amid U.S. government shutdown risks and growing expectations for multiple Fed rate cuts this year.
The upcoming Fed minutes will be a pivotal catalyst—if the tone leans dovish, gold could accelerate. But any hawkish surprises may provoke a short squeeze or shakeout.
🔎 Technical Analysis (H1 / SMC Style)
• Structure around 4070–4068 marks a premium liquidity zone, likely a sweep or reversal point.
• The lower band 3987–3989 serves as a discount zone / support base from which buyers may re-enter.
• Watch for clean Breaks of Structure (BOS) or Change of Character (ChoCH) on lower timeframes as confirmation.
• Always expect potential liquidity sweeps before major news reactions.
🟢 Buy Zone: 3987–3989
SL: 3980
TP targets: 4000 → 4015 → 4025 → 4040+
🔴 Sell Zone: 4068–4070
SL: 4077
TP targets: 4060 → 4045 → 4030 → 4015
⚠️ Risk Management Tips
• Let the price show intent (reject / sweep / BOS) before jumping in.
• On Fed minutes release, volatility may spike—use partial sizing and tighter trailing stops.
• Avoid trading right at the release; look for reactions and structural confirmation.
✅ Summary
Gold remains bullish structurally, but intraday plays hinge on how markets interpret the Fed minutes. Expect a liquidity sweep around 4068 before potential shorting, and a resilient support zone around 3987–3989 for re-entries aligned with the bigger bullish structure.
🔔 Stay alert for live updates and structure breaks around the Fed minutes to fine-tune entries.

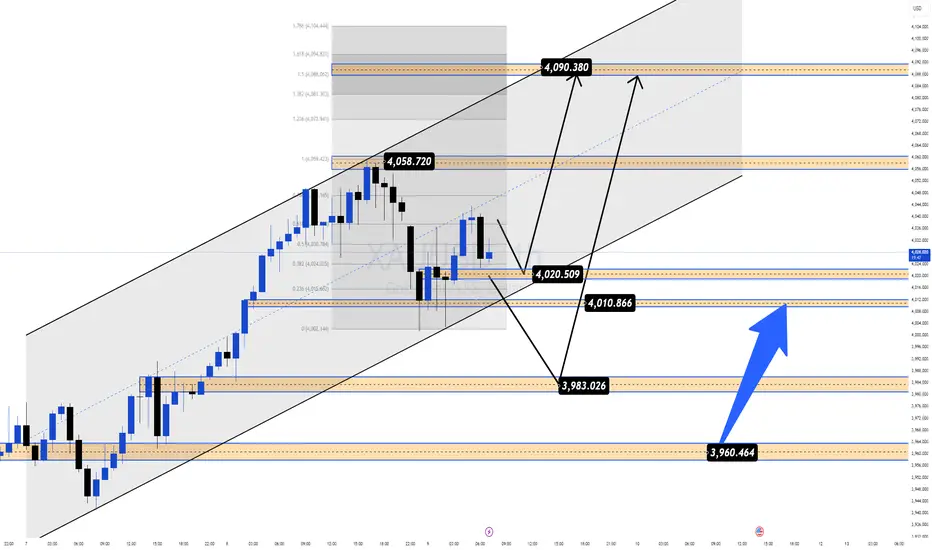
Bulls Reloading After a Healthy Pullback | Next Target: 4090+📊 Market Context
After a powerful bullish rally that pushed gold to record highs, XAUUSD retraced about 1% on Thursday as traders took profit from the recent surge. However, this move appears to be a technical correction, not a trend reversal — as indicators have shown overbought conditions for several sessions.
Despite this short-term pullback, the long-term uptrend remains intact.
Gold is up more than 50% year-to-date, driven by:
🌍 Ongoing geopolitical and trade tensions,
💰 The Federal Reserve’s monetary easing cycle,
🏦 Record central bank gold accumulation,
⚔️ Rising global uncertainty, fueling strong safe-haven demand.
Overall, this retracement could be an ideal setup for BUY re-entries, as bulls look to reload positions toward the 4090–4100 liquidity zone.
🔎 Technical Analysis (H1/H4)
Price remains inside the medium-term bullish channel, showing strong reactions around 4000–3980 support.
4010–4008 acts as a quick scalp zone for short-term entries.
3984–3982 serves as a key structural support and liquidity reaction area.
4090–4092 (Liquidity Sell Zone) stands as the major resistance — potential liquidity trap area.
📈 Trading Plan
✅ BUY SCALP: 4010–4008
SL: 4002
TP: 4015 - 4020 - 4030 - 4040 - 4050 - ????
✅ BUY ZONE: 3984–3982
SL: 3978
TP: 3990 - 3995 - 4000 - 4005 - 4010 - 4020 - ????
✅ SELL ZONE: 4090–4092
SL: 4098
TP: 4085 - 4080 - 4070 - 4060 - 4050 - ????
⚠️ Risk Management Notes
The 4000 level remains a strong psychological and structural support — only enter long positions with confirmed price action signals.
Be cautious around 4090–4100, where liquidity sweeps and false breakouts are likely.
Adjust position size properly to manage volatility during high-impact news or geopolitical updates.
✅ Summary
Gold is undergoing a healthy correction phase within its broader uptrend.
The strategy remains BUY-focused at 4010–4008 and 3984–3982,
with upside targets toward 4060–4090,
and a potential short-term SELL opportunity near 4090–4092 if rejection signals appear.
💡 MMFLOW TRADING – Trade with market structure, follow liquidity, and ride the BIGWIN setups!
Elliott Wave Analysis – XAUUSD 09/10/2025
________________________________________
🔹 1. Momentum
D1:
The current momentum is turning downward.
We need to wait for today’s D1 candle to close for confirmation.
➡️ If the daily candle closes bearish, it may mark the beginning of a deep and strong corrective wave.
H4:
H4 momentum is about to enter the oversold zone, suggesting the possibility of:
• A short-term bullish retracement, or
• A sideways consolidation phase before the next major move.
H1:
H1 momentum is approaching the overbought zone, indicating a potential short-term bearish correction ahead.
________________________________________
🔹 2. Wave Structure
Overview:
In the previous analysis, the COT report indicated that the market is in an overly optimistic phase — a warning sign to stay cautious with long positions or late entries.
D1:
• The yellow wave 5 has already broken above the channel (throw-over), which is a typical sign of a final impulsive phase.
• When wave 5 extends strongly, the following correction (wave 4) often drops sharply, erasing most of the previous gains.
➡️ Therefore, it’s time to prioritize a defensive strategy and avoid chasing tops.
H4:
• Price has moved beyond the upper boundary of the channel, making the exact top of wave 5 hard to pinpoint.
• We should monitor price reaction when it returns inside the channel — if price fails to make a new high when H4 momentum reaches the overbought zone, it will likely confirm the completion of wave 5.
H1:
• The wave count has been slightly adjusted compared to the previous plan.
• Within the black wave 5, there is now a clear 5-wave yellow substructure.
• The recent decline has broken below the lower trend channel and the previous wave 4 low — an early sign of a potential wave 5 top.
⚠️ The upcoming correction could be steep and fast, making this an important time to prepare for risk management and trade planning.
________________________________________
🔹 3. Outlook & Trading Plan
All timeframes (D1 – H4 – H1) are showing an extended wave 5, but there’s still no clear confirmation of a top.
Hence, we should trade cautiously and manage positions tightly.
Currently, price has broken below the lower channel and wave 4 yellow, with a liquidity area near 4038 — this offers a good opportunity to open a small sell position to anticipate a potential reversal.
Trading Plan:
Sell zone (small lot): 4037 – 4039
Stop loss: 4048
Take profit: 3985

XAU/USD: Targeting $4,100! Where to Buy Before the FOMC Minutes?Hello TradingView community! 🚀
Gold (XAU/USD) continues to demonstrate incredible strength, consistently breaking past old highs and forming a solid upward price channel. This robust uptrend is not only technically reinforced but also awaits a potential catalyst from today's significant fundamental news.
In this analysis, we will combine two crucial perspectives: an in-depth look at the technical charts to identify optimal entry points, and an examination of the key fundamental event that could significantly impact Gold prices during the US session.
1. Fundamental Perspective: All Eyes on the FOMC Minutes
Today's market highlight, Wednesday, October 8, is the release of the FOMC Meeting Minutes at 2:00 PM ET
Why is this important? This document provides a detailed record of the latest policy meeting of the US Federal Reserve (FED) in September. Traders will scrutinise the text for any hints about the future interest rate path.
Potential scenarios:
"Dovish" Tone: If the minutes reveal FED officials' concerns about economic growth and the possibility of further rate cuts, the US Dollar might weaken. This would create a strong push for Gold (XAU/USD), potentially driving the next price surge.
"Hawkish" Tone: If the minutes emphasise that inflation remains a concern and the FED is not in a hurry to cut rates, the USD might see a short-term recovery, causing Gold to have a corrective dip.
This event is a top catalyst for volatility. Our strategy is to prepare technical zones to capitalise on the market's reaction.
2. Technical Analysis: Detailed Trading Plan
The bullish structure on the 2H timeframe is undeniable. Prices are creating a series of higher highs, confirmed by each "BoS" (Break of Structure), signalling that the Buyers are in full control. Here are the key zones to watch:
Potential Buy Zones (Key Points):
FVG Zone ($4,004): The nearest support is this Fair Value Gap, an area of price imbalance that the market often seeks to fill. Prices may retest this area before or during the news release.
"Buy Break BoS" Zone ($3,981): This is the nearest swing high that has been broken. Now it has turned from resistance into a crucial support level. This zone offers a solid entry point if prices correct slightly deeper.
"Bullish Order Block" Zone ($3,951): This is the last major "stronghold" of the Buyers—a powerful buy order block that initiated the latest push wave. This is an ideal area to look for buy orders if the market experiences a strong liquidity sweep downwards.
Upside Targets:
Short-term Target (Scalping): $4,070 - This level coincides with the 0.786 Fibonacci level.
Main Target: "Liquidity Sell" Zone at $4,103. This is a large "liquidity pool" where the Sellers' stop-loss orders are likely concentrated. Smart money often drives prices to such areas.
Strategy Summary
Main Trend: Bullish.
Core Strategy: Look for "Buy the dip" opportunities at the key support zones mentioned.
Critical Timing: Be cautious around the FOMC Minutes release (18:00 UTC). Volatility can be high, and the market may whip in both directions to sweep stop-losses before following the main trend.
Pro Tip: Patience is key. Waiting for prices to pull back to a confirmed support zone will provide a much better Risk/Reward ratio than chasing the market at the top.
WHAT'S YOUR VIEW?
How do you think Gold will react to today's FOMC minutes? And where are you looking to place your buy orders—at the FVG zone $4,004, the BoS level $3,981, or are you patiently waiting for the Order Block $3,951?
Share your views in the comments below!
👇 Don't forget to leave a Like 👍 and Follow the channel for the latest XAU/USD analysis updates!

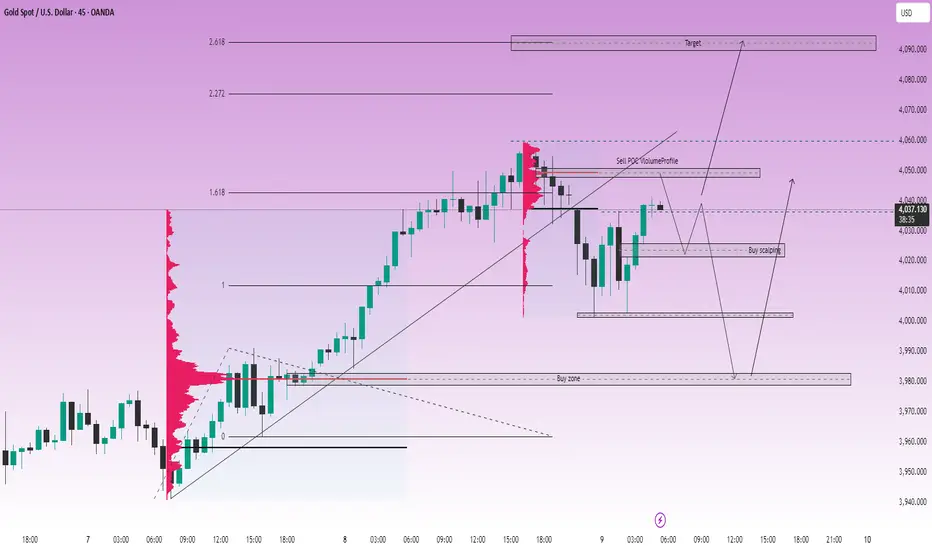
GOLD: Continuing Uptrend Structure, Target 4090 Approaching LiamTrading – GOLD: Continuing Uptrend Structure, Target 4090 Approaching
Hello everyone,
Gold and US stocks are setting new records together, but don't forget — strong sell-offs often appear when everyone believes prices can only rise.
Currently, gold maintains a sustainable uptrend structure, with each subsequent low higher than the previous one, confirming a clear trend on the H1–H4 timeframe.
📊 Technical Analysis (Chart 45m – XAUUSD)
The price structure remains a clear Higher High – Higher Low, indicating that buyers are still in control of the market.
Key liquidity zones are around:
🔹 4050–4060 (resistance – POC Volume Profile)
🔹 4020–4025 (temporary support zone – confluence of Fibo 0.618)
🔹 3980 (technical bottom, strong previous liquidity zone)
The upward target according to Fibonacci Extension is currently in the 4090 zone, corresponding to the 2.618 extension level — likely to become a major profit-taking area for buyers.
🎯 Today's Trading Scenarios
Short-term Sell (based on resistance reaction):
📍 4048–4050
🛑 SL: 4055
🎯 TP: 4030 – 4018 – 4005 – 3980
Buy scalping:
📍 4022–4024
🛑 SL: 4017
🎯 TP: 4030 – 4045 – 4060 – 4080
Buy swing (trend-following):
📍 3980–3982
🛑 SL: 3975
🎯 TP: 3995 – 4010 – 4025 – 4040 – 4060
🧭 Fundamental & Market Sentiment View
According to the FOMC minutes from 16–17/9, most Fed officials believe that continuing to cut interest rates this year is appropriate.
This is the first time since 2020 that the Fed has officially reduced the interest rate by 0.25%, bringing the range down to 4.75% – 5.00%.
→ Cheap money + safe-haven sentiment continue to be the main drivers pushing gold higher.
However, with gold and stocks both reaching peaks, the risk of technical corrections may occur when prices hit major liquidity zones.
📌 Conclusion
Gold is still in a stable uptrend, with a short-term target towards 4090 USD/oz.
However, watch the liquidity zones around 4050–4060 and 4000–4025 to optimize entry points, avoiding FOMO when prices are already in high zones.
👉 I will continue to update details for each trading session.
Follow me to not miss the earliest gold scenarios!
Elliott Wave Analysis – XAUUSD 09/10/2025
________________________________________
🔹 1. Momentum
D1:
The current momentum is turning downward.
We need to wait for today’s D1 candle to close for confirmation.
➡️ If the daily candle closes bearish, it may mark the beginning of a deep and strong corrective wave.
H4:
H4 momentum is about to enter the oversold zone, suggesting the possibility of:
• A short-term bullish retracement, or
• A sideways consolidation phase before the next major move.
H1:
H1 momentum is approaching the overbought zone, indicating a potential short-term bearish correction ahead.
________________________________________
🔹 2. Wave Structure
Overview:
In the previous analysis, the COT report indicated that the market is in an overly optimistic phase — a warning sign to stay cautious with long positions or late entries.
D1:
• The yellow wave 5 has already broken above the channel (throw-over), which is a typical sign of a final impulsive phase.
• When wave 5 extends strongly, the following correction (wave 4) often drops sharply, erasing most of the previous gains.
➡️ Therefore, it’s time to prioritize a defensive strategy and avoid chasing tops.
H4:
• Price has moved beyond the upper boundary of the channel, making the exact top of wave 5 hard to pinpoint.
• We should monitor price reaction when it returns inside the channel — if price fails to make a new high when H4 momentum reaches the overbought zone, it will likely confirm the completion of wave 5.
H1:
• The wave count has been slightly adjusted compared to the previous plan.
• Within the black wave 5, there is now a clear 5-wave yellow substructure.
• The recent decline has broken below the lower trend channel and the previous wave 4 low — an early sign of a potential wave 5 top.
⚠️ The upcoming correction could be steep and fast, making this an important time to prepare for risk management and trade planning.
________________________________________
🔹 3. Outlook & Trading Plan
All timeframes (D1 – H4 – H1) are showing an extended wave 5, but there’s still no clear confirmation of a top.
Hence, we should trade cautiously and manage positions tightly.
Currently, price has broken below the lower channel and wave 4 yellow, with a liquidity area near 4038 — this offers a good opportunity to open a small sell position to anticipate a potential reversal.
Trading Plan:
Sell zone (small lot): 4037 – 4039
Stop loss: 4048
Take profit: 3985

Gold Neowave Update | 09/10/2025Namaskaram Everyone
Welcome to intelligent investor, we provide market insights by synchronising and combining all the price action waves from different time frames and gives you single trend.
Previous Video

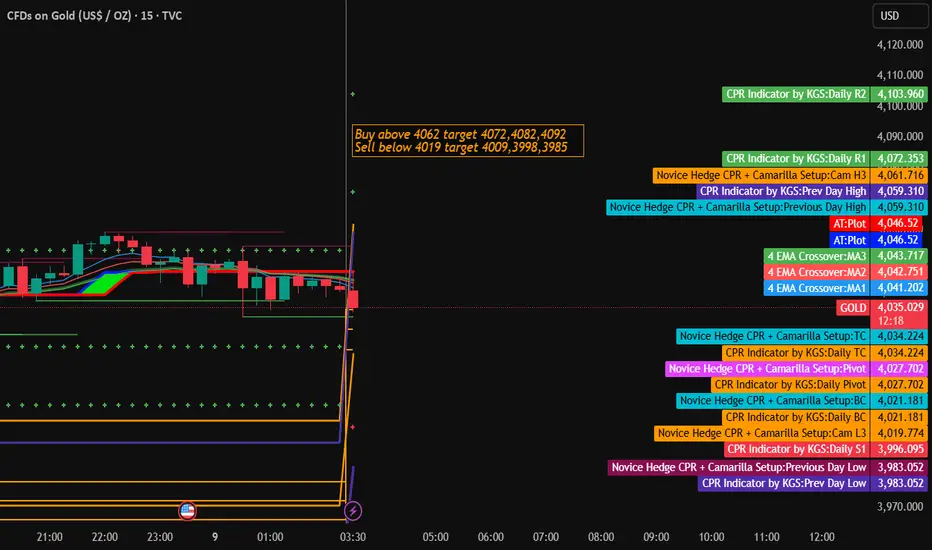
Gold Trading Strategy for 09th October 2025🎯 GOLD INTRADAY SETUP
🟢 BUY Setup:
💰 Buy Above: $4062 (1-hour candle close above this level)
🎯 Targets:
1️⃣ $4072
2️⃣ $4082
3️⃣ $4092
🔴 SELL Setup:
💰 Sell Below: $4019 (1-hour candle close below this level)
🎯 Targets:
1️⃣ $4009
2️⃣ $3998
3️⃣ $3985
⚠️ Disclaimer:
📉 This analysis is for educational purposes only. It is not a buy or sell recommendation. Always conduct your own analysis and use proper risk management before trading.
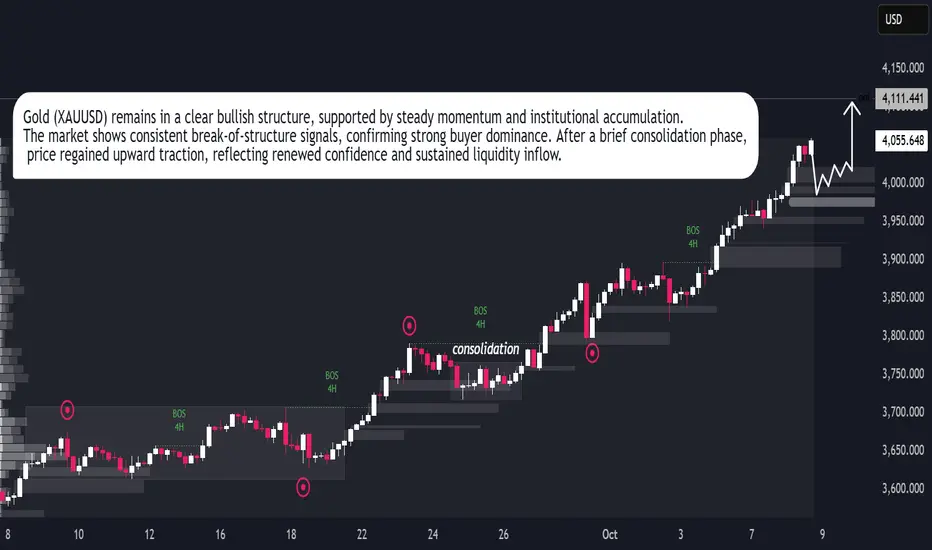
Gold Price Rally Sustains – Market Eyes Next Breakout PointGold (XAUUSD) continues to follow a strong bullish trajectory, confirming consistent market confidence and institutional participation. The chart structure reveals clear liquidity shifts and a steady series of bullish break-of-structure (BOS) points, suggesting that buyers remain in firm control. After a brief consolidation phase, gold resumed upward momentum, supported by sustained volume and steady market sentiment.
The current trend indicates controlled buying pressure rather than speculative spikes, showing the market’s preference for stability as price builds toward higher levels. If momentum maintains its present pace, gold could extend gains in the short term while maintaining its established bullish rhythm across the higher timeframe outlook.