New ATH: Shutdown Fuels Gold's Seventh Straight WinHello, traders!
Gold just sealed its seventh consecutive weekly gain, boss, with futures hitting a whopping $3,908.9/oz. This rally is powered by growing tension over the US Government Shutdown and the solid expectation of a Fed rate cut (97% chance in October, no less!).
Fundamentals & Outlook: Pure Safe-Haven Rally
Political Instability: The prolonged Shutdown is a proper bullish driver now. It's delaying key economic reports, creating huge uncertainty, and attracting big safe-haven capital flows.
Rate Cut Certainty: The market is absolutely banking on a Fed rate cut, giving massive support to non-yielding Gold.
Technicals & Trading Strategy: Focus on $3867
The weekly buying power is super strong. Gold is holding steady near the $3900 mark. The $3867 level is our critical line, bhai; if the price stays above it, the potential for new ATHs remains very high.
Key Price Levels:
Resistance: $3902, $3912, $3922, $3942
Support: $3867, $3855, $3839, $3792
Trading Strategy (Absolute Risk Management):
BUY ZONE 1: $3867 - $3865
SL: $3857
TPs: $3875, $3885, $3895, $3905, $3915
BUY ZONE 2: $3839 - $3827
SL: $3824
TPs: $3847, $3857, $3867, $3877, $3887
SELL ZONE 1: $3902 - $3904
SL: $3912
TPs: $3894, $3884, $3874, $3864
SELL ZONE 2: $3942 - $3944
SL: $3952
TPs: $3934, $3924, $3914, $3904
What's your view? Will the US political drama help Gold finally break past $3900 next week? Tell me below! 👇
#Gold #XAUUSD #ATH #Shutdown #Fed #TradingView #MarketAnalysis #GoldRush
Trade ideas

Elliott Wave Analysis – XAUUSD (October 6, 2025)
________________________________________
🔹 1. Momentum
D1 Timeframe
• Daily momentum is currently declining, with both lines starting to converge inside the overbought zone.
• Today is a critical day:
o If the daily candle closes strongly bullish, price may extend the upside for another 2–3 days.
o If the daily candle closes bearish, momentum will continue to decline, suggesting the correction may extend further.
➡️ Therefore, today’s daily close will be important to determine the mid–term trend direction.
H4 Timeframe
• H4 momentum lines are stuck together in the overbought zone, indicating a potential reversal could happen at any moment.
H1 Timeframe
• H1 momentum is turning upward, but since it’s already near the overbought area, the current push may not be sustainable.
➡️ A short-term pullback is likely to occur within the next 1–2 H1 candles.
________________________________________
🔹 2. Wave Structure
D1 Timeframe
• On the daily chart, price has broken above 3877, which is the second target of the yellow wave 5.
• Given the strong move, this could simply be a liquidity sweep, not necessarily the end of wave 5 yet.
➡️ We need to observe the daily close to confirm whether momentum continues to weaken or stabilizes.
H4 Timeframe
• After a 3-wave ABC correction (in blue), the price is now moving within purple wave 5.
• Based on the current price channel, two possible targets for purple wave 5 are:
o 🎯 Target 1: 3923
o 🎯 Target 2: 3986
H1 Timeframe
• The structure shows a 5-wave pattern (in black) inside purple wave 5.
• The 0.618 projection of wave 5 has already been reached near 3926, which also aligns with the 0.382 retracement level of the H4 structure — creating a strong confluence zone suitable for a potential short setup.
• If price closes decisively above 3926, it may continue to extend toward 3986.
➡️ In that case, it’s better to wait for a clear reversal signal near 3986 rather than shorting too early.
________________________________________
🔹 3. Trading Plan
📍 Setup:
• Sell Now: 3925 – 3926
• Stop Loss: 3936
• Take Profit: 3899
📌 Safer Option:
Wait for a bearish H1 confirmation candle before entering the trade.
⚠️ Note:
This is a potential topping phase, so it’s essential to manage positions carefully — avoid loose stop losses or unprotected exposure.

#Gold Long term view#Gold Long term view(5years):
Gold price is creating new all time highs.
We may see another 10-15% upside move in the coming months.
Existing positions can hold and book some profits near the top and carry the rest.
No fresh long positions are recommended at the current levels as price is nearing the top.
We may see a declining phase in gold in the upcoming 5yrs as we have seen in the past from 2010-2015.
Note: Kindly note that the above view is purely based on past data.
Since many global factors effect the gold price, plan your investments wisely.

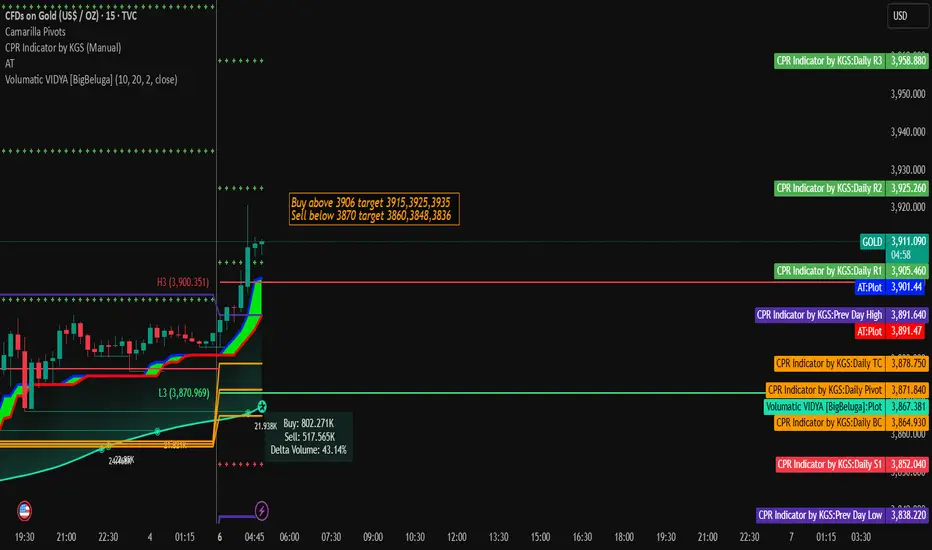
Gold Trading Strategy for 06th October 2025🌟 GOLD Intraday Trading Plan 🌟
💰 Buy Setup
📈 Buy Above: the high of 15-min candle — only if price closes above $3906
🎯 Targets:
🎯 1st Target: $3915
🎯 2nd Target: $3925
🎯 3rd Target: $3935
🛡️ Stop Loss: Below $3900 (or as per your risk level)
💰 Sell Setup
📉 Sell Below: the low of 1-hour candle — only if price closes below $3870
🎯 Targets:
🎯 1st Target: $3860
🎯 2nd Target: $3848
🎯 3rd Target: $3836
🛡️ Stop Loss: Above $3878 (or as per your risk level)
⚠️ Disclaimer:
This is not financial advice. 📜
Trading in commodities like Gold ($XAU/USD) involves high risk and may not be suitable for all investors. 📊
Always do your own analysis before taking any trade. 💡
Use proper risk management and trade at your own discretion. 💼
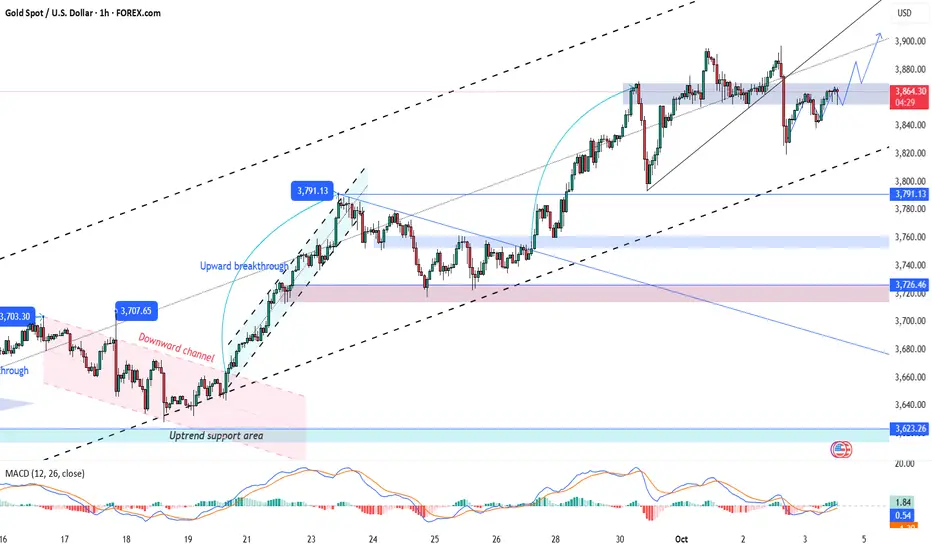
XAUUSD/Gold Weekly Buy Projection (05.10.25) chartXAUUSD/Gold Weekly Buy Projection (05.10.25) chart.
Here’s a clear technical summary of what your chart shows:
🔹 Overall Structure
The chart projects a bullish move for XAUUSD (Gold).
Title: Weekly Buy Projection – 05 Oct 2025
Main trend: Ascending continuation pattern (marked by blue upward trendlines).
Current price zone: around $3,886.45.
🔹 Key Levels
Support S2: around $3,838 – $3,846
Support S1: around $3,870 – $3,878
Resistance 1: around $3,900 – $3,910
Resistance 2 (New ATH): around $3,939 – $3,970
🔹 Pattern & Projections
Golden Ratio (0.618 Fibonacci) formed near $3,874, signaling a retracement support.
Bullish engulfing candle noted at Support S1, confirming buying interest.
Possible Double Top highlighted near Resistance 1, indicating a short-term pullback risk before continuation.
Fair Value Gap (FVG) exists between $3,875–$3,890, suggesting potential liquidity refill before next le

LiamTrading – GOLD Weekly Plan ..GOLD Weekly Plan: Prepare for a Breakthrough to a New ATH
The new trading week opens with extremely complex sentiments — many traders are confused, and even the “big players” are cautious.
But if you look closely at the price structure, everything becomes clear: gold is still in a sustainable uptrend.
🧠 Psychological & Trend Analysis
Gold has just closed the week with a strong upward momentum, confirming the continuation of the medium-term uptrend.
At this stage, “Selling at the peak” is almost a dangerous move – as each correction is shallow and quick, not allowing sellers enough time to exit.
This creates a strong “fear of missing out” (FOMO) sentiment – driving funds to continue pouring in when the price hits the trendline or technical retracement zones.
📊 Technical Analysis
On the H4 chart, the upward structure of gold is clearly visible following the impulse + correction box pattern (each accumulation – breakout repeats).
The 3820–3830 zone continues to be the “golden retracement point” as it coincides with the medium-term uptrend line.
Last week's bounce from this zone brought excellent profits for those who patiently waited.
Currently, the next target for gold lies at the Fibonacci 1.618 zone – around 3980, which is also a significant psychological level where many investors might take profits.
🎯 Trading Scenario
Buy setup (trend-following):
Entry: 3830
Stoploss: 3815
Take Profit: 3980
Sell reaction (short-term upon reaching target):
Entry: around 3980
Stoploss: 3988
TP open depending on price reaction (scalping strategy)
🔍 Conclusion
Gold is still on the right growth trajectory, with short corrections merely opportunities to “accumulate”.
Continue trading with the trend, patiently waiting for the price to retrace to strong confluence zones instead of FOMO at high prices.
I will continue to share more details in daily updates here.
Follow me to not miss the latest gold scenarios.

XAU/USD Near Record Highs: Key Data AheadGold (XAU/USD) Technical Outlook – October 3, 2025
1. Macro & News Context
Gold is holding near record highs, heading for its seventh consecutive weekly gain, supported by expectations that the Federal Reserve will continue cutting rates and by concerns around the ongoing U.S. government shutdown. Spot prices have recently tested the ₹3,890–3,900 region and are now consolidating around ₹3,860.
Nonfarm Payrolls (NFP) – Typically scheduled for 18:00 IST on the first Friday of the month, the September jobs report is likely to be delayed due to the U.S. government shutdown.
Key event to watch today:
ISM Services PMI (September) will be released at 19:30 IST. Since ISM data is privately produced, it will be published regardless of the shutdown and may serve as the main volatility catalyst in today’s U.S. session. 【ISM】
Labor market signals: Challenger job cut data showed lower layoffs in September, but planned hiring at the lowest level since 2009, reinforcing a softer employment backdrop. Combined with the Fed’s recent 25 bps rate cut (to 4.00%–4.25%), this continues to support the bullish gold narrative.
USD trend: The dollar has weakened broadly this week, aligning with market bets on further monetary easing. This backdrop provides an additional tailwind for gold.
2. Technical Landscape (H1 Chart)
The attached chart highlights key technical zones and a completed Harmonic XABCD pattern on the 1H timeframe:
Support levels:
Near-term: ₹3,844–3,841
Deeper: ₹3,827 (intraday pivot), ₹3,792 (strong low)
Strategic: ₹3,764–3,770 (Bullish Order Block)
Resistance levels:
Immediate: ₹3,865
Strong supply: ₹3,880–3,890 (Bearish Order Block)
Extended target: ₹3,930–3,940 (Sell Scalping | Fibo zone)
Momentum: After bouncing from point D of the harmonic structure, gold has been forming higher lows (HL). Price currently sits above the longer-term moving average and is testing the shorter-term average, suggesting a constructive short-term bias as long as supports hold.
3. Trade Scenarios
Scenario 1 – Buy-the-dip (preferred bias)
Entry zone: ₹3,844–3,841
Stop loss: Below ₹3,827 (safer: below ₹3,792)
Targets:
₹3,865 (first take-profit)
₹3,880–3,890 (major supply)
Stretch: ₹3,930–3,940
Rationale: Higher low formation, bullish macro backdrop, aligned with strong weekly uptrend.
Scenario 2 – Countertrend short at resistance
Trigger zone: ₹3,880–3,890 (Bearish OB)
Confirmation: Rejection candles (H15–H1) such as wicks, engulfing, or failed breakout.
Stop loss: Above ₹3,895–3,900 (or above ₹3,945 if price spikes into the ₹3,930–3,940 fib zone).
Targets: ₹3,865 → ₹3,844 → ₹3,827
Rationale: Potential liquidity sweep ahead of ISM, with profit-taking likely near supply zones.
Scenario 3 – Breakdown through support
Trigger: 1H close below ₹3,841
Path: ₹3,827 → ₹3,792 (Strong Low) → ₹3,764–3,770 (Bullish OB)
Rationale: Loss of intraday structure would flip bias short until major demand zones.
4. How to Trade Around Today’s Data
If NFP is indeed delayed, the 18:00 IST slot may bring limited volatility.
Focus instead on the ISM Services PMI at 19:30 IST, which could trigger sharp swings in both USD and gold.
Adjust position sizing: Expect spread widening and slippage around the release. Reduce leverage or scale into positions.
5. Risk Management
Limit risk per trade to 0.5–1% of account equity.
Avoid chasing price once levels are tested; wait for H15–H1 candle closes for confirmation.
Monitor the U.S. Dollar Index (DXY) and Treasury yields – further dollar weakness would reinforce bullish gold setups.
🔑 Key Takeaway
Gold remains structurally bullish in the broader trend, with immediate support at ₹3,841–3,844 critical to maintain upside momentum. Watch for reactions around ₹3,880–3,890 and ₹3,930–3,940. With NFP possibly delayed, the ISM Services PMI at 19:30 IST will be today’s most important catalyst for directional moves.

GOLD@ 3890 : Bubble Peak or Just a Pit-Stop?Pullback vs. Correction The 100th-Idea Deep Dive !!
Gold has moved almost 88% in the last two years to new records. The main drivers are falling real yield expectations with an easing bias, persistent geopolitical risk, record central bank buying and the 2025 rebound in ETF demand.
Geopolitics is shifting as Washington pushes for a Gaza ceasefire. Headlines talk about partial acceptance and ultimatums but nothing is done yet. The war premium can fade step by step though headline shocks will still remain.
Key levels:-
Resistance 3890–4000
Pullback zone 3640–3650 (5%)
Correction zone 3475–3480 (11%)
Weekly RSI stretched into high 70s and 80s → risk of mean reversion before any bigger change.
Macro gears:-
Real yields and the dollar:-
Lower real yields = higher gold. That is the key lever. As rate cuts and softer real rates were priced into 2025, gold repriced hard.
Central bank sponsorship:-
Official demand has been consistent three years in a row. 2022 at 1082t, 2023 at 1037t, 2024 at 1045t. This is rare in modern data and explains why dips are shallow.
ETF flows:-
After outflows in 2024, 2025 turned. Three straight months of inflows into August, strongest since 2020, YTD around 588t. Pure fuel ✨
Geopolitics & the premium:-
From 2023 to 2025 Middle East risk kept term premia elevated. Now Gaza peace talks open a path for that premium to fade. But timelines and enforcement are unclear. Strikes still came even with peace headlines. Means the bleed can be gradual but headline spikes remain..
Pullback or true correction:-
3890–4000 is the confluence zone. Psychological milestone + vertical extension after 88% impulse. Bubble behavior meets supply.
Level 1 at 3640 → about -5% pullback. If bids hold, trend resumes.
Level 2 at 3470→ -10 to -12% wash into prior shelf. Would be first real reset in two years.
Weekly momentum overbought. Phases like this don’t end instantly but forward returns improve after reset.
Flows @ CBs rarely chase tops, they buy weakness across months. That softens drawdowns.
ETFs are flighty. Peace plus firmer yields can stall inflows. Any Fed pivot or growth wobble can flip them back fast.
Possible future paths :-
Continuation bubble :- Break 3900 → 4050–4200
Triggers dovish Fed, softer yields, failed peace, ETF flows
Tactic = only add above 3900 on daily/weekly close. No chasing wicks.
Shallow pullback :-Tag 3630–3660 then rotate
Triggers peace holds, modestly firm yields, demand returns
Tactic = scale in near 3640–3650 if H4 shows higher low + reclaim POC. First TP 3780–3820.
True correction :- flush 3520–3460
Triggers Gaza settlement + real yields higher + ETF stall
Tactic = let it wash. Look for capitulation + basing 3480–3460. Best R:R after failed bounce and reclaim.
Levels & invalidation:-
Bull continuation pivot 3890–3900. Opens 4050–4200.
Pullback buy zone 3630(Hvz)–3650 with confirmation. Invalidation H4 <3600.
Correction buy zone 3480 ±20 after basing. Invalidation weekly <3420 → opens 3300–3350.
If flat → stagger entries and size carefully.
If long from lower → trail under last daily HL, book partial 3880–3950.
Surprise risk (Imp) ETF squeeze higher – inflows still not at 2020 peak → late cycle melt-up possible.
Policy shock – faster cuts or fiscal noise sink yields = blow-off. Strong data → pop in yields = sharp air pocket.
Geopolitical whipsaw – peace unravels → $50–100 spike in thin tape!!
Bottom line:-
This is a two year vertical impulse meeting macro reality at 3890.
Level 1 = 3640–3650 pullback line.
Level 2 = 3480 correction line.
Until weekly breaks, dips are still opportunities not obituaries. But only with structure. No blind catching this high up.
Bubbles don’t end quietly – great trends reset then go again ✨
Fade euphoria into 39xx if momentum stalls. Buy fear into 348x if the market finally delivers the reset it owes.
Trade safe ⚡
Sparkrlight ♾️✨⚡

Trading Discipline – The Defining Edge of Professional TradersIn Forex and Gold trading, there is one truth every trader eventually learns: discipline matters more than strategy.
A simple system executed with discipline can deliver consistent results.
A brilliant system without discipline will collapse under pressure.
🧠 Stop-loss & Take-profit – Your Survival Tools
Stop-loss: Not surrender, but capital protection.
Take-profit: Not prediction, but securing gains before greed erodes them.
👉 Rule of pros: Set SL/TP before entering a trade – and never move them out of fear or hope.
📊 Case Study: Discipline vs Emotion
Undisciplined trader: Moves stop-loss further when price goes against him. Small loss turns into account damage.
Disciplined trader: Keeps stop-loss intact, loses 1%. Over 20 trades, system edge delivers net profits.
➡️ Lose small to win big.
🚀 Habits That Build Discipline
Have a trading plan: Entry rules – SL – TP – risk – time frame.
Use alerts: Reduce stress, stop staring at charts.
Walk away after entry: Don’t let emotions interfere.
Fixed risk: 1–2% per trade, no exceptions.
Keep a trading journal: Track not only results but emotions behind decisions.
🏆 Why Discipline Separates Pros from Amateurs
Amateurs let the market control them.
Professionals control themselves.
In the long run, success doesn’t come from one “perfect trade” but from hundreds of disciplined executions.
📈 Conclusion
The market is uncontrollable. But you can control yourself.
Discipline is the edge that:
Protects your capital.
Stabilizes your mindset.
Turns strategy into consistent results.
💡 Community Question for TradingView:
👉 “Have you ever broken your stop-loss or take-profit rules? What did it teach you about discipline?”
Intraday Scalping Tips1. Understanding the Scalping Concept
Scalping is different from traditional intraday trading. While intraday traders may hold positions for several hours, scalpers aim to profit from very small price fluctuations that occur over minutes—or even seconds. Key principles include:
High Trade Frequency: Scalpers often make dozens of trades in a single day.
Small Gains: Each trade typically targets 0.1–0.5% profit.
Minimal Exposure: Trades are closed quickly to avoid major market risks.
Scalping is particularly effective in highly liquid markets like Nifty, Bank Nifty, or major blue-chip stocks where order execution is smooth and spreads are low.
2. Choosing the Right Stocks or Instruments
Not all stocks are suitable for scalping. Selecting the right instruments is critical for consistent profits. Key considerations include:
Liquidity: Highly traded stocks allow quick entry and exit.
Volatility: Moderate volatility provides enough price movement for scalping without excessive risk.
Tight Spreads: Stocks with narrow bid-ask spreads reduce transaction costs.
Market Depth: Strong support and resistance levels make prediction of price action more reliable.
Popular choices for scalpers in India include Nifty, Bank Nifty, HDFC Bank, Reliance, and Infosys, as they provide both liquidity and predictable movement patterns.
3. Time Frame Selection and Chart Analysis
Time frame selection is critical in scalping since trades are short-lived:
1-Minute and 5-Minute Charts: Most scalpers rely on very short time frames for identifying entry and exit points.
Tick Charts: Some traders use tick charts to focus on the number of trades instead of time intervals, offering precision in fast markets.
Indicators: Common indicators include:
Moving Averages: For trend confirmation.
Relative Strength Index (RSI): To spot overbought/oversold conditions.
Volume Indicators: Confirm breakout strength and liquidity.
Chart patterns like flags, pennants, and micro-trends are also useful for short-term trade setups.
4. Setting Precise Entry and Exit Points
Successful scalping relies on strict entry and exit discipline:
Entry Rules: Enter trades when technical indicators align (e.g., price breaks a micro-resistance on high volume).
Exit Rules: Always set a pre-determined profit target (e.g., 0.2–0.5%) to avoid greed.
Stop-Loss Discipline: A tight stop-loss (0.1–0.3% below entry price) prevents small losses from becoming large.
Risk-Reward Ratio: Even for small profits, maintain a risk-reward ratio that ensures overall profitability.
Automation tools like bracket orders in NSE allow traders to simultaneously set stop-loss and target levels.
5. Capital Management and Trade Sizing
Proper capital management is crucial to survive in high-frequency scalping:
Small Position Sizes: Avoid risking too much on a single trade.
Leverage Management: Use leverage cautiously; while it magnifies profits, it also amplifies losses.
Diversification: Spread trades across multiple instruments to reduce concentration risk.
Daily Loss Limits: Decide beforehand how much you can lose in a day and stick to it—emotional control is key.
Even small profits can accumulate when losses are strictly controlled.
6. Using Technology for Speed and Accuracy
Scalping is a speed-driven strategy, making technology a critical factor:
Direct Market Access (DMA): Enables faster order execution compared to traditional brokers.
Low Latency Trading Platforms: Platforms like Zerodha Kite, Upstox Pro, and Interactive Brokers help reduce slippage.
Hotkeys and Advanced Orders: Pre-set hotkeys speed up entries and exits.
Real-Time Data Feeds: Access to live market data is essential for micro-trend identification.
Automated scripts and algorithmic tools can also be employed to execute scalping strategies without hesitation.
7. Psychological Discipline and Emotional Control
Scalping is mentally demanding due to rapid decision-making:
Avoid Overtrading: Even if setups are frequent, wait for high-probability signals.
Embrace Small Wins: Focus on cumulative gains rather than single trades.
Detach from Emotions: Fear and greed can destroy scalping strategies in seconds.
Routine and Focus: A disciplined pre-market routine enhances performance.
Mental fatigue can lead to poor execution, so breaks and mental preparation are crucial.
8. Continuous Learning and Strategy Adaptation
Markets are dynamic, and scalping strategies must evolve:
Review Trades Daily: Maintain a trade journal to track setups, wins, and losses.
Backtesting: Test strategies on historical data to identify strengths and weaknesses.
Adapt to Market Conditions: Scalping in trending markets differs from range-bound markets.
Stay Updated: Economic events, corporate news, and global market movements can drastically affect intraday behavior.
Continuous refinement ensures long-term profitability and helps scalpers stay ahead of changing conditions.
Conclusion
Intraday scalping is a high-speed, high-discipline trading approach that rewards precision, strategy, and emotional control. Success depends on selecting the right instruments, leveraging technology, maintaining strict risk management, and continuously learning from market behavior. While scalping can offer consistent profits, it is not suitable for everyone due to its demanding nature. Traders who combine discipline with strategic execution and adaptive methods can use scalping to capitalize on micro-movements in the market and achieve steady gains over time.
Gold Outlook: Eyeing $4,000 – Fibo Expansion Zones in PlayGold continues to benefit from safe-haven demand as political risks in Washington and mixed U.S. data keep investors cautious. The metal is trading inside a clear bullish channel, with Fibonacci projections suggesting further upside before any major correction.
📊 Technical Deep Dive – H4 Structure
🔹 Fibonacci Confluence
The current rally respects 0.618 retracement at $3,820 and 0.786 retracement near $3,872, confirming algorithmic order flow.
Next expansion points are sitting at Fibo 1.5 – 1.618 ($3,995 – $4,003), a major liquidity target where reactions are likely.
🔹 Liquidity Pockets
$3,820 – $3,828: Historical demand block + Fibo 0.618, strong buy reaction zone.
$3,860 – $3,872: Active reaction layer, intraday support if retested.
$3,995 – $4,003: Key sell reaction zone, a liquidity grab area before possible retracement.
🔹 Candle & Flow
Breakout candles show strong momentum, pushing price toward untested liquidity.
However, multiple tests of $3,895 signal distribution pressure ahead of the $4,000 test.
🎯 Trade Playbook
🟢 Bullish Setup (Main Play)
Entry: $3,860 – $3,872
Targets: $3,895 → $3,995 → $4,003
Stop: Below $3,850
🔵 Deep Buy Setup (Aggressive)
Entry: $3,820 – $3,828
Targets: $3,872 → $3,895
Stop: Below $3,808
🔴 Countertrend Short (Scalp)
Entry: $3,995 – $4,003
Targets: $3,970 → $3,950
Stop: Above $4,010
⚡ Key Insights
Watch for a $4,000 liquidity sweep – could trigger either breakout continuation or sharp pullback.
If $3,860 support fails, deeper correction into $3,820 is expected before next rally.
H4 close above $3,895 strengthens bullish bias toward $4,003+.
📌 Question for traders: Will Gold break $4,000 and run, or is this a setup for a liquidity trap before correction? Share your view 👇

Gold Correction: Fed Warning vs. Massive Safe-Haven Flows Hello, traders!
Gold pulled back to $3,845.78/oz after Dallas Fed President Lorie Logan called for caution regarding further rate cuts.
Fundamentals: Fed Warns, But the Buying Wave is Unstoppable
The market stands at a crossroads:
Downward Pressure: The caution signal from Fed's Logan.
Upward Momentum: Government shutdown (increases instability, delays jobs report), weak private sector jobs data (down 32k), and SPDR Gold Trust ETF holdings rising to the highest level since 2022.
Conclusion: Political instability and weak economic data continue to reinforce the likelihood of a Fed rate cut. Massive safe-haven capital is flowing into Gold.
Technical Analysis & Strategy
Gold retreated to the FIBO 0.618 - 0.5 zone, indicating a healthy technical correction after the sharp rally. Priority remains Buy if the price holds above $3861. Be cautious of Stop Loss hunting.
Resistance: $3870, $3884, $3894
Support: $3855, $3833, $3798
Trading Strategy (Tight SL):
BUY SCALP: $3838 - $3836 / SL: $3832 / TP: $3846 - $3857
BUY ZONE: $3798 - $3796 / SL: $3788 / TP: $3816 - $3836
SELL ZONE: $3888 - $3890 / SL: $3898 / TP: $3870 - $3850
Do you think the Fed's warning is strong enough to reverse this trend? 👇
#Gold #XAUUSD #Fed #GovernmentShutdown #TradingView #PhânTíchVàng #ETF

XAUUSD – Price Channel Rising Towards 4000 USD Next Week
Hello Traders,
Every day I share scenarios for you to refer to and build your own strategy. And here is the perspective for next week – as gold is in a sustainable uptrend, approaching the psychological mark of 4000 USD.
Technical Perspective
On the H4 frame, gold continues to move within a clear upward price channel.
Every time the price touches the support trendline, a strong rebound reaction appears, indicating that buying pressure still dominates.
This price channel has remained stable for many weeks, providing a basis for us to prioritise buying in line with the trend.
The target of 4000 USD is not far away, especially when the fundamental context continues to support the upward trend.
Fundamental Context
The market is expecting the Fed to continue cutting interest rates in October, creating momentum for gold.
Current US financial-economic news is limited, as the US Government remains shut down.
Geopolitical factors have somewhat cooled down, but gold still holds its position as an important safe-haven asset.
Trading Scenario
1. Buy (main priority):
Entry: 3860 – 3865 (at the rising trendline).
TP: 3960 – 4000.
SL: manage below the trendline.
2. Sell (backup if the channel breaks):
Condition: 3853 is breached.
At that point, a new trend will form and the Sell scenario will be activated.
Conclusion
Main trend: Buy in line with the rising channel, aiming for 4000 USD next week.
Sell should only be considered if there is confirmation of a break below 3853.
The market is in a critical phase, so be patient and wait for a good entry point to trade safely and effectively.

Gold Market In-Depth AnalysisGold Market In-Depth Analysis | A wave of "downtrading" sweeps across the market, poised for a breakout in gold prices
1. A New Market Paradigm: The Rise of the "Downtrading"
A recent report from JPMorgan Chase indicates that retail investors, driven by fear of missing out (FOMO), are pouring into alternative assets like gold, creating a "downtrading" trend. Driving factors include:
🛡️ Heightened geopolitical and policy uncertainty
💸 Concerns about "debt devaluation" and government deficits
🌍 Declining confidence in fiat currencies in emerging markets
🔄 Global assets shift away from the US dollar toward diversified allocations
II. Capital Flows and Market Structure
ETF demand explodes
GLD, the world's largest gold ETF, saw a record inflow of 35.2 tons in September
A single-day inflow of 18.9 tons was a record high, indicating accelerated capital inflows
Central bank gold purchases have become normalized
Global official gold reserves have increased by over 1,000 tons per year for three consecutive years
Gold has surpassed the euro to become the second-largest reserve asset
Speculative positions still have room to grow
CFTC speculative holdings are below their 2016 peak
ETF holdings remain far from their 2020 high, suggesting significant potential for incremental capital
III. Technical Analysis: A shakeout or a reversal? Key Levels
🟢 Support: 3840-3850 (bull-bear watershed) → 3820-3830 (strong support zone)
🔴 Resistance: 3890-3900 (previous high pressure zone)
Trend Analysis
The 4-hour chart shows wide range fluctuations at high levels. Yesterday's sharp drop was more of a wash-out than a trend reversal. Bulls have repeatedly reclaimed 3850 and tested its validity, maintaining the overall bullish trend.📊
IV. Trading Strategy and Risk Control
🎯 Main Strategy: Bullish with a volatile outlook, choose opportune positions
Long Position: Enter the 3860-3855 area, stop-loss at 3848, target 3870 (reduce position) → 3900 (hold if breakout)
Alternative Plan: If the market stabilizes at 3820-3830, re-enter long positions.
Risk Control Warning: A significant break below 3820 indicates short-term weakness, with a target of 3790-3800.
V. Forward Guidance
Data Focus: Another surprise in tonight's ADP and non-farm payroll data could reinforce expectations of a rate cut.
Breakthrough Signal: If gold prices stabilize at 3900, a new round of upside will begin. 🚀
Silver Linkage: Silver's bullish momentum is strong and may attract wider retail participation.
The "depreciation trade" trend is gaining momentum, and the foundation for a structural bull market in gold is solid! Seize the opportunity to layout after the market shakeout and follow the trend to win 💎
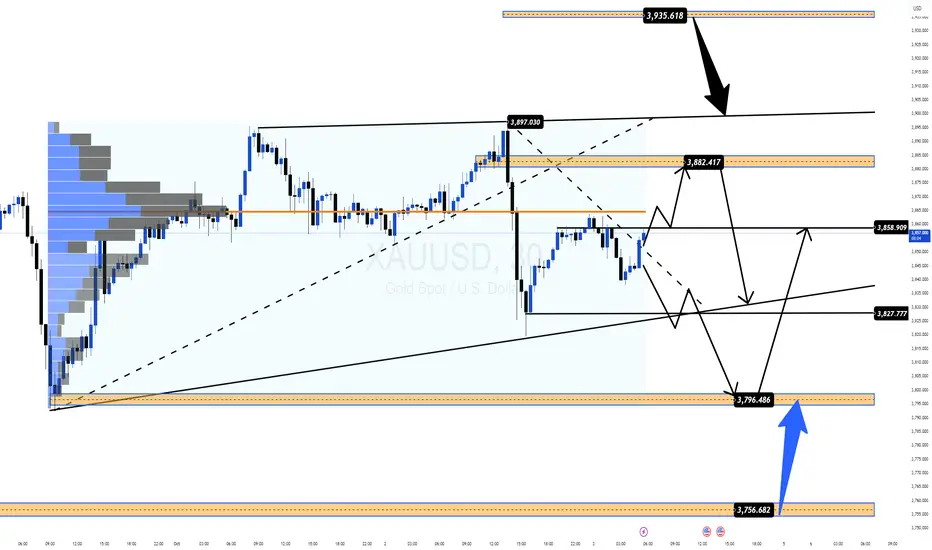
Daily Plan: Gold Targets 7th Straight Weekly Gain |MMFLOWTRADING📊 Market Context
Gold holds firm above $3,850, aiming for its 7th consecutive weekly gain.
🔥 Main driver: Risks from a prolonged U.S. government shutdown.
📉 54% probability of the shutdown lasting 29 days (Polymarket) → directly impacting gold sentiment.
🛡 Safe-haven demand & BUY-side FOMO keep fueling momentum.
⚖️ Still, profit-taking at higher resistance zones could trigger sharp swings before the next directional move.
🔎 Technical Analysis (H1/H4)
📈 Main trend: Bullish, but consolidating near 3,850.
🚧 Key Resistances: 3882–3884 & 3934–3936 (Liquidity Sell Zones).
🏦 Key Supports: 3797–3795 & 3756–3754 (Buy Zones).
🎯 Key Levels: 3850 – 3880 – 3900.
📈 Trading Scenarios & Plan
✅ SELL ZONE 1: 3882–3884
SL: 3890
TP: 3878 – 3874 – 3870 – 3865 – 3860 – 3850 – 3840 – ???
✅ SELL ZONE 2: 3934–3936
SL: 3940
TP: 3930 – 3925 – 3920 – 3910 – 3900 – ???
✅ BUY ZONE 1: 3797–3795
SL: 3790
TP: 3800 – 3810 – 3820 – 3830 – 3840 – ???
✅ BUY ZONE 2: 3756–3754
SL: 3750
TP: 3760 – 3770 – 3780 – 3790 – 3800 – ???
⚠️ Risk Management Notes
🌀 U.S. shutdown headlines may spark unexpected volatility.
🕵️♂️ Focus on BUY setups at support, avoid chasing FOMO at highs.
❌ Consider SELL only if clear rejection signals form at resistance zones.
✅ Summary
Gold remains supported by safe-haven flows, eyeing a 7-week winning streak.
🎯 Strategy:
BUY setups: 3797–3795 & 3756–3754.
SELL setups: 3882–3884 & 3934–3936.
📢 Follow MMFLOW TRADING for real-time updates & BIGWIN setups!
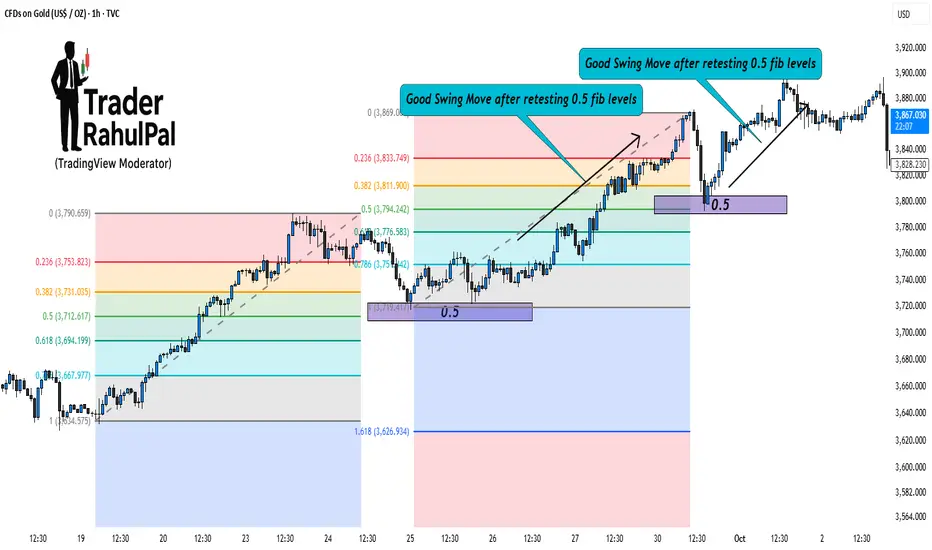
1 of the best Gold Swing Trading Strategy with Fibonacci Levels!Hello Traders!
Gold (XAU/USD) is a perfect instrument for swing trading because of its clean technical reactions.
One of the most reliable tools to trade gold swings is the Fibonacci retracement .
When used correctly, it helps you catch pullbacks and ride the next wave in the trend. Let’s break it down step by step.
1. Identify the Swing Move
First, find a strong impulse move on gold, either bullish or bearish.
This becomes your “anchor move” for drawing Fibonacci levels.
The idea is to wait for price to retrace part of this move before continuing in the main direction.
2. Draw Fibonacci Levels
Take the swing low to swing high (for bullish) or swing high to swing low (for bearish).
Mark key retracement levels: 38.2%, 50%, and 61.8% .
These levels often act as strong support or resistance zones for gold.
3. Look for Confirmation
Don’t trade blindly at a Fib level. Wait for confirmation like reversal candlesticks (pin bars, engulfing) or RSI divergence.
Volume spikes near Fibonacci zones also confirm institutional buying/selling.
4. Entry & Risk Management
Enter trades near 38.2%, 50%, or 61.8% retracements when confirmation appears.
Place stop loss just beyond the next Fibonacci level.
Set targets at previous swing highs/lows or Fibonacci extension levels like 127% and 161.8%.
5. Why It Works Well on Gold
Gold respects technical levels strongly due to high liquidity.
Institutions also use Fibonacci retracements to scale in and out of positions.
This makes Fibonacci one of the most effective tools for swing traders in gold.
Rahul’s Tip:
Always combine Fibonacci with structure. If a Fib level aligns with a key support/resistance, that zone becomes even stronger.
Conclusion:
Swing trading gold with Fibonacci retracements is simple yet powerful.
By focusing on impulse moves, waiting for retracements, and confirming with price action, you can trade gold with more confidence and less guesswork.
If this post gave you a clear strategy, like it, share your thoughts in comments, and follow for more practical gold trading setups!
SELL XAU USDThis setup on XAUUSD is based on a bullish reversal pattern. After multiple rejections near support, a long entry was taken with a defined stop loss below the recent swing low. The target is set at a 3.3 Risk-to-Reward ratio, aligning with momentum and price structure.
Entry: After bullish confirmation candle
Stop Loss: Below the rejection zone
Take Profit: At projected resistance zone (3.3R)
Reasoning: Price showed strong rejection wicks, increasing buy pressure, and higher volume support.
This trade idea focuses on risk management first — accepting a small controlled loss while targeting a larger potential gain.

Cross-Market Arbitrage Opportunities1. Understanding Cross-Market Arbitrage
Arbitrage is the simultaneous buying and selling of an asset to profit from price differences in different markets or forms. Cross-market arbitrage occurs when an asset, security, or derivative is traded across two or more markets (such as stock exchanges, commodity markets, or currency markets), and a trader exploits the temporary price mismatch.
1.1 Basic Concept
Imagine a stock listed on two exchanges—say, Exchange A and Exchange B. If the stock trades at $100 on Exchange A but $102 on Exchange B, a trader could theoretically buy at $100 on Exchange A and sell at $102 on Exchange B, locking in a risk-free profit of $2 per share (ignoring transaction costs). This opportunity exists because markets are not perfectly efficient at all times. Cross-market arbitrage seeks to exploit such temporary inefficiencies.
1.2 Importance in Financial Markets
Cross-market arbitrage contributes to:
Market efficiency: By exploiting price differences, arbitrageurs help align prices across markets.
Liquidity enhancement: Arbitrage strategies increase trading activity and liquidity.
Risk management: Investors use cross-market arbitrage in hedging strategies to manage exposure to price fluctuations.
2. Types of Cross-Market Arbitrage
Cross-market arbitrage can be categorized based on the types of assets, markets, and instruments involved. Below are the most common types:
2.1 Stock Arbitrage Across Exchanges
Stocks listed on multiple exchanges often exhibit price discrepancies due to differences in trading hours, liquidity, and investor behavior.
Example: An Indian company’s stock listed both on the NSE (National Stock Exchange) and BSE (Bombay Stock Exchange). If NSE trades at ₹1,000 and BSE at ₹1,005, arbitrageurs can buy on NSE and sell on BSE simultaneously.
2.2 Currency Arbitrage
Foreign exchange markets provide cross-market opportunities when the same currency pair trades at slightly different rates in different markets.
Triangular arbitrage is a common method, where traders exploit discrepancies among three currencies in different forex markets.
Example: USD/INR trades at 83.50 in New York and 83.60 in London. Buying USD in New York and selling in London can yield a profit.
2.3 Commodity Arbitrage
Commodities like gold, oil, and agricultural products are often traded in multiple markets. Price differences can arise due to storage costs, transportation costs, and market demand.
Example: Gold trades at $1,900 per ounce on the London Bullion Market and $1,905 in Mumbai. Traders can buy in London and sell in Mumbai after accounting for transaction costs.
2.4 Derivative and Futures Arbitrage
Arbitrage opportunities exist between the spot market and the futures market or across derivative exchanges.
Cash-and-carry arbitrage is a common example where traders buy an underlying asset in the spot market and sell futures contracts if the futures price is overpriced relative to the spot price.
Reverse cash-and-carry occurs when futures are underpriced.
3. Mechanics of Cross-Market Arbitrage
To execute a cross-market arbitrage strategy, traders follow these steps:
3.1 Identify Price Discrepancies
The first step is to monitor multiple markets and identify assets trading at different prices. Sophisticated traders use algorithmic systems, real-time data feeds, and market scanners to detect these differences within milliseconds.
3.3 Simultaneous Execution
Cross-market arbitrage requires executing buy and sell orders almost simultaneously to avoid market risk (the risk of prices changing before both trades are completed). This is often achieved through:
High-frequency trading (HFT) algorithms
Direct market access (DMA) platforms
Automated trading bots
3.4 Risk Management
Even “risk-free” arbitrage carries risks such as:
Execution risk
Liquidity risk
Regulatory restrictions
Currency or settlement risk in international markets
Professional arbitrageurs hedge these risks using derivatives or diversification strategies.
4. Popular Cross-Market Arbitrage Strategies
4.1 Dual-Listed Stock Arbitrage
Concept: Exploit price differences in a stock listed on two exchanges.
Example: Infosys Ltd., dual-listed in India and the US as ADRs (American Depository Receipts). Traders can arbitrage price differences between NSE/BSE and NYSE markets.
4.2 Index Arbitrage
Concept: Exploit differences between a stock index and its futures contract.
Mechanism: If the futures price is higher than the fair value implied by the index, traders buy the index components and sell futures simultaneously.
4.3 Cross-Currency Arbitrage
Triangular arbitrage involves three currencies. For instance, if USD/INR, USD/EUR, and EUR/INR exchange rates are misaligned, traders can make a profit by converting currencies sequentially.
4.4 Commodity Arbitrage
Traders exploit price discrepancies in commodities across global exchanges, often factoring in shipping, storage, and hedging costs.
Example: Oil traded in NYMEX versus Brent crude in ICE Europe.
4.5 Derivative Arbitrage
Exploiting differences between options, futures, and underlying assets.
Example: Convertible bond arbitrage, where traders hedge the bond portion and speculate on the stock portion to lock profits.
5. Advantages of Cross-Market Arbitrage
Risk-Adjusted Returns: Offers relatively low-risk profits when executed correctly.
Market Efficiency: Aligns prices across markets, reducing mispricing.
Liquidity Generation: Arbitrage trading increases market depth.
Diversification: Arbitrage can diversify an investor’s portfolio by introducing trades that are market-neutral.
Predictability: Unlike directional trades, arbitrage profits rely on price discrepancies rather than market trends.
6. Challenges and Risks
Despite being considered “low-risk,” cross-market arbitrage has challenges:
6.1 Execution Risk
Delays in order execution can erase profits. Markets move quickly, so any lag can turn an arbitrage opportunity into a loss.
6.2 Transaction Costs
Trading fees, broker commissions, and taxes can reduce or nullify arbitrage gains.
6.3 Liquidity Risk
Insufficient market liquidity can prevent traders from executing trades at desired prices.
6.4 Regulatory Risk
Different countries have distinct trading rules and capital controls, especially for cross-border arbitrage.
6.5 Currency Risk
For international arbitrage, fluctuations in exchange rates can impact profits.
6.6 Competition
High-frequency trading firms and institutional players dominate cross-market arbitrage, making it less accessible for retail traders.
7. Future Trends
AI-Powered Arbitrage: AI models will identify patterns and predict mispricings with greater accuracy.
Blockchain and Cryptocurrencies: Cross-exchange crypto arbitrage is gaining traction due to high volatility and fragmented exchanges.
Global Market Integration: Increased connectivity may reduce arbitrage opportunities but also create short-lived micro-opportunities.
Retail Access: As technology becomes more accessible, retail investors may participate in smaller-scale arbitrage.
8. Conclusion
Cross-market arbitrage is a sophisticated, yet fundamentally simple, trading strategy that capitalizes on temporary price discrepancies across markets. It requires speed, precision, and careful risk management. While large institutional players dominate this space, technology is gradually enabling wider participation.
Arbitrage benefits markets by enhancing efficiency, improving liquidity, and contributing to price discovery. However, it is not without risks. Transaction costs, execution delays, and regulatory hurdles are significant challenges. Understanding the mechanics, types, and tools of cross-market arbitrage is essential for traders seeking to profit in an increasingly competitive global market.
Ultimately, successful cross-market arbitrage combines market insight, technological proficiency, and disciplined execution, making it a cornerstone strategy for risk-conscious investors in the 21st century.

LiamTrading – Gold Plan: Wide Range + US Politics Exert PressureLiamTrading – Gold Plan: Wide Range + US Politics Exert Pressure
Gold continues to fluctuate within a wide range as market sentiment is heavily influenced by news from the United States. On 3rd October, the US Senate is expected to re-vote on the temporary budget bill. If it fails, the federal government could shut down, extending into the next week. This will undoubtedly have a significant impact on safe-haven flows, making gold more sensitive to key technical resistance zones.
📊 Technical Analysis – Chart H1
Gold is moving within a wide sideways structure, oscillating around strong resistance – support zones.
Fibonacci Resistance + Psychological level around 3878–3881 → suitable for short-term Sell scalping.
Confluence support (Retest + Volume) around 3828–3830 → ideal zone to watch for Buy, expecting a recovery wave.
The larger trend still leans towards an increase, however, in the short term, the market will experience several liquidity sweeps.
🎯 Trading Scenario
Sell (short-term – prioritise on M15):
Entry: 3878–3881
SL: 3886
TP: 3860 – 3855 – 3840 – 3822 – 3810
Buy (retest support + volume):
Entry: 3828–3830
SL: 3822
TP: 3845 – 3860 – 3877 – 3890
📌 Conclusion
Today's range is quite wide, suitable for scalping according to psychological resistance zones.
Short-term Sell at Fibonacci resistance points.
Buy when price retests confluence support with volume.
Political news from the US will be a catalyst causing significant gold volatility, so it's crucial to maintain disciplined capital management.
👉 Keep a close watch on the scenarios, I will update regularly as the market experiences new movements.

Elliott Wave Analysis XAUUSD – 10/03/2025📊
________________________________________
🔹 Momentum
• D1 timeframe: Momentum is currently declining → the corrective process is likely to continue until D1 enters the oversold zone and reverses.
• H4 timeframe: Momentum is preparing to turn upward → today we may see a bullish move.
• H1 timeframe: Momentum is heading into the oversold zone → the current H1 decline is weakening, which may lead to a bullish move aligned with H4. This potential rally could last for about 4–5 H4 candles.
________________________________________
🔹 Wave Structure
• D1: Price is still within the wave 5 target zone without a clear breakout. However, D1 momentum suggests that a corrective decline may continue.
• H4: An ABC structure has formed → the current rebound may be:
o The start of a new uptrend.
o Or part of a more complex correction.
• H1: Showing a rebound, which could be:
o Wave 1 of a new uptrend.
o Or wave A of a corrective 3-wave ABC move.
⏩ In either case, the current decline can be identified as wave 2 (purple) or wave B (blue).
• Downside targets:
o Zone 1: 3842
o Zone 2: 3830
Afterward, the market is expected to rise:
• If it is wave C → target equals wave A at 3885 (after 3842 support) or 3874 (after 3830 support).
• If it is wave 3 (purple) → minimum target = 1.618 of wave 1 (purple).
________________________________________
🔹 Trading Plan
Scenario 1
• Buy Zone: 3843 – 3841
• SL: 3833
• TP1: 3862
• TP2: 3874
• TP3: 3885
Scenario 2
• Buy Zone: 3831 – 3829
• SL: 3818
• TP1: 3862
• TP2: 3874
• TP3: 3885
________________________________________
👉 Main strategy: Look for buy entries around 3842 or 3830 support zones, targeting 3874 – 3885.

Gold Trading Plan | Limited Downside, Key Fibo Zones in Play🌍 Market Context
Gold is facing renewed selling pressure after yesterday’s bounce from the $3,820 area.
Risk-on sentiment and fresh USD buying are weighing on XAU/USD.
However, expectations of Fed rate cuts later this year and geopolitical tensions remain supportive, limiting deeper downside moves.
📊 Technical Analysis – Fibo Matrix Setup
🔴 SELL Reaction Zones
386x – 388x (Fibo retracement 0.5 – 0.618 + 0.786 confluence)
→ Intraday SELL scalp zone with strong rejection probability.
3881 – 3892 (Fibo 1.5 – 1.618 downtrend extension)
→ Key SELL liquidity zone for deeper rejection.
🟢 BUY Support Zones
3820 – 3819 (short-term recovery base) → Initial intraday support.
3795 – 3793 (Fibo 1.5 – 1.618 recovery zone) → Major liquidity pocket, ideal for BUY setups if tested.
🎯 Trading Scenarios
1️⃣ SELL Setup
Entry: 386x – 388x (watch rejection candlesticks).
Target: 3820 → 3795.
Stop Loss: Above 3892.
2️⃣ BUY Setup
Entry: 3795 – 3793 with bullish confirmation.
Target: 3860 → 3880.
Stop Loss: Below 3785.
⚡ Key Notes
USD momentum is crucial – if dollar strength continues, Gold may retest 379x zones.
Fed’s rate cut outlook and geopolitical headlines remain the “floor” for Gold.
Stick to clear Fibo reaction zones for best risk-to-reward setups.
💬 Community Insight:
Do you expect Gold to hold 3820 before bouncing, or will we see a flush into 379x liquidity?
Drop your setups below 👇

XAUUSD – Prioritise Sell After Breaking Trendline
Hello Traders,
Gold has experienced a strong upward movement for several consecutive days, but currently, the market is showing significant reversal signals. The upward trendline on H4 has been broken, confirming the weakening buying momentum. In the medium term, the preferred scenario will be selling rather than continuing to chase buys.
Basic Context
The US Treasury has just repurchased an additional 2 billion USD in bonds, raising the total repurchase this week to 4.9 billion USD. This move indicates an effort to stabilise the bond market but also reflects significant pressure on the USD and the US financial situation.
In the short term, the injection of additional bond liquidity makes gold's movement more unpredictable, and the trendline break at this time is an important warning signal.
Technical Perspective
Breaking the upward trendline → confirms a structural change.
MACD signals weakening, with buyers losing clear strength.
The 3865 – 3868 zone is a beautiful resistance retest point to Sell.
If the price falls deeply, the support zones around 3830 – 3810 – 3790 will be the next targets.
Today's Trading Scenario
Sell (main priority):
Entry: 3865 – 3868
SL: 3875
TP: 3855 – 3832 – 3810 – 3790
Buy Scalping (counter-trend – high risk):
Entry: 3803 – 3805
SL: 3795
TP: 3822 – 3835 – 3850
Conclusion
Gold has broken the trendline, prioritising Sell in the short and medium term.
News from the US bond market further emphasises the risk of instability, making counter-trend Buy moves suitable only for short-term Scalping.
Follow me for the earliest updates on scenarios as price paths change.

Gold Holds Above 3850 But Faces Resistance at 3890–95 ZoneAfter printing a rejection candle on Wednesday, gold followed up with further weakness yesterday, but once again bulls managed to defend and push the price back above 3850, securing a daily close above this level. This makes 3850 the immediate support to watch, and only a confirmed H4 close below it could open the door for a deeper test of the 3810–3800 zone, which remains the next key support area. The current price action suggests that the much-expected pullback is underway, though it looks more like a healthy cooldown rather than a reversal, as the broader structure remains bullish. On the upside, the 3890–3895 zone is acting as immediate resistance and will be the key hurdle for bulls in the short term.
