Gold Market Outlook – Bullish Trend Building MomentumGold continues to follow a structured bullish cycle, where each consolidation phase has been followed by a breakout and expansion. Market behavior shows liquidity being collected in sideway ranges, then released to fuel upward momentum.
At the current stage, price is trading around $3,870, showing signs of a potential short-term pullback to gather liquidity from the mid-zone. Once this corrective move stabilizes, the chart suggests a renewed bullish impulse with a projected upside target toward the $3,965 level.
This pattern highlights that the market remains in a controlled bullish phase, where temporary retracements are acting as setups for continuation rather than reversal. The underlying flow still favors higher levels as long as buyers maintain activity after corrections.
Trade ideas

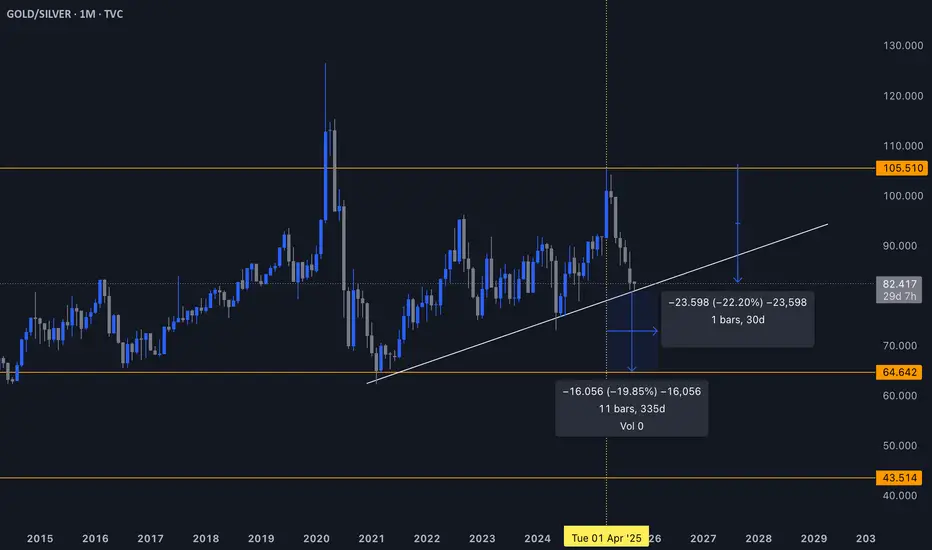
The Gold/Silver Ratio: Why It Matters So Much?The Gold/Silver ratio (GSR) measures how many ounces of silver it takes to buy one ounce of gold. It’s one of the oldest indicators in commodity markets, with data going back centuries.
Long-term average: ~65
Extreme high: 105 in 2020 (COVID panic, gold as pure safe-haven while silver crashed)
Current level: ~80
1. Why the Ratio Is So Powerful
When the GSR is high (above 90–100), it means silver is undervalued relative to gold.
When the GSR falls, it signals that silver is outperforming gold – usually during the most explosive parts of precious metals cycles.
In simple terms:
👉 High ratio = silver cheap
👉 Falling ratio = silver catching up/outperforming
2. The Recent Move
At the 105 peak (2020), silver was ignored and gold was everyone’s safe-haven. That extreme stretched the ratio to historic highs.
Since then, the ratio has broken down to ~80. This collapse in the ratio coincided with silver’s recent 48–50% rally since April 2025.
So there’s already a tight correlation between GSR falling and silver surging.
3. Forward Projection
If we assume the ratio continues mean-reverting towards its historical average (~65):
From 80 → 65 = a ~20% decline in the ratio.
Given how silver has tracked ratio moves so far, that could translate to another ~50% upside.
🖊️ That math gives me:
Current silver ~$50 → my target range $70–73
Which also aligns with the inflation-adjusted 2011 top of Quarterly Silver chart
This alignment across technical (Cup & Handle), ratio math, and inflation-adjusted targets strengthens the conviction.
4. Where This Gets Interesting
The GSR chart you provided shows a trendline break risk:
If the ratio decisively breaks down from ~80, it confirms silver is in outperformance mode.
A breakdown projects to ~65 (mean), and potentially overshoot lower if momentum builds.
Historically, when the GSR enters a sustained downtrend, silver rallies parabolically.
🎈 Key Takeaway:
The Gold/Silver ratio is not just a technical indicator here – it’s the bridge linking your macro thesis (ETF demand, industrial pull, Fed distrust) with your chart targets.
The ratio tells us that:
Silver’s catch-up has already started.
There’s room for another 50% upside.
This lands silver in the $70–73 zone – exactly where the inflation-adjusted 2011 high sits.
(XAU/USD) – Gold likely to touch $4,000/oz: Ideal buying levels?1. Market Structure & Trend Outlook
On the H1 chart, gold is sustaining its bullish structure with higher highs and higher lows.
After the BoS (Break of Structure), price retraced near 3,862 Buy Zone and bounced upward.
At present, price trades above EMA34 and EMA89, keeping bullish bias intact.
2. Important Levels
Buy Zone: 3,862 – 3,865. Acts as short-term support. Holding above strengthens the bullish case.
OB1: 3,806 – 3,810. Next support in case Buy Zone breaks.
OB2: 3,763 – 3,770. Deeper support, triggered only if market corrects heavily.
Sell Scalping Zone (Fibo): 3,912. A short-term resistance, profit booking expected.
Sell Zone / ATH: 3,933 – 3,935. Breakout here may lead to fresh record highs.
3. Trade Setups
Bullish Setup: Buy on retest of 3,862 – 3,865.
SL: Below 3,850.
TP1: 3,912.
TP2: 3,933 – 3,935.
Bearish Setup (Defensive): If below 3,860, expect test of 3,806 – 3,810.
If this fails, price may decline towards 3,763 – 3,770.
4. Conclusion
Trend remains positive on H1. Best strategy: Buy on dips near support, manage SLs carefully, and book partial profits near resistances. Sustaining above 3,933 may open doors for new highs.

US Government Shutdown Sends Gold Flying HigherWhat's Happening With Gold?
Gold continues recording new high despite monthly RSI reading of 89-90 signalling extremely overbought conditions and casual pullbacks are attracting buyers on any dip towards value areas resuming higher high and higher low structure which is precisely bullish.
Disappointing ADP numbers keep dollar under pressure and Gold gets substantial support as bond yields remain neutral or dull.
Recent record high of $3895 witnessed a minor pullback to $3852 which was quickly absorbed by buyers retesting $3893 today and prices stand at striking distance of record high.
What's Driving the Bullish Rally?
Fundamental Drivers:
The US government shutdown and fiscal stress has caused global concerns triggering increased bets for risk off sentiments driving investors for higher Gold prices on safe haven buying.
Continued Dollar Weakness below critical resistance 98 is supportive for dollar denominated Gold reducing opportunity cost of holding the non yielding asset.
Sticky Inflation makes Gold a preferred hedge against inflation as store of value.
Geo political concerns across Europe, mid east keep safe haven demand strong and boost Gold prices further.
Robust buying by major Central Banks create further structural demand for Gold as several central banks continue increasing Gold in reserve than dollar and no central bank selling Gold despite record high prices.
Any surprise hawkish message from the Fed members or strong economic data can cause a pullback in Gold prices while any dovish tone by Fed will further boost Gold prices.
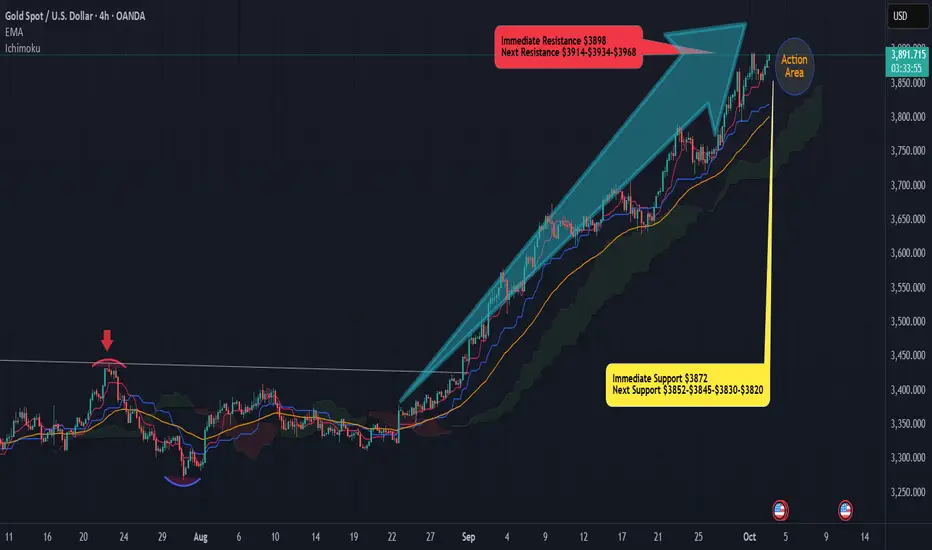
Technical Drivers:
Technical structure is still bullish favouring further continuation supported by price stability above immediate support $3852 and moving within a strong ascending bullish parallel channel as seen on the 4 hourly chart while further bullish extension requires strong break and stability above immediate resistance $3898 which targets next leg higher $3914 followed by $3934
Overbought conditions on Monthly RSI reading 89-90 urges caution on heights as break below crucial support may trigger profit booking pressure, especially if some news about potential agreement on US shutdown strengthens dollar and treasury yields.
If Gold breaks below $3872, expect a retest of $3860-$3858 while break below $3852 will expose $3845 followed by $3830-$3820
Elliott Wave Analysis – XAUUSD 2/10/2025🔎
________________________________________
Momentum
• D1 timeframe: Momentum is preparing to reverse → this signals that the bullish trend is becoming very weak.
• H4 timeframe: Momentum is turning upward → today we may see a recovery move, with price either rising further or moving sideways to push H4 momentum into the overbought zone.
• H1 timeframe: Momentum is about to enter the overbought zone → the recovery continues for now, but once H1 reverses inside the overbought zone, the next downward move may begin.
________________________________________
Wave Structure
• D1 timeframe
o Price reached the second target yesterday.
o Momentum on D1 is showing signs of reversal → if today closes with a bearish candle, it may confirm that the yellow wave 5 top has been completed.
o In that case, a 3-wave correction on D1 will unfold.
o The duration of this correction will likely be longer than the previous yellow wave 2 and wave 4 corrections.
• H4 timeframe
o A downward move has completed, and momentum is turning upward.
o If H4 enters the overbought zone without creating a new high, it provides strong evidence that the purple wave 5 has been completed.
o The current structure shows the confluence of multiple wave 5s, fulfilling the condition of an ending diagonal triangle:
Features: new highs and new lows are created, but they become progressively smaller, forming a rising triangle.
Once completed → a sharp decline is expected.
• H1 timeframe
The structure is noisy, so we consider 2 scenarios:
Scenario 1 – Black wave 5 has already completed
o Price is currently in a corrective structure.
o Combined with H4 momentum reaching the overbought zone and reversing:
If price fails to break above 3897, then:
1. Price drops from the current level 3866 → toward 3830. Then retraces back to 3865 → this offers a very good shorting opportunity.
2. Price rallies to 3885 → but only if H4 momentum is in the overbought zone and starts to weaken → this also provides a great short setup.
Scenario 2 – Price breaks the high
o In this case, we consider the possibility of an ending diagonal triangle, combining channel structure and H4 momentum to find the short entry.
________________________________________
Trading Plan
• Although we already have potential targets, placing limit orders at this stage is not effective.
• The key condition to wait for: H4 momentum must reach the overbought zone and reverse → that will provide a clearer and safer entry.
• I will update the entry point once H4 momentum reaches the overbought zone, to avoid the same situation as yesterday: correct wave direction, but wide volatility caused stop-loss hits.

Gold Record: Shutdown 'Blinds' the Fed Hello, traders!
Gold shows absolutely no sign of slowing down, closing the October 1st session at $3,866.66/oz, while futures contracts hit a record high of $3,897.50/oz. The precious metal has climbed nearly 50% year-to-date and just set its 39th record high this year!
Fundamental Analysis: Shutdown Risk Hits at the Worst Time
While government shutdowns usually have a minor impact, the timing of this one is critical:
Delayed Jobs Data: The crucial jobs report (scheduled for Oct 3rd) will be postponed. This uncertainty will leave the market and the Fed 'blind' regarding the economy's health just weeks before the next policy meeting, triggering strong demand for safe-haven assets (Gold).
Threat of Staff Cuts: President Trump threatened to use the shutdown to cut "a lot of" federal employees, escalating tensions beyond typical closures and increasing political instability.
Technical Analysis & Trading Strategy
Gold accelerated past the $387x region during the US session, confirming the upward momentum is still very strong. However, the market is prone to more "Stop Loss hunting" (liquidity sweeps). Continue to Prioritize Buy, but manage SL carefully due to wider price swings.
Resistance: $3887, $3895, $3904
Support: $3870, $3854, $3843
Suggested Trading Strategy (Absolute Risk Management):
BUY ZONE
Zone: $3870 - $3868 / SL: $3860
TP: $3878 - $3888 - $3898 - $3908
SELL ZONE (High Risk)
Zone: $3903 - $3905 / SL: $3913
TP: $3895 - $3885 - $3875
Gold is running on a foundation of fear. Do you think the $3900 mark will be breached this session? 👇
#Gold #XAUUSD #ATH #Fed #GovernmentShutdown #TradingView #FinancialMarkets #RecordHigh

Buy gold time frame 15Good day everyone. My long position, which I expect to reach yesterday's high, is currently likely to form a bullish cup pattern. With a break of the 3880 level and a pullback to the same level, it could be a re-entry point. Be sure to observe risk management.

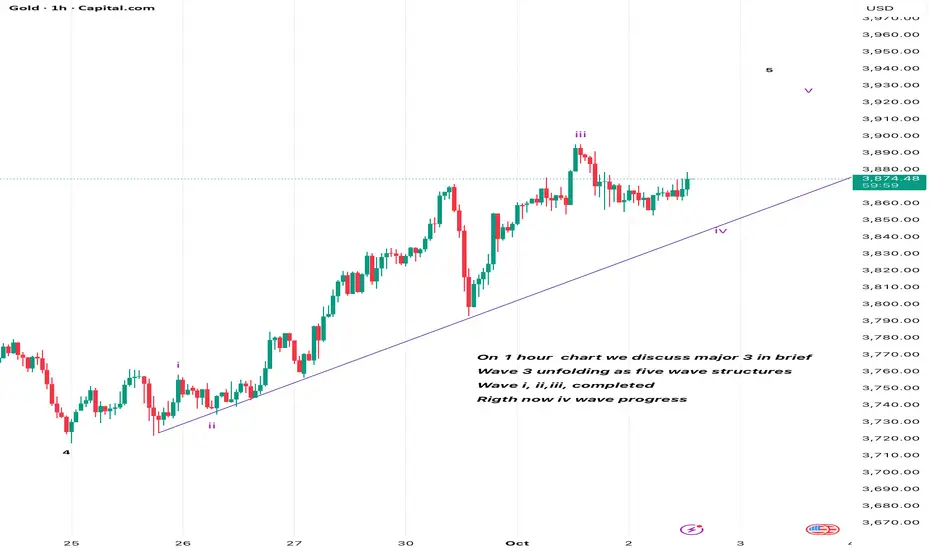
GoldOn 1 hour chart we discuss major 3 in brief
Wave 3 unfolding as five wave structures
Wave i, ii,iii, completed
Rigth now iv wave progress
Disclaimer : do research before before investing / do trade at your own risk
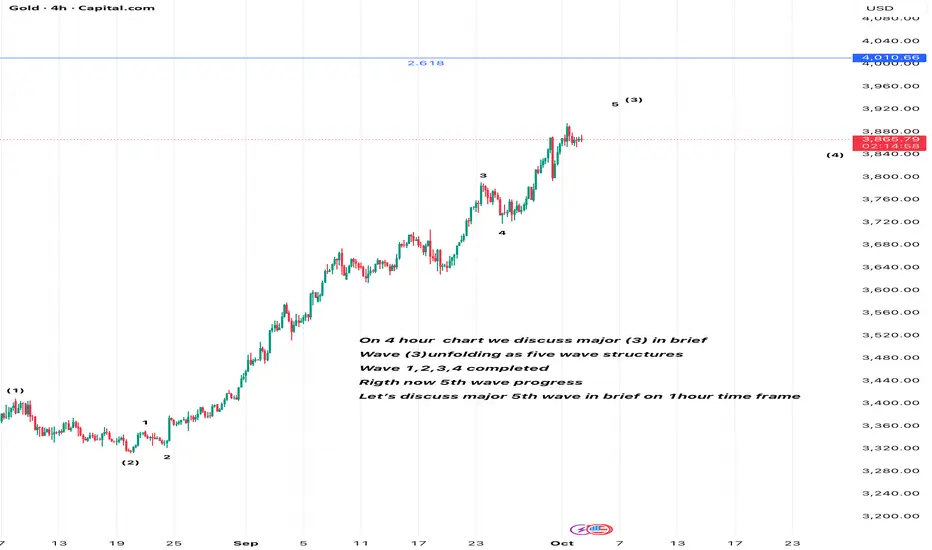
GoldOn 4 hour chart we discuss major (3) in brief
Wave (3)unfolding as five wave structures
Wave 1,2,3,4 completed
Rigth now 5th wave progress
Let’s discuss major 5th wave in brief on 1hour time frame
Disclaimer : do research before investing/ do trade at your own risk
GoldOn Daily chart we discuss major (v) in brief Right
Wave (v) unfolding as five wave structures
Wave (1)and (2)completed
Rigth now (3) wave progress
Let’s discuss major (3) wave in brief on 4 hour time frame
Disclaimer : do research before investing / do trade at your own risk

GoldOn weekly chart we discuss major (3) wave in brief
Major (3) wave unfolding as (i) (ii) (iii) (iv) (v)
Wave (i) ,(ii) ,(iii) and (iv) wave completed as you can seen in the chart
Wave (iv) completed as triangle
Right now (v) running as five wave structures
Lets discuss wave (v) in brief in daily time frame
Disclaimer : do research before investing / do trade at your own risk

GoldMonthly chart
As per elliot wave analysis
Major (1) and (2) wave completed
Right now major (3) wave progress
Let’s discuss major (3) wave on weekly chart
Disclaimer : do research before investing /Do trade at your own risk

Gold 1H – Will Liquidity Above 3903 Fuel Reversal?Gold on the 1H timeframe is consolidating near 3,872 after multiple ChoCHs, with the next liquidity cluster resting above 3903–3901. Market structure shows engineered liquidity sweeps possible at premium supply, aligning with short-term sell opportunities. On the downside, a defined FVG buy zone and discount demand around 3832–3834 provide scope for continuation if tapped.
From the macro side, traders remain cautious ahead of upcoming U.S. economic data, while a resilient dollar and persistent geopolitical risks in energy markets continue to shape volatility. This backdrop supports tactical plays: fading rallies into premium supply while preparing to join the move from discount demand zones.
________________________________________
📌 Key Structure & Liquidity Zones (1H):
• 🔴 SELL GOLD 3903–3901 (SL 3910): Premium liquidity sweep zone. Downside targets at 3880 → 3860 → 3845.
• 🟢 BUY ZONE SUPPORT 3832–3834 (SL 3825): Discount demand aligned with FVG mitigation. Upside targets at 3855 → 3875 → 3890+.
________________________________________
📊 Trading Ideas (Scenario-Based):
🔻 Sell Setup – Liquidity Sweep at 3903–3901
• Entry: 3903–3901
• Stop Loss: 3910
• Take Profits:
• TP1: 3880
• TP2: 3860
• TP3: 3845
🔺 Buy Setup – FVG Mitigation at 3832–3834
• Entry: 3832–3834
• Stop Loss: 3825
• Take Profits:
• TP1: 3855
• TP2: 3875
• TP3: 3890+
________________________________________
🔑 Strategy Note
Gold remains range-bound but liquidity-driven. Expect engineered sweeps above 3903 before deeper corrections, while discounted dips into 3832–3834 offer potential continuation setups. Flexibility is key: fade rallies at premium, but scale into buys if liquidity clears into discount demand.

BUY GOLD UNTIL WAVE 5 END - BIG SHORT IN NEXT 2 DAYS 📊 Trading Plan based on SMC + Elliott Wave
1. Market Context
SMC (Smart Money Concept):
Price is consolidating around a strong liquidity zone.
Evidence of a stop hunt / long squeeze before a potential reversal.
The 3820 – 3822 area acts as a Demand Zone, where Smart Money is likely accumulating buy orders.
Elliott Wave:
Current structure suggests we are in Wave IV (corrective phase).
A confirmed breakout above 3895 (previous ATH) would validate the start of Wave V, with Fibonacci targets around 3915 – 3920 (1.272 – 1.618 FE).
2. Trading Logic
🔺 Buy Setup (SMC-based)
Entry Zone: 3820 – 3822 (Demand Zone).
This zone is expected to hold as institutional liquidity support.
Ideal area to position for the anticipated Wave V rally.
🔺 Breakout Buy (Elliott confirmation)
Trigger: Clean breakout above 3895 (ATH) with confirmation.
Target: Expansion towards 3915 – 3920 (Fibo extensions).
This confirms Wave V continuation.
🔹 Short-term Sell (Scalping idea)
Entry Zone: 3913 – 3915 (Supply Zone + liquidity cluster).
Short-term reaction expected → possible retracement towards 3885 – 3870.
Note: This is counter-trend, only for scalping opportunities.
3. Trade Scenarios (SMC + Elliott Wave combined)
Price taps Demand Zone (3820 – 3822) → Long position targeting Wave V.
Breakout above ATH 3895 → Confirmation of Wave V → Continue long towards 3915+.
At 3913 – 3915 (Supply Zone) → Expect short-term reaction → Intraday short setup.
4. Risk Management
Stop Loss for Buys: below 3816 (Demand invalidation).
Stop Loss for Shorts: above 3920 (Supply invalidation).
Main bias = long (Wave V continuation).
Short trades = counter-trend only (scalping pullbacks).
👉 In summary:
SMC view: Trade around liquidity pools (Demand/Supply Zones).
Elliott view: Structure suggests Wave IV is ending, Wave V expansion is next → bias remains bullish.

I'M LOOKING MORE UP SIDE 3933 GOLD As per 30 min Trend line gold
Breakout trend line & trading in rang once range complete
support near 3852
Resistance near 3872
3895
Target 3933🌿🌊

XAUUSUS | Government Shutdown Confirmed | Gold awaits ADP & ISM🔎 Context & News
US Politics : The US government officially shut down after the Senate failed to pass the federal funding bill. A major political risk catalyst, triggering safe-haven flows into Gold.
FED : Probability of a -25bps rate cut in October rises to 96.2% → almost certain.
Key Events Today (ET / UTC) :
• ADP Employment Change: 08:15 ET / 12:15 UTC
• ISM Manufacturing PMI: 10:00 ET / 14:00 UTC
→ Both will be crucial data points that may shake Dollar and Gold.
📌 Summary : US politics + FED easing = Gold remains supported, but ADP & ISM tonight could spark strong volatility in the US session.
📈 Technical Analysis (H1)
Main Trend : Bullish after multiple BoS.
EMA : EMA 34 > EMA 89 → bullish momentum intact.
Resistance :
3,897 – 3,907 (Sell scalp – Fibo 0.5–0.618).
3,920 – 3,921 (Liquidity / ATH test).
Support :
3,872 – 3,876 (old high retest).
3,833 – 3,841 (OB zone).
3,814 – 3,822 (deep Support Zone – losing this shifts bias).
🎯 Trade Plan
✅ Buy (trend priority)
Buy Zone 1 : 3,872 – 3,876
• SL: 3,869
• TP: 3,897 → 3,907 → 3,920
Buy Zone 2 (OB) : 3,833 – 3,841
• SL: 3,826
• TP: 3,872 → 3,897 → 3,907
Buy Zone 3 (Deep Support) : 3,814 – 3,822
• SL: 3,808
• TP: 3,841 → 3,872 → 3,897
⚡ Sell (short scalps only – lower RR)
Sell Zone 1 : 3,897 – 3,907
• SL: 3,912
• TP: 3,885 → 3,876 → 3,841
Sell Zone 2 (ATH sweep) : 3,920 – 3,921
• SL: 3,925
• TP: 3,907 → 3,885 → 3,876
📝 Conclusion
Gold remains strongly supported by the US government shutdown + FED rate cut expectations.
Strategy today: Prioritize Buy at support; Sell only for short scalps around 3,907 – 3,921.
⚠️ Watch out: ADP & ISM tonight may trigger unexpected volatility → manage risk carefully and move SL to BE after TP1.
📢 If you find this Captain’s Log useful, don’t forget to Follow Captain Vincent ⚓ for the latest updates.
💬 What do you think, crew? Will Gold break ATH 3,920 right after ADP & ISM tonight?

XAUUSD – Maintaining the Core Uptrend (BUY Bias)
Hello traders,
On the H4 timeframe, gold continues to show a steady upward trend. After testing the upper trendline, price bounced back and is now consolidating around the 386x region. This suggests the market may be in an accumulation phase, awaiting major news.
Fundamental Context
Tomorrow, the market will look towards the release of the Nonfarm Payrolls (NFP) data, an event that often brings strong volatility to gold prices.
In addition, concerns around the potential US Government shutdown are adding to the macro uncertainty, further supporting gold’s safe-haven appeal.
At present, there is little evidence to suggest gold will decline, particularly when other markets are also breaking higher.
Technical Analysis
Price continues to trade within the ascending channel on H4, with buyers holding the advantage.
MACD remains above the zero line, showing no clear signs of weakness.
Price is likely to consolidate further in the 3860 – 3870 range before a sharp move triggered by news.
Trading Plan
Buy Setup (preferred – trend following)
Entry: 3829 – 3832
SL: 3825
TP: 3845 – 3862 – 3877 – 3890
Sell Scalping (counter-trend, higher risk)
Entry: 3927 – 3930
SL: 3934
TP: 3915 – 3900 – 3882 – 3865
Note: Sell setups should be treated only as short-term scalps, as the primary bias remains on the buy side.
Conclusion
Gold is holding firmly within the uptrend structure, with no significant weakness yet. Given the backdrop of political uncertainty and the upcoming NFP release, the priority remains buying at suitable support zones. Any sell trades should be viewed as quick reactions rather than core positions.
👉 Follow me to get the latest updates as soon as price structure changes.

Gold Trading Strategy for 02nd October 2025📊 Gold Intraday Trading Plan
👉 Timeframe: 15-Minute Candle Strategy
🟢 Buy Setup (Long Trade)
✅ Condition: Enter only if a 15-min candle closes above ₹3878
🎯 Targets:
₹3889
₹3899
₹3905
🛑 Stop Loss: Place below the candle low that gave the breakout
💡 Explanation
Wait for a 15-minute candle to fully close above 3878.
Do not enter if the price just spikes above – wait for the close to confirm.
Once confirmed, buy with the targets mentioned.
🔴 Sell Setup (Short Trade)
✅ Condition: Enter only if a 15-min candle closes below ₹3853
🎯 Targets:
₹3842
₹3831
₹3823
🛑 Stop Loss: Place above the candle high that gave the breakdown
💡 Explanation
Wait for the candle to close below 3853 before selling.
Enter only after confirmation, not during the dip.
Keep stop loss strict to protect capital.
⚖️ Key Notes
⏳ Be patient — confirmation matters more than speed.
🛑 Always use stop loss — never trade without it.
📉 Risk only a small portion of your capital (1–2%).
Record your trades and review them daily.
⚠️ Disclaimer
This is educational information only and not financial advice. Trading in gold or any market involves risk of capital loss. Please consult your financial advisor before making any investment or trading decisions.

Gold Market Analysis – Sell Opportunity Emerging in XAU/USDGold has been climbing with strong momentum, but the current leg is showing signs of transition. After a period of consolidation, the market expanded upward, taking liquidity from previous highs and creating an extended run. This behavior often reflects the final stage of a bullish cycle before rebalancing begins.
What stands out now is the engineered path of price: a push into untested liquidity zones above, followed by a potential shift as large players unwind positions. Once liquidity is collected at the extremes, price tends to rotate back into inefficiencies left behind during the rapid climb.
This suggests gold is not simply trending higher, but moving through a liquidity cycle. The near-term structure favors a sweep of higher levels, then a corrective phase where price retraces to refill imbalances and reset order flow for the next directional move.

Gold holding buy from 3820 , upside 3910,3955,3990Gold holding buy trade from 3820 , upside target 3910,3955,3990
How My Harmonic pattern projection Indicator work is explained below :
Recent High or Low :
D-0% is our recent low or high
Profit booking zone ( Early / Risky entry) : D 12.3% -D 16.1 % is
range if break them profit booking start on uptrend or downtrend but only profit booking, trend not changed
SL reversal zone (Safe entry ) : SL 23.1% and SL 25.5% is reversal zone if break then trend reverse and we can take reverse trade
Target : T1, T2, T3, T4 and .
Are our Target zone
Any Upside or downside level will activate only if break 1st level then 2nd will be active if break 2nd then 3rd will be active.
Total we have 7 important level which are support and resistance area
Until , 16% not break uptrend will continue if break then profit booking will start.
If break 25% then fresh downtrend will start then T1, T2,T3 will activate
1,3,5,10,15,20 minutes are short term levels.
30 minutes 60 minutes , 2 hours,3 hours, ... 1 day and 1 week chart positional and long term levels

spot gold or mcx gold update as per chartgold spot looks stair pattern or now news in focus usa shut down--
technical lvl- spot gold abv 3883 looks again up side 3900-3920--3945$ where support 3860$ which break blow with volume than more down fall 33852--42--34$ expect.
mcx gold sustain abv 118300 looks 119k near where support 117700 which can be create down correction in evening side.

ATH $3871: Shutdown Fear & 97% Fed Cut Fuel Gold Surge
Hello, investors and traders!
Gold continues to show phenomenal strength, setting a new ATH at $3,871.45/oz (on Sept 30), and closing at $3,843.43/oz. This gain confirms the strongest September since 2011, solidly confirming the explosive growth trend for the yellow metal.
Fundamental Analysis: Politics and the Fed Drive Buying Wave
Two core drivers are pushing gold prices higher, making any attempt to short (call the top) extremely risky:
Political Instability: The risk of a looming US Government shutdown is ratcheting up uncertainty and strongly boosting safe-haven demand.
Low-Rate Expectations: Weakening US jobs data has nearly locked in the probability that the Fed will cut interest rates in October. The market is currently pricing in a 97% chance of a Fed rate cut.
Technical Analysis & Trading Strategy
After a recent shock drop of 70 points, Gold quickly absorbed the selling pressure and created a new ATH, proving that buying pressure is overwhelming. The strong upward bias is undeniable.
Outlook: Continue to Prioritize Buy given the powerful trend and supportive fundamentals. Only attempt Sell strategies near psychological resistance levels with an extremely tight Stop Loss (SL).
Key Resistance: $3894, $3904, $3914, $3924
Key Support: $3869, $3843, $3834
Suggested Trading Strategy (Absolute Risk Management):
BUY SCALP
Zone: $3870 - $3868 / SL: $3864
TP: $3875 - $3885 - $3900
BUY ZONE
Zone: $3834 - $3832 / SL: $3824
TP: $3842 - $3862 - $3892
SELL SCALP (High Risk)
Zone: $3904 - $3906 / SL: $3910
TP: $3901 - $3891 - $3876
SELL ZONE (High Risk)
Zone: $3925 - $3927 / SL: $3935
TP: $3917 - $3907 - $3897 - $3887 - $3877 - $3867
The market is running on fear and rate-cut anticipation. Are you betting on the $3900 mark this week? 👇
#Gold #XAUUSD #ATH #Fed #GovernmentShutdown #TradingView #InterestRates #FinancialMarkets

XAUUSD – Gold Smashes to New ATH: Bulls in Full Control📊 Market Overview
Gold has surged into uncharted territory, breaking through to a fresh All-Time High (ATH). The earlier dip toward 3,800 USD acted as nothing more than a springboard, allowing buyers to reload before launching this powerful breakout.
Safe-haven demand continues to fuel the rally, as concerns over a potential US government shutdown and expectations of more Fed rate cuts strengthen bullish momentum.
📍 Crucial Levels to Watch
🔴 SELL Reaction Zone
3,911 – 3,915 (Liquidity Resistance) → Potential short-term ceiling, profit-taking may appear here.
🟢 BUY Reaction Zones
3,830 – 3,820 (Fibo Support) → First pullback level for intraday buyers.
3,808 – 3,810 → Secondary support zone for a deeper correction.
3,747 – 3,752 (Liquidity BUY Zone) → Stronger base for swing buyers.
🎯 Trading Setups
1️⃣ Buy the Dip (Primary Play)
Entry: 3,830 – 3,820, confirmation needed.
Targets: 3,900 → 3,915, extend toward 3,950+ if momentum remains strong.
Stop: Below 3,808.
2️⃣ Sell the Spike (Countertrend)
Entry: 3,911 – 3,915, only on visible rejection.
Targets: 3,871 → 3,830.
Stop: Above 3,922.
3️⃣ Swing Buy Opportunity
Entry: 3,752 – 3,747 (Fibo confluence).
Targets: 3,830 → 3,900.
Stop: Below 3,735.
⚡ Pro Tips
Trend bias = Strongly Bullish, prioritize long setups.
Countertrend shorts are tactical; keep stops tight.
Headlines from the US political scene and Fed could trigger extra volatility at highs.
💬 Discussion
Will gold extend to 3,950 – 4,000 USD, or is a sharp pullback around the corner? Drop your views and charts below 👇
