Gold Spot Price Technical Analysis [28-09-2025]Gold Spot Price Technical Analysis - Based on the chart, the XAU/USD daily chart shows an ascending triangle pattern, which is generally considered a bullish signal. The price is currently near a breakout level around 3435.06, with a potential target near 3900.00 if the upward trend continues. The RSI (14) at 74.53 suggests the asset is in overbought territory, which could indicate a potential pullback or consolidation.
Trade ideas

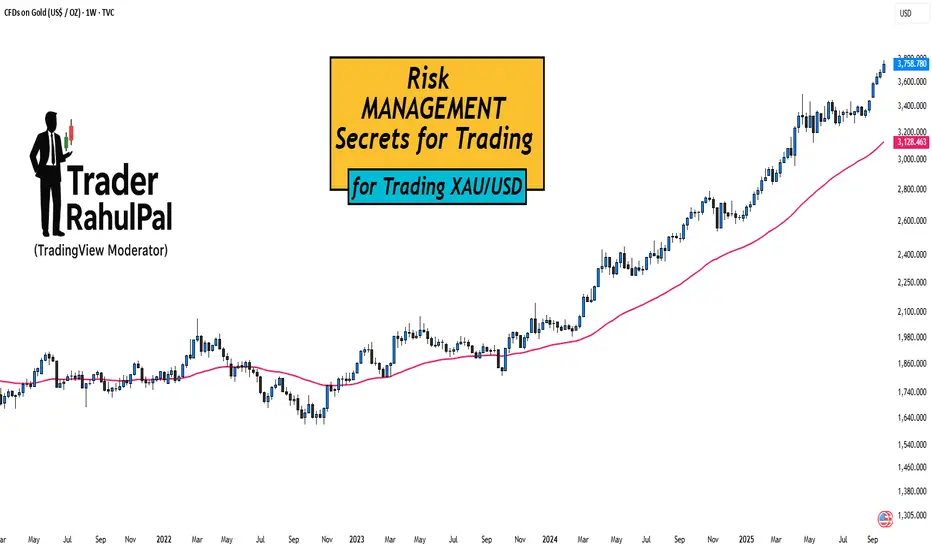
Risk Management Secrets for Trading XAU/USD!Hello Traders!
Gold (XAU/USD) is one of the most rewarding instruments, but also one of the most dangerous if you don’t manage risk properly.
Many traders lose not because their strategy is bad, but because they fail to protect their capital.
Here are some key risk management secrets every gold trader must know.
1. Position Sizing is Everything
Gold moves fast, a $5 move can wipe out accounts if the lot size is too big.
Always calculate position size based on risk per trade (ideally 1–2% of your account).
This way, even if you hit multiple stop losses, your account survives.
2. Wider Stops, Smaller Lots
Gold often spikes and hunts tight stop losses.
Use slightly wider stops, but reduce lot size to balance the risk.
This gives your trade room to breathe without increasing overall risk.
3. Never Trade News Without a Plan
During events like NFP, CPI, or Fed speeches, XAU/USD becomes extremely volatile.
If you’re not experienced, it’s better to stay out.
If you do trade, cut position size and expect slippage.
4. Daily Loss Limit
Decide in advance how much you can lose in one day (for example, 3% of account).
If that limit is hit, stop trading for the day.
This prevents emotional revenge trading, which is the biggest killer in gold trading.
5. Use Partial Profits
Gold reverses quickly, so book partial profits when the trade moves in your favor.
This locks in gains and reduces pressure.
Move stop loss to break-even once part profits are secured.
Rahul’s Tip:
Your job as a trader is not to catch every move, but to stay in the game .
Risk management may feel boring, but it’s the only reason why professional traders survive while retail traders blow up.
Conclusion:
In XAU/USD trading, strategy decides entries, but risk management decides survival.
By controlling lot size, stops, and emotions, you can make gold work for you instead of against you.
If this post helped you see risk management in a new light, like it, drop your thoughts in comments, and follow for more trading wisdom!
Gold awaits PCE | EMA squeeze, big waves ahead🟡 XAU/USD – 26/09 | Captain Vincent ⚓
🔎 Captain’s Log – Context & News
Trump : Announced a 100% tariff on branded drugs if not produced in the US → escalating trade tensions.
PCE tonight : The FED’s most important inflation gauge, key to shaping October rate cut expectations (current probability 91.09%).
The market is in “hold breath” mode, awaiting the PCE spark to decide the next direction.
⏩ Captain’s Summary : Gold is squeezed between two winds – short-term EMA pressure and major expectations from PCE.
📈 Captain’s Chart – Technical Analysis
EMA : EMA 34 (yellow) remains below EMA 89 (red) → short-term bearish pressure persists, but narrowing gap signals big volatility ahead.
Golden Harbor (Support / Buy Zone)
3,738 – 3,730
3,718
3,687
3,651
Storm Breaker (Resistance / Sell Zone)
3,755 – 3,773
🎯 Captain’s Map – Trade Plan
⚡ Sell (scalp at resistance)
Entry: 3,773 – 3,776
SL: 3,783
TP: 3,755 – 3,745 – 3,734
✅ Buy (trend-follow priority)
Buy Zone 1 (Scalping)
Entry: 3,72x – 3,718
SL: 3,710
TP: 3,750 – 3,769 – 3,776
Buy Zone 2 (Deeper OB)
Entry: 3,685 – 3,683
SL: 3,675
TP: 3,690 – 3,695 – 3,700 – 3,705 – 3,7xx
⚓ Captain’s Note
“The Golden sails are being squeezed between EMA 34 & 89. Golden Harbor 🏝️ (3,734 – 3,683) remains the safe dock for sailors to await the big wave. Storm Breaker 🌊 (3,773 – 3,776) is raising fierce waves, only suitable for short Quick Boarding 🚤 scalps. Tonight’s PCE will be the decisive wind – either pushing the ship beyond 3,78x or forcing it back to retest 3,72x.”
📢 If you find Captain’s Log useful, don’t forget to Follow for the latest updates.
💬 What do you think? Will Gold break through 3,78x or retest 3,72x first?

Part 6 Institutional TradingPart 1: Role of Implied Volatility
Implied volatility (IV) reflects market expectations of future price movement.
High IV → Expensive options, profitable for sellers if volatility drops.
Low IV → Cheap options, profitable for buyers if volatility rises.
IV is a key factor in selecting strategies and timing trades.
Part 2: Time Decay in Options (Theta)
Options lose value as expiration approaches due to time decay.
Long options: Lose value over time if price doesn’t move.
Short options: Benefit from decay as premium erodes.
Understanding time decay is critical for timing trades.
Part 3: Hedging with Options
Options are powerful hedging tools:
Protect portfolios from market downturns using puts.
Lock in future prices for commodities.
Reduce risk while maintaining upside potential.
Hedging requires understanding correlation and position sizing.
Part 4: Speculation Using Options
Options allow leveraged speculation:
Small capital can control large positions.
Enables directional bets on bullish, bearish, or volatile markets.
High leverage carries high risk and potential loss of the entire premium.
Part 5: Options Market Participants
Key participants include:
Hedgers: Reduce risk from price fluctuations.
Speculators: Take positions for profit from price movements.
Arbitrageurs: Exploit pricing inefficiencies.
Market Makers: Provide liquidity by quoting bid and ask prices.
Part 6: Options on Indices vs Stocks
Stock Options: Based on individual stocks, more sensitive to company events.
Index Options: Based on market indices, less prone to individual stock risk.
Index options often used for hedging broad market exposure.
Part 7: Regulatory Environment
Options trading is regulated to ensure market integrity:
Exchanges like NSE, BSE in India; CBOE in the US.
Margin requirements for sellers.
Reporting and compliance rules.
Surveillance to prevent manipulation.
Part 8: Risks in Option Trading
Risks include:
Market Risk: Price moves against the position.
Time Decay Risk: Value erodes as expiration nears.
Liquidity Risk: Inability to exit positions at fair price.
Volatility Risk: Unexpected market volatility.
Proper risk management is critical for survival in options trading.
Part 9: Trading Platforms and Tools
Options are traded through online brokers and trading platforms:
Real-time data, option chains, and Greeks calculators.
Advanced platforms allow strategy backtesting.
Mobile apps support tracking and execution on-the-go.
Part 10: Conclusion and Best Practices
Option trading is a versatile financial instrument offering leverage, hedging, and income generation opportunities. Key best practices:
Understand the product before trading.
Focus on risk management, not just profit.
Start with simple strategies before moving to complex spreads.
Use Greeks to monitor risk and optimize trades.
Keep learning, as markets and strategies evolve continuously.
Options are powerful tools, but they require knowledge, discipline, and patience to trade successfully.

Elliott Wave Analysis XAUUSD – 28/09/2025
________________________________________
🔹 Momentum
• D1: Momentum is still declining → next week we may continue to see sideways movement or further downside following D1 momentum.
• H4: Momentum is also decreasing → on Monday, we expect a continuation of the downtrend.
• H1: Momentum is oversold and preparing to rise → during the Asian session on Monday, a short-term upward move is likely.
________________________________________
🔹 Wave Structure
• D1 timeframe:
o Price is still within wave 5 (yellow).
o If D1 momentum enters the oversold zone and then turns upward, but price remains sideways without reaching 3632, then wave 5 (yellow) may still extend toward the second target at 3887.
• H4 timeframe:
o A corrective WXY structure is forming.
o With H4 momentum turning down, it is likely that wave Y is unfolding.
• H1 timeframe:
o A declining ABC (blue) structure appeared, followed by a rising ABC (blue) structure toward 3784.
o Within this, wave B formed a triangle abcde (red).
o This shows two ABC (blue) corrective structures developing within the adjustment, suggesting multiple possibilities for wave Y:
1️⃣ Flat 3-3-5: Wave Y may unfold as a 5-wave sharp decline, with an ideal target around 3713 → this is the expected Buy zone.
2️⃣ Triangle: Price may consolidate sideways above 3718 → patience is required to wait for the pattern to complete.
3️⃣ Large-scale Triangle: If the entire correction is a triangle, price will also sideway above 3718 → wait for completion before acting.
• Note: If price breaks above 3792, it may confirm that the corrective structure is complete → next upside target would be 3810.
________________________________________
🔹 Trade Plan
• Buy Zone: 3714 – 3711
• SL: 3703
• TP: 3733
________________________________________
👉 Conclusion:
The optimal approach is to wait for confirmation:
• Either the triangle structure completes,
• Or price declines into the 3713 – 3711 zone to set up a Buy entry.

LiamTrading – Medium-term Gold Outlook H4Let's prepare the scenario for the new week, folks!
In my opinion, gold in the coming week may start to show a medium-term correction phase. However, it is important to note that nothing is absolutely certain on a larger timeframe. If you are trading intraday, stay closely aligned with price action to ensure higher accuracy.
Gold closed the weekly candle at 3759.85 – a price level that clearly indicates hesitation. The end-of-week session showed a rejection of price increase, mainly due to profit-taking pressure, so it cannot be immediately confirmed that a downtrend will begin.
The upward price channel is still strong, so it is essential to maintain a buying trend mindset to ensure the confidence in holding profits remains firm.
The upward structure is still stable, but the RSI has reflected a weakening in buying sentiment. To confirm a medium-term correction, gold needs to break 3720. At that point, a reasonable strategy would be to wait to sell around 3737–3740 (retracing to the trendline), targeting the support area coinciding with the highest volume profile cluster at 3645.
Conversely, the buying scenario will occur when:
- Price touches the 3735 boundary and a candle rejection reaction appears.
- Or gold breaks above the minor resistance at 3780, in which case you can buy immediately, with expectations towards the 3850 area.
Next week, be patient and wait for market confirmation to increase the probability of success. I will continue to share detailed scenarios in each trading session for everyone to stay updated.

XAUUSD – New Week Scenario on D1 FrameXAUUSD – New Week Scenario on D1 Frame: Prioritise buying, the 3790 – 3720 zone decides the trend
Hello Trader,
Trading is a journey, and the most important destination is conquering oneself.
On the D1 frame, gold has experienced a series of consecutive strong increases, indicating that buyers still maintain the advantage. The buying force shows no clear signs of weakening, even though gold has recently reacted with a slight decrease around 3790. Currently, the price is accumulating around 3760 – the closing candle zone for this week.
Basic Outlook
Political pressure from President Trump on the Fed is increasing, as the market expects an easing move soon. However, Chairman Powell remains cautious, prioritising price stability over inflation issues.
This factor may continue to keep gold in the position of an important safe-haven asset, especially in the context of policy uncertainty.
Technical Outlook
The price zone of 3790 – 3720 will play a decisive role in the medium-term trend for next week.
If 3790 is broken, gold will have the opportunity to advance to the Fibonacci Extension zone of 3822. Further, strong resistance lies around 3840 – 3860.
If 3720 is breached, selling pressure will retest the strategic support zone at 3650. This is also the confluence area with the upward trendline on D1.
MACD Indicator: continues to support buyers, the histogram remains positive, not showing a clear decrease signal.
Volume: no significant selling pressure has appeared, indicating that gold is entering an accumulation phase, waiting for a breakout.
Trading Scenario for Next Week
Buying Scenario (priority):
Buy around 3650 – 3660 (if there is an adjustment).
SL: below 3640.
TP: 3720 – 3790 – 3822.
Selling Scenario at Resistance:
Sell around 3822 – 3830 (Fibo + strong resistance).
SL: above 3840.
TP: 3790 – 3760 – 3720.
Conclusion
In the medium term, the upward trend still prevails. Next week, gold will revolve around the 3790 – 3720 mark, and reactions here will pave the way for the next trend. The priority strategy is to buy at the support zone of 3650, while observing reactions at 3822 to consider short-term selling orders.
Short-term scenarios will be updated during the day, helping you be more proactive with market fluctuations.
Follow me and the community to update the earliest scenarios

XAUUSD MULTI TIME FRAME ANALYSISHello traders , here is the full multi time frame analysis for this stock , let me know in the comment section below if you have any questions , the position will be taken only if all rules of the strategies will be satisfied. wait for more price action to develop before taking any position. I suggest you keep this pair on your watchlist and see if the rules of your strategy are satisfied.
🧠💡 Share your unique analysis, thoughts, and ideas in the comments section below. I'm excited to hear your perspective on this pair .
💭🔍 Don't hesitate to comment if you have any questions or queries regarding this analysis.

XAUUSD/GOLD WEEKLY BUY PROJECTION 28.09.25XAUUSD/Gold Weekly Buy Projection (27.09.25). Here’s a breakdown of what it shows:
Current Price Level: Around 3,759.85.
Technical Zones Marked:
Broke the Uptrend Line (earlier support turned resistance).
Bearish Engulfing Failed (bullish strength seen).
Fair Value Gap (FVG) near 3,740–3,750 zone, acting as a demand zone.
Projection Path:
Price expected to bounce from the FVG/demand area.
Then follow an upward zigzag movement toward the target zone around 3,860.
Trend Channel:
Multiple parallel blue channels drawn indicate a bullish structure.
Projection suggests continuation of the uptrend.
Target Price:
Marked close to 3,860, aligning with the upper channel line.
🔑 Summary of Projection:
Bias: Bullish
Entry Zone: 3,740–3,760 (Fair Value Gap zone)
Target Zone: 3,860
Risk Area: If price breaks below 3,720, projection may fail.
👉 Do you want me to prepare a trading plan (entry, SL, TP, and risk %) based on this projection for you?

A strong ongoing bullish trend but may be approaching exhaustionAs being in Wave 3, which is typically the longest and most powerful impulse wave in a trend. Within this larger Wave 3, the price appears to be in the final, smaller Wave 5. This suggests the immediate uptrend is still in progress.
Overall trend is clearly upwards, confirmed by the price action consistently making higher highs and higher lows within an ascending channel (blue dashed lines).
The next significant targets appear to be:
$3,836.264 (1.618 extension)
$3,894.613 (2.618 extension)
$3,937.569 (3.0 extension)

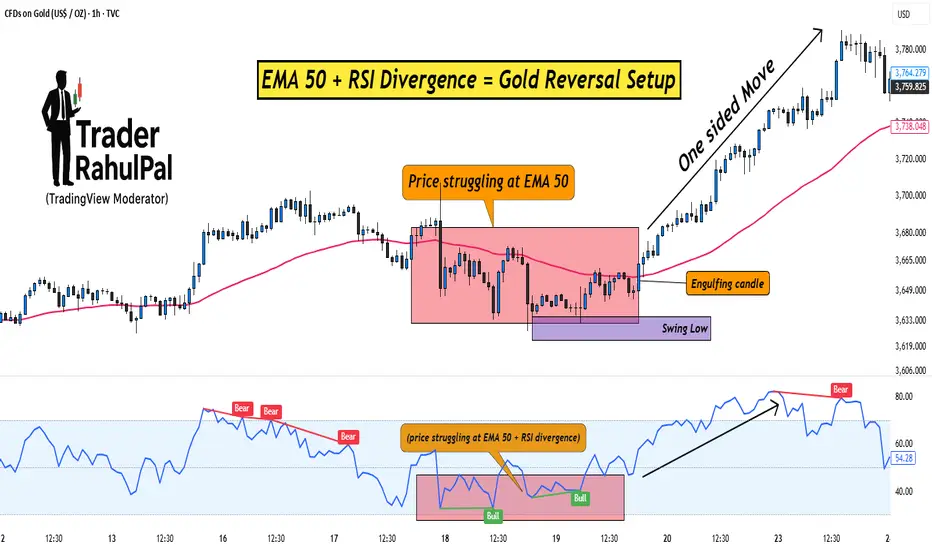
EMA 50 + RSI Divergence = Gold Reversal Setup!Hello Traders!
Gold often makes sharp one-sided moves, trapping traders who enter too late. But if you know how to combine a simple moving average with a momentum indicator, you can spot high-probability reversal setups.
One such method is using the EMA 50 together with RSI Divergence . Let’s break down how it works.
1. Why EMA 50?
The 50-period EMA acts as a dynamic trend filter.
When gold trades above it, the short-term trend is bullish; below it, bearish.
Price often retests the EMA 50 during pullbacks, making it a key level to watch for reversals.
2. What is RSI Divergence?
Divergence happens when price makes a new high/low, but RSI doesn’t confirm it.
Example: Price makes a higher high, but RSI makes a lower high → bearish divergence.
This signals that momentum is weakening, even if price is still moving strongly.
3. Combining EMA 50 with RSI Divergence
First, check where price is relative to EMA 50.
Next, look for divergence on RSI near that zone.
If both align (price struggling at EMA 50 + RSI divergence), chances of a reversal increase sharply.
4. Entry & Risk Management
Wait for a confirmation candle near EMA 50 (like engulfing or pin bar).
Place stop loss just above recent swing high/low.
Target the next support/resistance zone for exits.
Rahul’s Tip:
Don’t use divergence alone, combine it with EMA 50 for structure and you’ll filter out most false signals. This setup works best on higher timeframes like 1H or 4H for gold.
Conclusion:
EMA 50 gives you the trend filter, and RSI divergence reveals momentum weakness.
Together, they form a reliable reversal setup that helps you enter gold trades at the right time instead of chasing moves.
This Educational Idea By @TraderRahulPal (TradingView Moderator) | More analysis & educational content on my profile
If this post gave you a new setup idea, like it, share your thoughts in comments, and follow for more practical trading strategies!
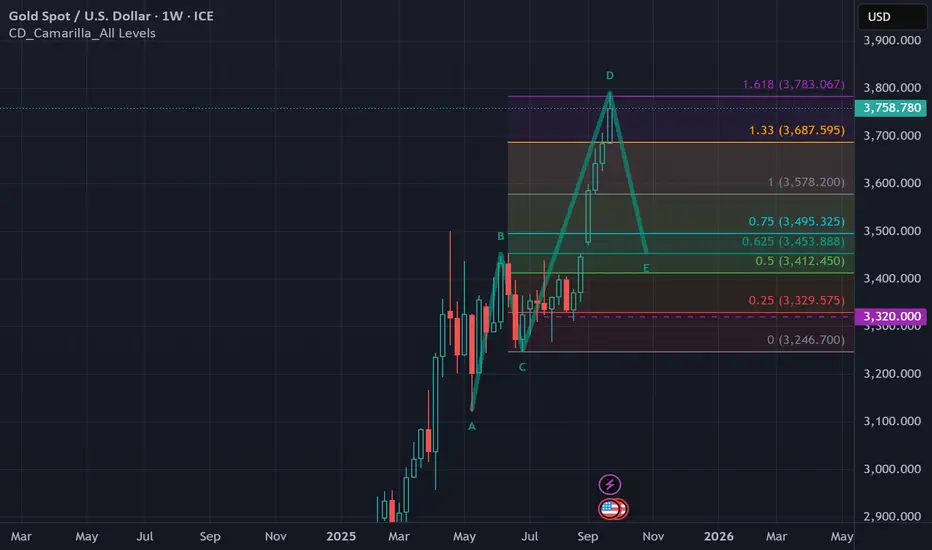
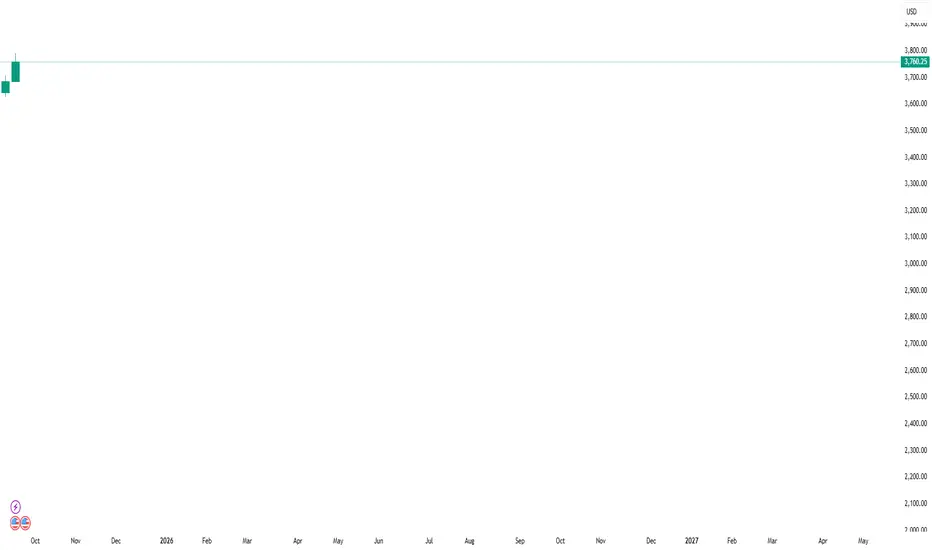
XAU - 1.618 level on 2 week swing chartInteresting to note that we have started to pull back on the 1.618 extension of the previous move on the 2 week swing chart. Only time will tell if we pull back to the 50% or even pull back to the exhaust gap.
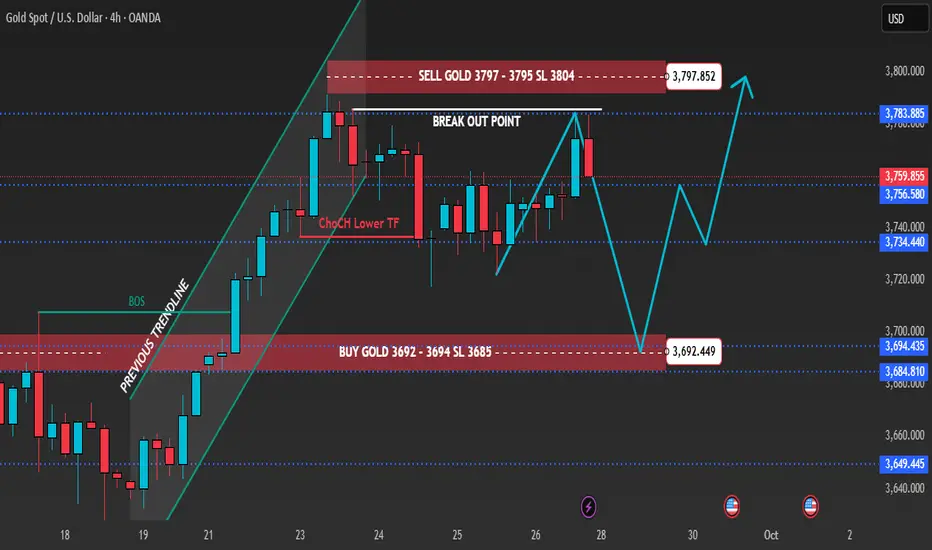
Back to 4H Frame – Fed & Inflation Shape Gold PathGold on the 4H timeframe is consolidating near premium supply after multiple liquidity sweeps. Recent U.S. inflation data kept the dollar resilient, while traders anticipate upcoming Fed commentary for clearer policy direction. Price rejected from the 3,795 supply pocket and is now retracing toward discount demand zones. Market structure suggests engineered sweeps below support before bullish continuation into Q4.
________________________________________
📌 Key Structure & Liquidity Zones (4H):
• 🔼 Buy Zone 3,692 – 3,694 (SL 3,685): Discount demand aligned with liquidity grab, ideal for continuation longs.
• 🔽 Sell Zone 3,795 – 3,797 (SL 3,804): Premium supply pocket where liquidity sweeps may trigger short-term rejections.
________________________________________
📊 Trading Ideas (Scenario-Based):
🔺 Buy Setup – Discount Demand Reaction
• Entry: 3,692 – 3,694
• Stop Loss: 3,685
• Take Profits:
TP1: 3,715
TP2: 3,740
TP3: 3,760+
👉 Smart money may engineer a sweep below 3,694 before reversing higher. Watch for bullish rejection patterns at demand.
🔻 Sell Setup – Premium Supply Reaction
• Entry: 3,795 – 3,797
• Stop Loss: 3,804
• Take Profits:
TP1: 3,780
TP2: 3,765
TP3: 3,750
👉 Short-term liquidity scalp opportunity against trend. Valid if price fails to break above breakout point.
________________________________________
🔑 Strategy Note
Bias remains bullish medium-term, but intraday sweeps into demand zones are expected as Fed officials continue to push cautious monetary guidance. Liquidity hunts around 3,795 supply and 3,694 demand will likely define the week’s volatility before a decisive breakout.
Introduction to Cryptocurrency & Digital Assets1. Understanding the Concept of Cryptocurrency
Cryptocurrency is a type of digital or virtual currency that relies on cryptography for security. Unlike traditional currencies issued by governments and central banks, cryptocurrencies operate on decentralized networks based on blockchain technology. The key characteristics of cryptocurrencies include:
Decentralization: There is no single authority controlling the currency. Transactions and the creation of new units are managed collectively by the network.
Digital Nature: Cryptocurrencies exist only in digital form; there are no physical coins or notes.
Cryptographic Security: Transactions are secured through advanced cryptography, ensuring privacy, integrity, and immutability.
Global Accessibility: Anyone with internet access can use cryptocurrencies, making them borderless and inclusive.
The first cryptocurrency, Bitcoin (BTC), was introduced in 2009 by an anonymous entity named Satoshi Nakamoto. Since then, thousands of cryptocurrencies have emerged, each with unique features and purposes.
2. Blockchain: The Backbone of Cryptocurrency
To understand cryptocurrencies, one must understand blockchain technology. A blockchain is a distributed ledger that records all transactions across a network of computers. Its key features include:
Immutability: Once data is added to the blockchain, it cannot be altered or deleted.
Transparency: All transactions are visible to participants in the network.
Decentralization: Data is not stored in a single location; it is shared across multiple nodes, preventing single points of failure.
Consensus Mechanisms: Cryptocurrencies rely on consensus algorithms like Proof of Work (PoW) and Proof of Stake (PoS) to validate transactions.
Blockchain is not limited to cryptocurrencies—it has applications in finance, supply chain, healthcare, and more.
3. Types of Cryptocurrencies
Cryptocurrencies can be categorized into several types:
3.1 Bitcoin and Its Variants
Bitcoin (BTC): The first and most well-known cryptocurrency, primarily used as a store of value.
Bitcoin Forks: Variants like Bitcoin Cash (BCH) and Bitcoin SV (BSV) emerged due to differing opinions on scalability and transaction speed.
3.2 Altcoins
Cryptocurrencies other than Bitcoin are called altcoins.
Examples include Ethereum (ETH), Litecoin (LTC), Ripple (XRP), and Cardano (ADA).
Altcoins often introduce unique features like smart contracts, privacy enhancements, or faster transaction times.
3.3 Stablecoins
Stablecoins are pegged to traditional currencies or assets to reduce volatility.
Examples: Tether (USDT), USD Coin (USDC), Binance USD (BUSD).
They are widely used for trading, payments, and as a hedge against market volatility.
3.4 Tokens
Tokens are digital assets issued on existing blockchain platforms like Ethereum.
Utility tokens provide access to a platform or service.
Security tokens represent ownership in an asset or company, often regulated by securities laws.
Non-Fungible Tokens (NFTs) are unique digital collectibles, representing art, gaming items, or real-world assets.
4. How Cryptocurrencies Work
Cryptocurrency operations involve several components:
4.1 Wallets
Digital wallets store public and private keys, allowing users to send and receive cryptocurrencies securely.
Hot wallets are connected to the internet (e.g., mobile apps), while cold wallets are offline, offering higher security.
4.2 Mining and Staking
Mining: Process of validating transactions in PoW blockchains like Bitcoin. Miners solve complex mathematical problems to secure the network and earn rewards.
Staking: In PoS systems, users lock their cryptocurrency to validate transactions and earn rewards.
4.3 Transactions
Every transaction is recorded on the blockchain as a block.
Transactions require network validation to prevent double-spending.
Once validated, the transaction becomes permanent and traceable.
5. Benefits of Cryptocurrencies
Cryptocurrencies offer several advantages:
Decentralization: Reduces reliance on banks and governments.
Transparency: Public ledgers prevent fraud and corruption.
Security: Cryptography ensures secure transactions.
Global Accessibility: Cross-border payments are fast and inexpensive.
Financial Inclusion: Unbanked populations can access financial services.
Programmable Money: Smart contracts enable automatic execution of agreements.
6. Challenges and Risks
Despite their potential, cryptocurrencies face challenges:
Volatility: Prices can fluctuate wildly, making them risky investments.
Regulatory Uncertainty: Governments have varying approaches, from embracing to banning cryptocurrencies.
Security Threats: Exchanges and wallets are vulnerable to hacks.
Lack of Consumer Protection: Transactions are irreversible, exposing users to potential losses.
Scalability Issues: Some blockchains struggle to handle high transaction volumes efficiently.
7. Digital Assets Beyond Cryptocurrency
Digital assets encompass a wider range of digital value, not limited to currencies:
7.1 Security Tokens
Represent ownership of real-world assets like stocks, bonds, or real estate.
Can be traded on digital exchanges with blockchain efficiency.
7.2 NFTs (Non-Fungible Tokens)
Unique tokens representing digital art, music, gaming items, or intellectual property.
Ownership is recorded on the blockchain, enabling provenance and authenticity verification.
7.3 Central Bank Digital Currencies (CBDCs)
Government-issued digital currencies.
Designed to combine the benefits of digital payments with regulatory oversight.
Examples: China’s Digital Yuan, the Bahamas’ Sand Dollar.
8. Cryptocurrency Exchanges and Trading
Cryptocurrency exchanges facilitate the buying, selling, and trading of digital assets. Types of exchanges:
Centralized Exchanges (CEX): Managed by companies; examples include Binance, Coinbase, and Kraken.
Decentralized Exchanges (DEX): Peer-to-peer trading without intermediaries; examples include Uniswap and SushiSwap.
Over-the-Counter (OTC) Desks: For large-volume trades, reducing market impact.
Trading involves strategies such as day trading, swing trading, and long-term holding (HODLing). Cryptocurrency markets operate 24/7 globally, making them highly liquid but also susceptible to sudden volatility.
9. Regulatory Landscape
Governments and regulators worldwide are defining frameworks for cryptocurrency:
Regulatory Approaches:
Some countries fully embrace cryptocurrency, providing clear guidelines (e.g., Switzerland, Singapore).
Others impose strict regulations or outright bans (e.g., China, Algeria).
Taxation: Profits from cryptocurrency trading are increasingly subject to capital gains tax.
Compliance: Exchanges may require KYC (Know Your Customer) and AML (Anti-Money Laundering) verification.
10. Use Cases and Applications
Cryptocurrencies and digital assets are more than investments—they have practical applications:
10.1 Payments
Instant, cross-border transfers with lower fees than traditional banking.
10.2 Decentralized Finance (DeFi)
Financial services like lending, borrowing, and trading without intermediaries.
10.3 Tokenization of Assets
Real estate, art, and other physical assets can be represented digitally, enabling fractional ownership.
10.4 Supply Chain and Provenance
Blockchain ensures traceability of goods from production to consumer.
10.5 Gaming and Metaverse
In-game assets and virtual real estate are increasingly tokenized as NFTs.
11. Investing in Cryptocurrencies
Investing in digital assets requires careful analysis:
Fundamental Analysis: Assessing technology, team, market potential, and adoption.
Technical Analysis: Using price charts, trends, and indicators to predict market movements.
Risk Management: Diversification, stop-loss orders, and investing only what you can afford to lose.
Cryptocurrency investment can be highly profitable but equally risky due to extreme market volatility.
12. The Future of Cryptocurrencies and Digital Assets
The future of cryptocurrencies and digital assets is promising yet uncertain:
Mainstream Adoption: Increased acceptance by businesses, governments, and consumers.
Integration with Traditional Finance: Banks and financial institutions exploring blockchain solutions.
Technological Innovation: Layer 2 solutions, interoperability, and scalability improvements.
Regulatory Clarity: Balanced regulations could stabilize markets and foster innovation.
Digital Economy: Cryptocurrencies may play a critical role in digital trade, decentralized finance, and the metaverse.
13. Conclusion
Cryptocurrencies and digital assets represent a revolutionary shift in how value is created, stored, and transferred. They combine the benefits of decentralization, security, and global accessibility while presenting challenges like volatility, regulatory uncertainty, and security risks.
Understanding blockchain technology, types of cryptocurrencies, and their applications is essential for investors, businesses, and policymakers. As adoption grows, digital assets are likely to become an integral part of the global financial ecosystem, reshaping money, finance, and commerce.
Cryptocurrencies are no longer just a technological experiment—they are a new paradigm in the world of money and finance. By navigating their risks and leveraging their potential, individuals and institutions can participate in the next frontier of the digital economy.
Gold upmove will continue until 3715 not break buy on dipGold comex updated levels, until 3715 not break buy in dip uptrend will continue, upside target 3855-3860 then 3930-3940
How My Harmonic pattern projection Indicator work is explained below :
Recent High or Low :
D-0% is our recent low or high
Profit booking zone ( Early / Risky entry) : D 12.3% -D 16.1 % is
range if break them profit booking start on uptrend or downtrend but only profit booking, trend not changed
SL reversal zone (Safe entry ) : SL 23.1% and SL 25.5% is reversal zone if break then trend reverse and we can take reverse trade
Target : T1, T2, T3, T4 and .
Are our Target zone
Any Upside or downside level will activate only if break 1st level then 2nd will be active if break 2nd then 3rd will be active.
Total we have 7 important level which are support and resistance area
Until , 16% not break uptrend will continue if break then profit booking will start.
If break 25% then fresh downtrend will start then T1, T2,T3 will activate
1,3,5,10,15,20 minutes are short term levels.
30 minutes 60 minutes , 2 hours,3 hours, ... 1 day and 1 week chart positional and long term levels
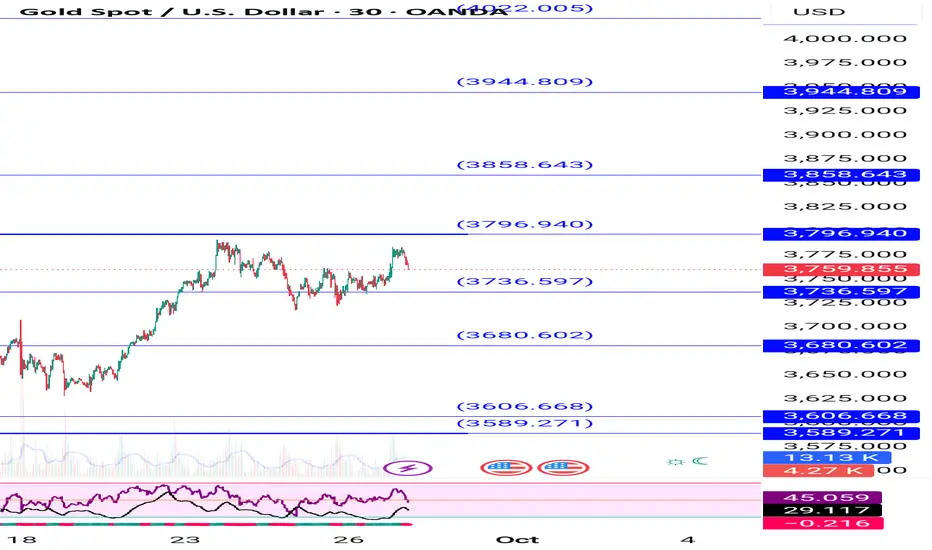
Gold (XAUUSD) Short ViewPrice faced rejection near the recent high and broke down from the consolidation zone, indicating potential bearish momentum. If the price sustains below 3778, we can expect a further decline toward 3767.

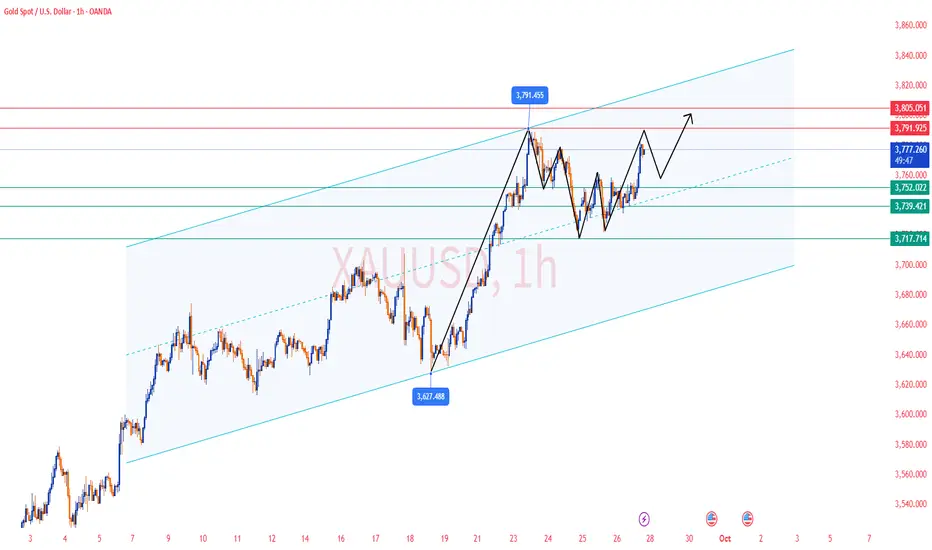
Gold Trading Strategy for Friday Late-Session✅ From the 4-hour chart, gold pulled back after hitting the 3791 high, dropping to the 3717 level, and then consolidating in the 3744–3755 range. The current candlestick has moved back above the MA5 and MA10 and is approaching the upper Bollinger Band, indicating that short-term bullish momentum is regaining strength.
The moving averages are turning upward in the short term, suggesting potential for further upside momentum. The Bollinger Bands are opening upward, with price near the upper band, showing the risk of a short-term rally but also the possibility of a pullback.
At present, gold is in a high-level consolidation phase, with a short-term bullish bias. However, dense resistance above makes a pullback likely after any rally.
✅ From the 1-hour chart, gold rebounded sharply after testing the 3722 level, reaching as high as 3783, and is currently consolidating near 3775. Consecutive bullish candles indicate strong short-term momentum.
The moving averages (MA5 and MA10) have formed a bullish alignment, showing a short-term uptrend. However, with the candlesticks approaching the upper Bollinger Band, a technical pullback may occur. The short-term trend remains bullish, and if price can hold above 3766, it may continue to test the 3783–3791 range, though there is still a risk of a rally followed by a pullback.
🔴 Resistance Levels: 3783 / 3791 / 3805
🟢 Support Levels: 3766 / 3752 / 3742
✅ Trading Strategy Reference:
🔰If gold pulls back to the 3766–3755 support zone and holds, consider entering long positions in batches, targeting 3783–3791.
🔰If gold rallies to 3783–3791 but faces resistance, consider light short positions, targeting 3766–3755.
🔥Trading Reminder: Trading strategies are time-sensitive, and market conditions can change rapidly. Please adjust your trading plan based on real-time market conditions. If you have any questions , feel free to contact me🤝
XAUUSDALWAYS TAKE TRADE WITH CONFIRMATION
Note : Trading in any financial market is very risky. I post ideas for educational purpose only. It is not financial advice. Do not hold us responsible for any potential loss you may incur. Please consult your financial adviser before trading.

Traders Watch Gold Surge Ahead of Fed’s Next MoveGold 1H – Consolidation Before Fed Clarity
Gold on the 1H timeframe is currently trading around 3,746, moving within a well-defined consolidation range. Price action highlights a premium supply zone at 3,775–3,773 and a discount demand zone at 3,723–3,725. The market structure shows earlier signs of BOS and ChoCH, with engineered liquidity sweeps becoming evident. A potential Mitigation → Expansion sequence is in play, where a liquidity grab near discount demand could fuel a bullish leg toward premium supply.
From a macro perspective, today’s headlines underscore the cautious stance across financial markets as investors await the Federal Reserve’s upcoming guidance. Lingering inflationary concerns, coupled with speculation around the timing of future rate cuts, have kept volatility elevated. Meanwhile, geopolitical risks continue to underpin safe-haven demand for gold, adding an extra layer of support at discount levels.
This combination of technical liquidity zones and macro uncertainty sets the stage for tactical plays: fading moves into the supply zone while remaining prepared for dip-buying opportunities at defined demand areas.
________________________________________
📌 Key Structure & Liquidity Zones (1H):
• 🔴 SELL GOLD 3,775–3,773 (SL 3,782): Supply zone coinciding with a buy-side liquidity pool above 3,780, offering downside targets at 3,760 → 3,745 → 3,730.
• 🟢 BUY GOLD 3,723–3,725 (SL 3,718): Discount demand aligned with liquidity grab potential, with upside targets at 3,745 → 3,760 → 3,775+.
________________________________________
📊 Trading Ideas (Scenario-Based):
🔻 Sell Setup – Supply Rejection (3,775–3,773)
• Entry: 3,775–3,773
• Stop Loss: 3,782
• Take Profits:
TP1: 3,760
TP2: 3,745
TP3: 3,730
🔺 Buy Setup – Demand Mitigation (3,723–3,725)
• Entry: 3,723–3,725
• Stop Loss: 3,718
• Take Profits:
TP1: 3,745
TP2: 3,760
TP3: 3,775+
________________________________________
🔑 Strategy Note
With the Fed’s next move looming, traders should anticipate engineered sweeps into both premium and discount liquidity pools before the market establishes clearer direction. The tactical edge comes from aligning intraday setups with liquidity hunts:
• Fade supply at 3,775–3,773 if rejection confirms.
• Buy dips into 3,723–3,725 if liquidity is swept cleanly.
The broader narrative of inflation concerns, dollar sensitivity, and safe-haven flows reinforces the case for two-sided opportunities. Expect gold to remain volatile within this consolidation range, with sharp moves likely as liquidity is targeted ahead of Fed clarity.

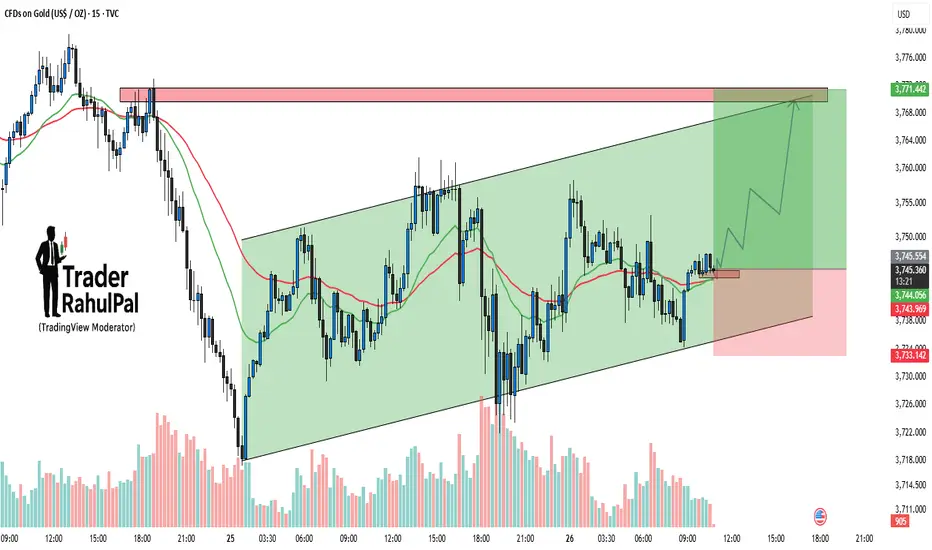
Gold – Channel Support Holding, Upside Target Towards 3770Gold is trading within a well-defined ascending channel on the 15-min chart. Price action has repeatedly respected both support and resistance lines, which makes this pattern highly reliable in the short term. Currently, the price is bouncing from the lower channel support and holding firmly above the 3740–3743 zone. As long as this support area is protected, the bullish momentum remains intact and the next upside target comes in around 3770, aligning with the channel resistance. A breakout above 3770 could trigger an even stronger rally, while a failure to hold below 3733 would invalidate the setup and shift the bias to the downside.
Disclaimer: This analysis is for educational purposes only and should not be taken as financial advice. Please do your own research or consult your financial advisor before investing.
Analysis By @TraderRahulPal (TradingView Moderator) | More analysis & educational content on my profile
👉 If you found this helpful, don’t forget to like and follow for regular updates.
XAUUSD SHOWING A GOOD UP MOVE WITH 1:10 RISK REWARD GOLD SHOWING A GOOD UP MOVE WITH 1:10 RISK REWARD
DUE TO THESE REASON
A. its following a rectangle pattern that stocked the market
which preventing the market to move any one direction now it trying to break the strong resistant lable
B. after the break of this rectangle it will boost the market potential for break
C. also its resisting from a strong neckline the neckline also got weeker ald the price is ready to break in the outer region
all of these reason are indicating the same thing its ready for breakout BREAKOUT trading are follws good risk reward
please dont use more than one percentage of your capitalfollow risk reward and tradeing rules
that will help you to to become a bettertrader
thank you

Part 4 Learn Institutional Trading 1. Introduction to Options and Their Importance
Financial markets have evolved to provide investors with a wide variety of tools to grow wealth, manage risk, and enhance returns. Among these tools, options stand out as one of the most versatile and powerful instruments.
Options belong to the family of derivatives, meaning their value is derived from an underlying asset such as a stock, index, commodity, or currency. Unlike direct ownership (buying a stock outright), options give the investor rights but not obligations, providing flexibility in trading.
Their importance lies in:
Allowing traders to profit in both rising and falling markets.
Offering leverage (control larger positions with smaller capital).
Serving as a hedging instrument to reduce portfolio risks.
Providing a platform for sophisticated strategies that balance risk and reward.
In today’s markets — whether on Wall Street, the NSE, or other global exchanges — option trading has grown from being a niche practice for institutional investors to a mainstream financial strategy accessible to retail traders as well.
2. Basic Concepts: Calls, Puts, and Premiums
At the core of option trading are call options and put options.
Call Option: A financial contract that gives the buyer the right (not obligation) to buy the underlying asset at a predetermined price (strike price) within a specific time frame.
Example: Buying a Reliance call at ₹2,400 strike allows you to buy Reliance shares at ₹2,400 even if the market price rises to ₹2,600.
Put Option: A contract that gives the buyer the right to sell the underlying asset at a fixed strike price within a specific time frame.
Example: Buying a Nifty put at 20,000 strike allows you to sell at 20,000 even if Nifty drops to 19,500.
Premium: The price paid by the option buyer to the seller (writer) for obtaining this right. Premiums are determined by factors like volatility, time to expiry, and demand-supply.
Strike Price: The fixed level at which the buyer can exercise the right.
Expiration Date: Options are time-bound contracts. At expiry, they either get exercised (if in the money) or expire worthless.
These basic concepts form the foundation of all option strategies and trading approaches.

Bearish on gold As previous gold has been rallied for more then week and we see bearishness in daily and weekly time frame and I expect gold to retrace and continue going higher
