XAUUSD – The downward trend continues to be prioritisedThe downward trend continues to be prioritised (Wolfe Waves Pattern H4)
Hello Trader,
Gold is following the Wolfe Waves structure on the H4 chart, after bouncing off the upper resistance zone and returning below the trendline. This indicates that the short-term upward momentum has weakened, and the scenario of a downward adjustment continues to be prioritised at this stage.
Technical Analysis
Wolfe Waves are clearly formed, wave 5 has hit resistance and a reversal signal has appeared.
The price failed to hold above the upper trendline, while the MACD shows weakening upward momentum.
The 3746 – 3748 zone is considered the main “sell zone” in the short term.
Nearby support zones: 3709 – 3711 and deeper at 3675 – 3678. Further, the area around 3650 is an important “buy zone” in the medium term.
Trading Scenario
Sell following the trend (priority)
Entry: 3746 – 3748
SL: 3754
TP: 3733 → 3720 → 3702 → 3690
Buy Short-term Scalping
Entry: 3709 – 3711
SL: 3705
TP: 3722 → 3730 → 3745
Buy Deep Support Scalping
Entry: 3675 – 3678
SL: 3670
TP: 3688 → 3696 → 3710 → 3725
Medium-term Buy Zone
Entry: around 3650
This is a high-volume accumulation zone, coinciding with strong support on H4. This area is suitable for considering medium-term buy orders if the price adjusts deeply.
Conclusion
In the short term, the bearish scenario continues to be prioritised, especially when the price remains below the 3748 zone.
Buy strategies should only be considered in the form of scalping or at the important buy zone around 3650.
The current gold market is still in a distribution phase, so patience is needed to observe candle confirmations at entry zones to optimise the R:R ratio.
This is today's XAUUSD trading scenario according to Wolfe Waves on H4. You can refer to and combine with personal strategies for the best risk management.
Follow me to receive the latest scenarios when the price structure changes.
Trade ideas

Gold Neowave Stuctural UpdateNamaskaram Everyone
Welcome to intelligent investor, we provide market insights by synchronising and combining all the price action waves from different time frames and gives you single trend.
How To Read My Charts...Click Below
FX:XAUUSD FX:XAUUSD OANDA:XAUUSD MCX:GOLD1!

Gold 1H – Will Gold Correction Extend Toward Discount Zones?Gold on the 1H timeframe is trading close to 3,745 after a series of bearish pushes, with premium resistance placed at 3,780–3,778 and another resistance pocket at 3,748–3,746. On the downside, discount demand is noted at 3,713–3,706, with a deeper support near 3,665. Recent CHoCH signals highlight short-term bearish bias, indicating that liquidity sweeps into resistance zones may occur before price retraces towards discount areas.
Today’s headlines around renewed U.S. inflation concerns and expectations of a slower Fed pivot are dampening sentiment, while geopolitical tensions in the Middle East continue to support safe-haven bids. This combination is likely to keep intraday volatility elevated, with liquidity grabs around resistance zones expected before a clearer directional move emerges.
________________________________________
📌 Key Structure & Liquidity Zones (1H):
• 🔴 SELL GOLD LIQUIDITY 3,780–3,778 (SL 3,787): Premium resistance where sweeps may trigger rejection toward 3,760 → 3,740 → 3,730.
• 🔴 SELL GOLD 3,748–3,746 (SL 3,755): Intraday resistance aligned with 0.5–0.618 retracement, targeting 3,730 → 3,720 → 3,715.
• 🟢 BUY ZONE 3,697–3,699 (SL 3,692): Discount demand with liquidity confluence, offering upside targets at 3,715 → 3,730 → 3,745+.
________________________________________
📊 Trading Ideas (Scenario-Based):
🔻 Sell Setup – Liquidity Run (3,780–3,778)
• Entry: 3,780–3,778
• Stop Loss: 3,787
• Take Profits:
TP1: 3,760
TP2: 3,740
TP3: 3,730
🔻 Sell Setup – Intraday Rejection (3,748–3,746)
• Entry: 3,748–3,746
• Stop Loss: 3,755
• Take Profits:
TP1: 3,730
TP2: 3,720
TP3: 3,715
🔺 Buy Setup – Discount Demand (3,697–3,699)
• Entry: 3,697–3,699
• Stop Loss: 3,692
• Take Profits:
TP1: 3,715
TP2: 3,730
TP3: 3,745+
________________________________________
🔑 Strategy Note
With U.S. inflation concerns and geopolitical risks creating mixed drivers for gold, intraday strategies can look to fade liquidity sweeps into premium resistance while keeping an eye on buy opportunities from well-defined discount demand zones. Expect sharp moves around 3,780 liquidity grabs before corrections extend down into the 3,713–3,706 area.

XAUUSD Facing Downward PressureHello traders, XAUUSD is currently facing downward pressure following recent economic news. The lower-than-expected unemployment claims data suggests economic stability, reducing the demand for gold. The higher-than-expected PCE core index increases the likelihood that the Fed will maintain high interest rates, putting pressure on gold prices. While the US GDP remains stable , there is no strong breakthrough.
Technically, XAUUSD is in an uptrend but has encountered resistance at $3,790 . The price of gold is currently testing support at $3,700. If this level is broken, gold could fall to the $3,635 region.
Given the current fundamental and technical factors , the likelihood of XAUUSD continuing to decline is high. If support doesn't hold, gold could continue to drop.
Wishing you successful trading!

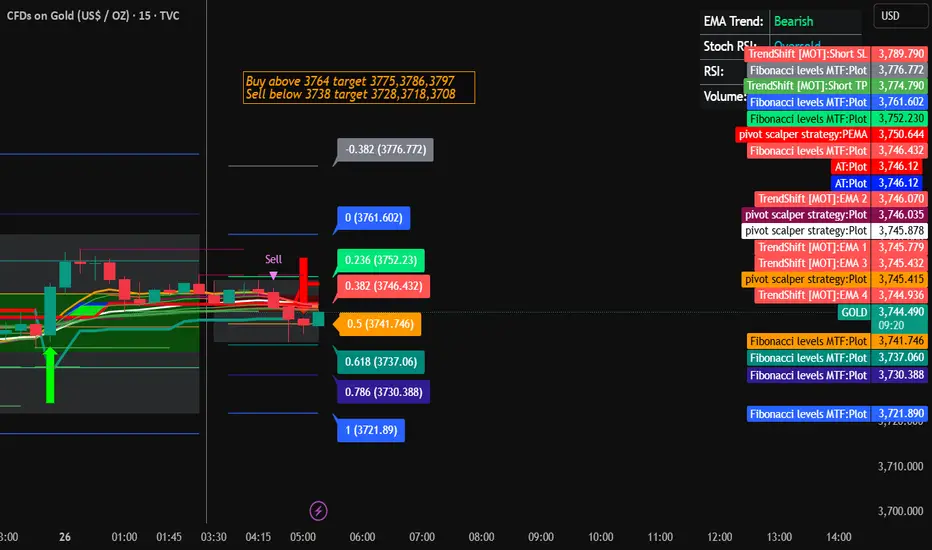
Gold Trading Strategy for 26th September 2025📊 Gold Trading Signal (1H Time Frame)
🟢 Buy Setup
👉 Condition: 1H candle must close above 3764
🎯 Targets:
3775
3786
3797
🛑 Stop Loss: Below 3755 (suggested for risk management)
🔴 Sell Setup
👉 Condition: 1H candle must close below 3738
🎯 Targets:
3728
3718
3708
🛑 Stop Loss: Above 3748 (suggested for risk management)
⏰ Time Frame: 1 Hour (H1)
📌 Signals are based on candle close confirmations. Always wait for the hourly candle to finish before entering.
⚠️ Disclaimer
This analysis is provided for educational purposes only 📘. Trading in gold, commodities, or any financial market involves significant risk of loss. 📉 Always use proper risk management, set stop losses, and consult with your financial advisor before making any trading decisions. The provider of this analysis is not responsible for any profits or losses incurred.
Gold Trading Strategy | September 25-26✅ 4-Hour Chart: Gold prices pulled back after reaching 3791, with the lowest dip to 3717. It has since rebounded to oscillate around 3755–3760. The overall movement shows high-level consolidation, with frequent fluctuations between bulls and bears. No clear one-sided trend has formed yet, and we need to wait for a breakout direction.
The moving averages MA5 and MA10 are entangled at the highs, with price swinging above and below them, reflecting a tug-of-war between bulls and bears. MA20 (around 3755) serves as a critical support/resistance, currently at a pivotal state.
✅ 1-Hour Chart: Price rebounded from the 3717 low but faced resistance again around 3760–3765. It is currently fluctuating in the 3740–3760 range, showing a typical consolidation pattern.
The moving averages MA5, MA10, and MA20 are intertwined, with price oscillating around them. If the price fails to hold above 3760 in the short term, the rebound momentum will remain limited.
🔴 Resistance Levels: 3760 / 3785 / 3791
🟢 Support Levels: 3730 / 3717 / 3709
✅ Trading Strategy Reference:
Focus on range trading with selling at highs and buying at lows.
🔰 If gold rebounds to around 3760 and faces resistance, consider light short positions with a target of 3730–3720.
🔰 If price pulls back and stabilizes within the 3730–3717 range, consider short-term long positions with a target of 3760.
🔥Trading Reminder: Trading strategies are time-sensitive, and market conditions can change rapidly. Please adjust your trading plan based on real-time market conditions.

Gold (XAU/USD) – Sell Scenario from Red Supply Zones💰💰Price is approaching the red supply zones around 3770–3760 and 3780–3775. If a bearish confirmation candle forms within these zones, I expect a drop towards the gray support area near 3720–3710.
If this support breaks, the next target will be around the lower red trendline of the descending channel (3690–3685).
The sell scenario remains valid as long as price does not break and close above 3780.
Be sure to enter the position with capital management.
I hope you make good use of the signals and analyses I share.

Geopolitical Events and Gold Spikes – The Hidden Pattern!Hello Traders!
Every time the world faces tension, war threats, sanctions, or political instability, one asset almost always reacts first: Gold .
But instead of looking random, these spikes follow a hidden pattern that traders can use to understand market psychology. Let’s decode it.
1. Why Gold Reacts to Geopolitical Events
Gold is a global safe-haven asset. When uncertainty rises, investors park money in gold for safety.
Unlike currencies or stocks, gold isn’t tied to any government, which makes it a natural hedge against political risks.
2. The Initial Panic Spike
At the first headline of conflict or political crisis, gold prices often jump suddenly.
This is driven by panic buying, where institutions and retail both rush to hedge their portfolios.
The move is usually sharp but short-lived, as markets wait for clarity.
3. The Follow-Through or Fade
If the geopolitical issue escalates (like war or sanctions), gold continues to rise as demand for safety increases.
If tensions cool down quickly, the spike fades and gold retraces back to its earlier levels.
This second phase is where traders can judge whether the move has real strength or was just fear-driven.
4. How Traders Can Use This Pattern
Don’t chase the first panic spike, spreads are wide, and risk is high.
Wait to see if the issue escalates or calms down before deciding direction.
Combine news with technical zones, gold often spikes into resistance or support during such events.
Rahul’s Tip:
Treat geopolitical spikes as opportunities to observe how gold reacts to fear.
Over time, you’ll notice that the pattern repeats: panic spike → wait for confirmation → follow-through or fade.
Conclusion:
Gold is more than just a commodity, it’s a barometer of global fear.
By understanding how it reacts to geopolitical events, you can stop being surprised by sudden moves and start using them to your advantage.
If this post helped you spot the hidden pattern in gold spikes, like it, share your view in comments, and follow for more global market insights!

Hi Traders, Anfibo here!Hi Traders, Anfibo here!
Market Overview – XAUUSD
Gold (XAUUSD) is currently holding steady within the H4 bullish channel, showing that the overall uptrend remains intact. While there has not been a major breakout in recent sessions, the technical structure still suggests buyers have the upper hand.
That said, the market is slowing down around a key resistance zone. For short-term opportunities, it’s important to focus on reactions at support and resistance levels to capture profits effectively.
Key Levels
Support: 3748 – 3733 – 3703
Resistance: 3768 – 3777 – 3788 – 3799
Trading Plan for Today
Sell Scalp Setup
Entry: 3770 – 3765
Stop Loss: 3780
Take Profit: 3720 – 3705
Buy Zone Setup
Entry: 3700 – 3705
Stop Loss: 3695
Take Profit: 3760 – 3800
⚠️ Always use stop-loss and follow strict money management rules to protect your capital.
Wishing you all successful trades!

Every time gold falls back, it is to reboundGold is no longer in a one-sided rally. Technically, it's undergoing a major correction. Our strategy is to follow the trend and prioritize both long and short positions. Now that we're seeing a major trend, the most common question we receive is whether a major decline has begun or whether gold has peaked. Yesterday's daily chart closed with a negative candlestick pattern, and the previous trading day also saw a vague tombstone candlestick pattern. Currently, we can only confirm short-term resistance, but we can't confirm a major trend peak or a bullish weekly trend. Furthermore, the short-term correction hasn't disrupted the bullish trend, so today we'll maintain a long strategy on pullbacks.
From a 4-hour analysis, effective support remains near the 3718-23 area, with upward pressure focused on the 3756-65 area. Our strategy is to primarily buy on pullbacks. In the intermediate range, be cautious and watchful.
Gold Trading Strategy:
Buy on pullbacks to the 3718-23 area, with a stop-loss at 3709 and a target of 3756-3765.

XAU/USD H1 – Rejection at 3770 Resistance, Trendline Break✅✅✅Gold price on the H1 chart has tested the key 3770 resistance zone (orange area) and faced rejection. Price has also broken below the rising trendline, signaling a possible short-term pullback. Immediate support is at 3744, and a break below could push the price towards 3720.
Key points:
Resistance: 3770 (major supply zone)
Support: 3744, then 3720
Technical Signal: Rising trendline broken
Short bias valid as long as price stays below 3770

XAU/USD H1 – Gold at Key Resistance, Potential Pullback to 0.618
💥✅🎯On the one-hour (H1) timeframe, the price of gold (XAU/USD) has reached the key resistance level of 3,766–3,770 after a strong bullish rally. This resistance zone coincides with the upper supply area marked in red, as well as the rising orange trendline channel mid-level.
Key points:
Resistance Zone: 3,766–3,770
Support Levels: 3,740 and 3,720
Fibonacci Levels: Possible correction targets at 0.618 (~3,740) and 0.786 (~3,720).
Price action is consolidating near the resistance; watch for reversal candlestick patterns for short opportunities.
If resistance breaks, next upside target is around 3,800.
If rejection occurs, expect a corrective move down to Fibonacci levels before resuming the uptrend.
Risk Management:
For long positions: Wait for a breakout above 3,770 with sustained volume.
For short positions: Place stops above 3,780 to limit exposure.
Always use appropriate position sizing.

Gold "Cools Down": A Sign of a Coming Downturn? Hello, investors!
Gold saw a notable correction on September 24, closing at $3,762.73/oz after reaching a historic high of $3,790.82/oz just one day earlier. Gold futures also dropped 0.5% to $3,795.80/oz. Is this a sign of a deeper correction or just a short-term profit-taking before key news?
Fundamental Analysis: Market "Holds Its Breath" Before the PCE Inflation Report
Yesterday's drop in gold seems to have little to do with the released U.S. economic data, as the USD index only had a slight rebound and housing data wasn't strong enough to cause such a major move. Instead, the most likely reasons are:
Cautious Profit-Taking: Investors are taking profits after a rapid run-up, aiming to mitigate risk before the upcoming PCE inflation report on September 26.
Fed Expectations: Despite short-term volatility, the market holds firm on its expectation that the Fed will cut rates in October and December with a high probability (94% and 77%). A low-rate environment and geopolitical concerns remain the core drivers supporting gold's price in the long term.
Technical Analysis: "Sell" or "Wait to Buy"?
Gold had a significant correction from the $3,770 area, indicating that a large number of profit-taking sell orders were triggered. However, the downtrend has paused and is now looking for a new balance point.
Outlook: With the current cautious sentiment, there's a chance gold may see further selling pressure in the short term. However, any deeper drop would be an excellent opportunity to buy back at a better price, as the long-term bullish momentum is still intact.
Suggested Trading Strategy (Strict Risk Management):
Sell Zone: Zone $3766 - $3768, SL $3776
Buy Zone: Zone $3702 - $3700, SL $3692
The market is highly sensitive. Do you think this correction is a buying opportunity or a time to step back? Share your thoughts! 👇
#Gold #XAUUSD #Fed #GoldAnalysis #TradingView #InterestRates #Inflation #PCE #USD

Fed Cuts & Geopolitical Risks Keep Gold Strong📊 Market Overview
Gold is holding firm above 3750 USD/oz, extending gains and refreshing daily highs in the European session. Expectations that the Federal Reserve will continue cutting rates this year are supporting bullish sentiment, while ongoing geopolitical tensions keep safe-haven demand elevated. For Indian traders, this combination of softer USD and global uncertainty keeps gold attractive both as a hedge and a short-term trading instrument.
🔎 Technical Analysis (H1/H4)
Price structure remains bullish while holding above 3750.
Buy Zones: 3742–3740 (main support) and 3757–3755 (scalp setup).
Resistance nearby at 3778, with extended upside potential towards 3813–3815 (liquidity sell zone).
A rejection at 3813–3815 could trigger a short-term pullback to demand levels.
🔑 Key Levels
Resistance: 3778 - 3813 - 3815
Support / Buy Zones: 3757 - 3755 - 3742 - 3740
📈 Scenarios & Trading Plan
✅ BUY ZONE (Main Setup): 3742–3740
SL: 3735
TP: 3748 - 3752 - 3756 - 3760 - 3770 - 3780 - …
✅ BUY SCALP (Quick Entry): 3757–3755
SL: 3750
TP: 3762 - 3766 - 3780 - …
✅ SELL ZONE (Liquidity Trap): 3813–3815
SL: 3820
TP: 3810 - 3805 - 3800 - 3795 - 3790 - 3780 - …
⚠️ Risk Management Notes
Watch out for false breakouts at 3813–3815 — liquidity sweeps are likely before reversals.
Focus on buying confirmed pullbacks rather than chasing price mid-range.
Keep trade size moderate — volatility can increase on Fed comments or geopolitical updates.
✅ Summary
Gold’s bullish trend remains intact, supported by Fed cut expectations and geopolitical risks. Trading plan: buy dips at 3757–3755 and 3742–3740, aiming for 3770–3780, while monitoring the 3813–3815 zone for short-term sell opportunities if rejection occurs.
📢 Follow MMFLOW TRADING on TradingView for intraday setups, liquidity-based strategies, and high-probability trade ideas tailored for global traders.

Gold shakes violently | Priority Buy on dip to support🟡 XAU/USD – 24/09 | Captain Vincent ⚓
🔎 Captain’s Log – Context & News
Geopolitics : Trump unexpectedly supported Ukraine reclaiming full territory and called on NATO to be tougher on Russia → defensive sentiment returned, supporting Gold.
US Economy : Housing data due today, no FED speeches.
Earlier: Weak US PMI + dovish FED tone → no momentum for a prolonged downtrend.
Price Action : Gold dropped more than 20 points overnight, then quickly rebounded to 3,76x → likely profit-taking pressure at higher levels.
⏩ Captain’s Summary : Main trend stays bullish, but the voyage will remain choppy as Gold absorbs profit-taking near resistance.
📈 Captain’s Chart – Technical Analysis (H45)
Golden Harbor (Support / Buy Zone)
Buy Scalp OB: 3,754 – 3,757
OB Harbor: 3,741 – 3,744
Storm Breaker (Resistance / Sell Zone)
Sell Scalp Zone: 3,797 – 3,800
Higher Sell Zone: 3,813 – 3,815
Market Structure
After the deep drop, Gold rebounded and held above 3,76x.
Bullish trend remains intact, but waves of volatility may occur near higher resistance zones.
🎯 Captain’s Map – Trade Plan
✅ Buy (priority)
Buy Scalp OB
Entry: 3,754 – 3,757
SL: 3,747
TP: 3,762 – 3,767 – 3,772 – 3,777 – 3,782
Buy Zone OB
Entry: 3,741 – 3,744
SL: 3,732
TP: 3,749 – 3,754 – 3,759 – 3,764 – 3,769
⚡ Sell (short scalp – lower RR)
Sell Scalp Zone
Entry: 3,797 – 3,800
SL: 3,806
TP: 3,795 – 3,790 – 3,785 – 3,780 – 3,775
Higher Sell Zone
Entry: 3,813 – 3,815
SL: 3,823
TP: 3,810 – 3,805 – 3,800 – 3,795 – 3,790
⚓ Captain’s Note
“The Golden ship rocked violently overnight but still anchored firmly at Golden Harbor 🏝️ (3,754 – 3,741) . Profit-taking waves may still rise at Storm Breaker 🌊 (3,797 – 3,815) , suitable for short Quick Boarding 🚤 scalps. Yet the main voyage continues north – Buy the Dip remains the compass to follow the strong winds.”
📢 If you find the Captain’s Log useful, don’t forget to Follow for the latest signals.
💬 Got your own view on Gold? Share it in the comments and join the crew discussion!

Gold Trading Plan: After Record High Pullback📊 Market Context
Gold is struggling to recover after the pullback from its all-time high near 3791 USD/oz. During the Asian session on Thursday, price action turned cautious as traders await US mid-tier data and further comments from Federal Reserve officials. While the long-term outlook remains bullish, in the short-term, XAU/USD faces potential liquidity sweeps and sharp volatility around key zones.
🔎 Technical Analysis (H1/H4)
ATH zone 3791 triggered heavy selling pressure.
Price is currently moving below the 3755–3757 downtrend reaction zone, signaling short-term weakness.
Strong demand/liquidity sits at 3712 and deeper at 3688–3686 (CP + OBS Buy Zone).
Sell-side liquidity lies at 3775–3777, likely to trigger reactions on retests.
A broader Liquidity Sell Zone is visible at 3824–3830, only valid if 3777 breaks cleanly.
🔑 Key Technical Levels
Resistance / Sell Zones: 3775–3777 - 3791 - 3824–3830
Support / Buy Zones: 3712 - 3688–3686
📈 Trading Scenarios & Plan
✅ BUY ZONE (priority): 3688–3686
SL: 3680
TP: 3696 - 3700 - 3705 - 3710 - 3720 - 3730 - …
✅ SELL ZONE (scalp): 3775–3777
SL: 3782
TP: 3770 - 3765 - 3760 - 3750 - 3740 - 3730 - …
⚠️ Risk Notes
Be careful with false breakouts at 3775–3777 before reversals.
Avoid chasing price in the middle of the range; wait for price action confirmations at zones.
US data and Fed speeches can bring volatility – adjust position sizes accordingly.
✅ Summary
Gold is consolidating after its sharp rally to 3791 ATH, waiting for new catalysts from the US and Fed. Main plan: buy dips at 3688–3686 aiming for 3720–3730, while a short-term sell opportunity at 3775–3777 remains valid if rejection signals appear. If bulls clear 3777, the upside opens towards 3824–3830 liquidity.
📢 Follow MMFLOW TRADING for real-time liquidity setups and BIGWIN strategies!

LiamTrading – XAUUSD IN-DEPTH ANALYSIS OF CURRENT TRENDLiamTrading – XAUUSD Scenario Today: Opportunities at Key Price Levels
Gold continues its strong upward momentum, currently fluctuating around the 376x–377x range after a series of breakthroughs. The technical structure on the H1 chart shows the market is forming clear resistance and support zones, suitable for short-term trading plans.
Technical Analysis
RSI is cooling off from high levels, indicating the possibility of a short-term correction.
The upper price range around 3818–3821 is a strong confluence of resistance, coinciding with wave peaks and Fibonacci extensions, making it prone to selling reactions.
Conversely, the support zones at 373x and 370x exhibit dense liquidity, serving as potential buying points when prices adjust.
The short-term Dow structure still leans towards an uptrend, but attention is needed for the sell confirmation zone if gold fails at the peak.
Reference Trading Plan
Sell Zone: 3818 – 3821, SL 3828, TP 3805 – 3785 – 3760 – 3732 – 3650
Buy Scalping: 3728 – 3731, SL 3723, TP 3750 – 3777 – 3790
Buy Zone: 3706 – 3709, SL 3700, TP 3725 – 3738 – 3750 – 3777 – 3790
In summary, the main trend still leans towards an increase, but with gold approaching strong resistance zones, the likelihood of a correction is very high. Traders need to patiently wait for reactions at the marked zones for optimal entries, while managing risk tightly.
This is my personal view on XAUUSD. If you're interested in gold scenarios, follow me for the fastest updates.

Elliott Wave Analysis XAUUSD – September 25, 2025
________________________________________
🔹 Momentum
• D1: Momentum on the daily chart has turned bearish, indicating that the main downtrend may continue.
• H4: Momentum on H4 is about to turn bullish, suggesting a possible upward move today. However, if this bullish reversal fails to break the previous high, the downtrend will remain intact.
• H1: Momentum on H1 is declining and about to enter the oversold zone. This downward move may need around 2 more H1 candles before entering oversold territory and reversing.
________________________________________
🔹 Wave Structure
• D1:
o The first target of wave 5 (yellow) was reached at 3789.
o Price is currently reacting at this level. With D1 momentum turning bearish, there is a strong possibility that wave 5 (yellow) has already completed, meaning price could move towards 3632 and potentially break below it.
• H4: An ABC corrective structure (blue) has formed, opening three scenarios:
1. The correction is complete → price rallies strongly, breaking the previous high to continue the uptrend.
2. Price rallies but with overlap, forming a Flat 3-3-5 pattern → price may rise toward the previous high at 3793.
3. Price remains in a zigzag structure → another decline may occur to complete wave C.
👉 Given the bearish momentum on D1, I lean more towards scenario 2 and 3.
👉 Note: In scenarios (1) and (2), price must hold above 3729, then break 3752, which could lead to a minimum rally towards 3777.
• H1: Under scenario 3 (further decline to complete wave C):
o Price may break below 3718.
o Wave 5 (black) targets:
3713 (first target).
3698 (second target).
________________________________________
🔹 Trade Plan
• Buy Zone 1: 3729 – 3726
o SL: 3717
o TP: 3751
• Buy Zone 2: 3714 – 3711
o SL: 3703
o TP: 3751
________________________________________
⚠️ Important Note
The market is likely in a corrective wave at a higher structure.
• Characteristic: Price often shows overlapping moves.
• Therefore: Manage trades carefully, avoid over-risking, as reversals can happen at any time – this is typical of corrective waves.

GOLD TREND TODAY - Support and Resistance - Simple Analysis📈 Trend & Market Structure
XAUUSD
Gold is still in a clear uptrend, respecting higher highs and higher lows on H4.
Recent breakout structures (BOS) confirm bullish order flow, but price is approaching a liquidity zone near $3,800.
On the downside, unmitigated Fair Value Gaps (FVG) and Order Blocks (OB) remain potential buy zones if price retraces.
🔑 Key Levels
Resistance: 3800 – 3830
Support: 3765 – 3760 – 3755
Liquidity Buy Zone: 3715 – 3712
📌 Trade Ideas
🔴 SELL Setup (Countertrend / Scalping)
Entry: 3855 – 3858
Stop Loss: 3863
Take Profit:
TP1: 3850
TP2: 3840
TP3: 3820
TP4: 3800
Open TP: 3780
🟢 BUY Setup (Trend-following / SMC zones)
Entry: 3715 – 3712 (Liquidity + Strong OB)
Stop Loss: 3705
Take Profit:
TP1: 3725
TP2: 3735
TP3: 3755
TP4: 3775
Open TP: 3800
🎯 Strategy Note
Main bias: Look for buys on retracements in line with the uptrend.
Shorts at 3855 – 3858 are countertrend scalps only; use tight stops.
Apply scalping entries once price reacts at the defined S/R levels with confirmation (candlestick rejection, BOS, or volume shift).
Always use SL/TP for risk management.
⚡ Gold remains bullish overall; the plan favors buy opportunities from demand zones, while countertrend shorts should be quick and managed tightly.

Gold Finds Support at R1 , buy the Dip stills looks good We have seen a solid pullback (of over 72 points from the highs) in yesterday’s session, yet the broader structure on the H4 and higher timeframes remains firmly bullish, maintaining its HH-HL pattern. Price has so far rejected the 3720 zone (Weekly R1), confirming it as near-term support, and is now retesting the immediate resistance at 3750 along with the descending trendline overhead.
As long as gold holds above the PWH / 3700–3680 demand zone, this looks like a healthy consolidation rather than a trend reversal. A sustained breakout above 3750 and the descending trendline could trigger momentum toward the 3790–3800 zone once again.
For the short- to mid-term outlook, buying dips remains the preferred strategy, with invalidation coming only on a clean breakdown and H4 close below 3700 with strong volume.

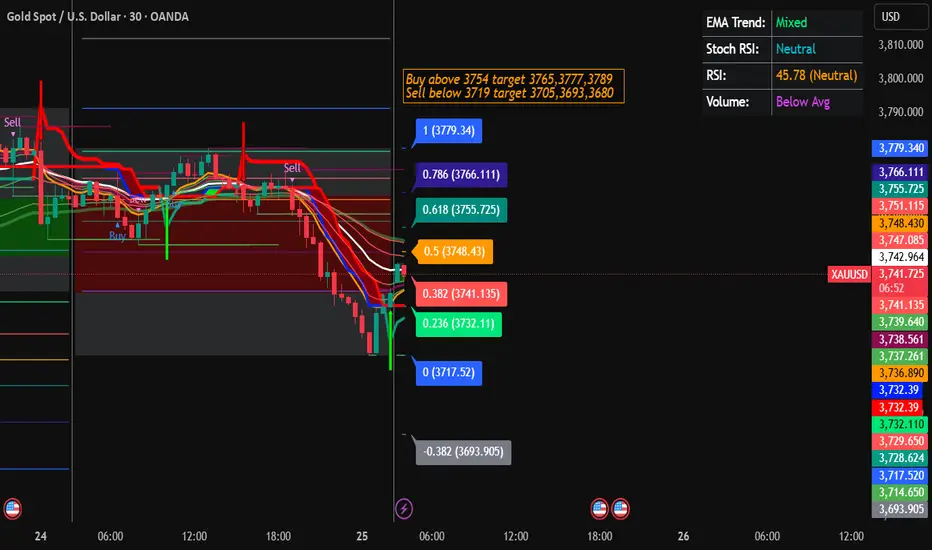
Gold Trading Strategy for 25th September 2025📊 Gold Trading Strategy
🟢 Buy Setup (Bullish)
Entry: Buy above the high of the 15-min candle if it closes above 3754.
Targets:
🎯 Target 1 → 3765
🎯 Target 2 → 3777
🎯 Target 3 → 3789
Stop Loss: Place stop loss just below 3750 (or recent swing low for safer risk management).
Confirmation Tip: Look for strong bullish candle close with good volume.
🔴 Sell Setup (Bearish)
Entry: Sell below the low of the 1-hour candle if it closes below 3719.
Targets:
🎯 Target 1 → 3705
🎯 Target 2 → 3693
🎯 Target 3 → 3680
Stop Loss: Place stop loss above 3725 (or previous swing high for extra safety).
Confirmation Tip: Watch for bearish momentum and rejection at higher levels.
⚖️ Risk Management
Use 1–2% of your capital per trade.
Always maintain risk-to-reward ratio (1:2 or better).
Avoid over-leveraging.
⚠️ Disclaimer
This trading setup is for educational purposes only.
Trading in gold and financial markets involves substantial risk and may not be suitable for all investors.
Do your own research or consult a financial advisor before taking any trades.
Gold Trading Strategy | September 24-25✅ 4-Hour Chart Structure: Gold prices pulled back after testing the 3791 level, breaking below the 3763 pivot and reaching as low as 3732. Consecutive bearish candles indicate strong downside momentum. The trend has shifted from bullish to bearish. If 3730 is broken, further downside toward 3709 or even 3682 is possible.
✅ Moving Averages: MA5 and MA10 have formed a bearish crossover, with price trading below both, showing weakening short-term momentum. MA20 (around 3738) is now the key support; if broken, it could open further downside potential.
✅ 1-Hour Chart: Gold faced repeated resistance near 3780 and gradually moved lower, now hovering in the 3730–3735 range. No clear signs of a bottom have appeared during the decline, suggesting bears remain in control. In the short term, if the price fails to reclaim 3760, the weak trend will likely continue.
🔴 Resistance Levels: 3760 / 3785 / 3791
🟢 Support Levels: 3730 / 3709 / 3682
✅ Trading Strategy Reference:
🔰If the price rebounds to around 3760 and faces resistance, consider light short positions, targeting 3730–3710.
🔰If the price pulls back and stabilizes within the 3730–3735 area, consider short-term long positions, targeting 3760.
🔥Trading Reminder: Trading strategies are time-sensitive, and market conditions can change rapidly. Please adjust your trading plan based on real-time market conditions. If you have any questions , feel free to contact me🤝

XAUUSD SHOWING A GOOD DOWN MOVE WITH 1:10 RISK REWARDXAUUSD SHOWING A GOOD DOWN MOVE WITH 1:10 RISK REWARD DUE TO THESE REASON
A. its following a rectangle pattern that stocked the marketwhich preventing the market to move any one direction now it trying to break the strong resistant lable
B. after the break of this rectangle it will boost the market potential for breakC. also its resisting from a strong neckline the neckline also got weeker ald the price is ready to break in the outer region
all of these reason are indicating the same thing its ready for breakout BREAKOUT trading are follws good risk reward
please dont use more than one percentage of your capitalfollow risk reward and tradeing rules that will help you to to become a bettertrader
thank you
