Weekly plan for XAUUSDNotes
1. Not a good weekly formation happened for the past 3 weeks.
2. Weekly close below 3167.835 wont be a good one for gold
3. Day candle making close below 3249.850 will slow down the recovery and chance pushing down will be more
GOLDMINICFD trade ideas

GOLD HAS ENTERED IN BEARISH ZONE SOON I think Gold has entered in Bearish Zone. 3499 is resistance of Gold current price is 3274 my stop loss is above 3500 with small Lot of Gold Target Price 2800 for next few months its positional View.
It is Time Base and Price Based Analysis according to me Bearish has been Started .

GoldGold ( OANDA:XAUUSD ) – Bearish Wyckoff Distribution (Unorthodox) in Play
Gold is currently trading around $3273/oz and appears to be in Phase D of a Bearish Wyckoff Distribution Schematic #1 (Unorthodox) on the 4H chart. The price is showing signs of weakness, but a final upthrust toward $3370 can’t be ruled out before a deeper breakdown.
Key level to watch:
⚠️ Breakdown confirmation below $3260–3200 could open the gates for a sharper decline.
Bearish structure still unfolding – traders should stay alert for signs of a last bull trap before distribution completes.
#Gold #XAUUSD #Wyckoff #TechnicalAnalysis #CommodityTrading #PriceAction

Gold market weekly reviewGold market weekly review: the long-short dilemma and trader dilemma under the PCE inflation game
On Friday, the US core PCE price index in May was 2.6% year-on-year, slightly higher than expected. This data, regarded by the Federal Reserve as an "inflation vane", once again revealed the contradictory background of the US economy - the tug-of-war between the stubborn inflation stickiness and the weak consumption momentum. After the data was released, the market reacted violently but chaotically: the US dollar index briefly dived 10 points and then quickly recovered its lost ground, while gold staged a "buy expectations and sell facts" drama, with a minimum of $3,255/ounce. Behind this is the serious disagreement among traders on the policy path - CME interest rate futures show that the probability of a rate cut in September is still anchored at 68%, but the expectation of a rate cut for the whole year of 2025 has been compressed from 4 times to 3 times.
What is more worthy of vigilance is the ghost effect of tariff policy. As the election approaches, trade protectionism rhetoric is rampant, and companies' pre-stocking behavior may temporarily lower inflation readings, but the reconstruction of supply chain costs in the medium and long term will strengthen the "higher for longer" interest rate narrative. In my opinion, the current market is repeating the script of "inflation repetition-expectation swing" in 2023, and the certainty of the Fed's policy shift is being swallowed by uncertainty.
Key signals of the 4-hour cycle
The falling channel is complete: After yesterday's cross star, there was no continuous positive rebound, and the 3280-3295 area constituted a double Fibonacci suppression (38.2% & 50% retracement level). The MACD column was released twice below the zero axis, suggesting that the shorts still have pricing power.
Long-short watershed: 3250 is not only a psychological barrier, but also the last line of defense of the 2024 rising trend line. If it is lost, it will open the door to test the 3200-3180 gap.
Retail trading trap warning
The recent daily fluctuation of gold is 100-200 US dollars. On the surface, it is a feast of opportunities, but in fact it is a liquidity hunting ground. I have witnessed too many traders repeatedly "selling high and buying low" in the 3280-3250 range, and finally being swept by the sudden market in both directions. It is necessary to clearly realize that the current market is in the late stage of trend acceleration, and volatility expansion is often accompanied by price deviation correction.
Short strategy
Ideal sniper position: 3280 (Asia-European market rebound limit) and 3295 (US market second test position), stop loss is strictly placed above 3303, target 3245-3230
Key risk control: If the price stands at 3287 within 30 minutes, you need to manually exit and wait and see
Bull strategy
Pick chestnuts from the fire position: 3243-3247 light position to try more (need to cooperate with 15-minute RSI bottom divergence), stop loss 3238, target 3265
Cruel reality: The winning rate of counter-trend trading is less than 35%, it is recommended to halve the position and give up the fantasy of "averaging costs"
Ultimate warning
The closing battle of the monthly line may trigger a liquidity vacuum killing, and any "bottom-fishing" behavior below 3250 must be equipped with a hedge position. Remember: before the market proves the bottom, the price is the most honest killer.

XAU USD Weekly Free Analysis (28-06-25 to 05-07-25)XAU USD
Gold is currently trading around $3,274 and appears to be forming a potential reversal zone after a sharp decline. The 4-hour chart suggests the price may bounce from this support region, supported by a long-term bullish structure. If buyers step in, we could see a recovery toward the $3,320–$3,350 range in the coming sessions. However, price action near the June 27th low will be critical for confirmation. Keep an eye on U.S. economic data and bond yields, which often influence gold sentiment.

XAU/USD Analysis Today (June 28, To 04 July 2025)XAU/USD Analysis Today (June 28, 2025)
As of June 28, 2025, the Gold Spot/US Dollar (XAU/USD) pair is trading around $3,295–$3,330, reflecting a corrective phase after recent volatility. Below is a detailed analysis of the current market dynamics, incorporating technical and fundamental factors, as well as sentiment from recent sources.
# Price and Market Overview
Current Price: Approximately $3,295–$3,330, with a slight downward bias following a recent peak near $3,450. The pair has been consolidating after a sharp decline triggered by easing geopolitical tensions.
Recent Performance: Gold fell by ~0.12%–0.42% in recent sessions, settling below the key $3,300 support level intraday, with volatility driven by U.S. economic data and Middle East developments.
Market Sentiment: The 14-day RSI is around 49.83–51.66, indicating neutral conditions, neither overbought nor oversold. Volatility over the past 30 days has been moderate at ~1.46%.
Technical Analysis
Support and Resistance Levels:
Support: Key support lies at $3,280–$3,240 (recent low and pivot point), with stronger support at $3,250 and $3,200 if selling pressure persists. A break below $3,280 could target $3,040–$3,100.
Resistance: Immediate resistance is at $3,300–$3,350, with a stronger barrier at $3,375–$3,400. A sustained break above $3,440 could signal a bullish reversal toward $3,488–$3,500.
Indicators:
Moving Averages: The 20-day EMA ($3,349.73) and 10-day EMA ($3,356.43) suggest a short-term sell signal, while the 50-day SMA ($3,323.61) and 100-day SMA ($3,162.10) indicate a buy signal, reflecting mixed trends. The 200-day SMA (~$2,919.95) supports a long-term bullish trend.
Chart Patterns: A bear flag pattern was noted on the 1-hour chart, signalling a continuation of the downtrend if $3,280 support fails. However, a potential reversal pattern is forming on the 15-minute chart near $3,313, suggesting a possible short-term bounce.
Chart for your reference
- Disclaimer --
This analysis is based on recent technical data and market sentiment from web sources. It is for informational purposes only and not financial advice. Trading involves high risks, and past performance does not guarantee future results. Always conduct your own research or consult a SEBI-registered advisor before trading.
#Boost and comment will be highly appreciated

XAUUSD – Bearish Pressure Intensifies, New Lows in SightGold remains firmly within a well-defined descending channel, consistently forming lower highs and lower lows. After a breakout of the minor channel, price appears to be pulling back toward the 3,300 zone before potentially resuming its downtrend.
The temporary ceasefire between Iran and Israel and the US–China rare earth trade deal have dampened safe-haven demand, with capital rotating back into equities. At the same time, stable core PCE data supports the USD, adding further pressure on gold.
If price fails to hold above the 3,260 area, the next target lies near 3,218.

XAUUSD Bullish Reversal from Channel Support | Gold Buy SetupAnalysis Overview:
Gold has been trading inside a clearly defined descending channel (marked by the orange trendlines). After a strong bearish move, price has reached the lower boundary of this channel, which is acting as dynamic support.
Key Technical Details:
Descending Channel Support: XAUUSD has tested the lower trendline multiple times and is currently showing rejection wicks, suggesting potential exhaustion of selling pressure.
Demand Zone: The shaded horizontal area represents a prior consolidation and minor support level that aligns with the channel bottom, adding strong confluence.
Entry: Planned buy entry at the current level near channel support, anticipating a bounce.
Stop Loss: Placed below the recent swing low and outside the channel, to allow room for volatility while protecting against continuation of the downtrend.
Target: The mid-to-upper boundary of the descending channel, aiming for a favorable risk-reward ratio.
Market Context: The higher timeframe trend remains bearish overall, so this is a short-term reversal (counter-trend) setup within the channel structure.
Trade Plan Rationale:
Expecting a corrective move upward within the descending channel as price retests previous supply zones and dynamic resistance. This setup is based on:
Confluence of channel support and demand zone
Multiple rejection wicks showing buyers stepping in
Potential mean reversion towards the channel midpoint
Disclaimer:
This is my personal analysis on XAUUSD and not financial advice. Always do your own research and manage risk carefully.

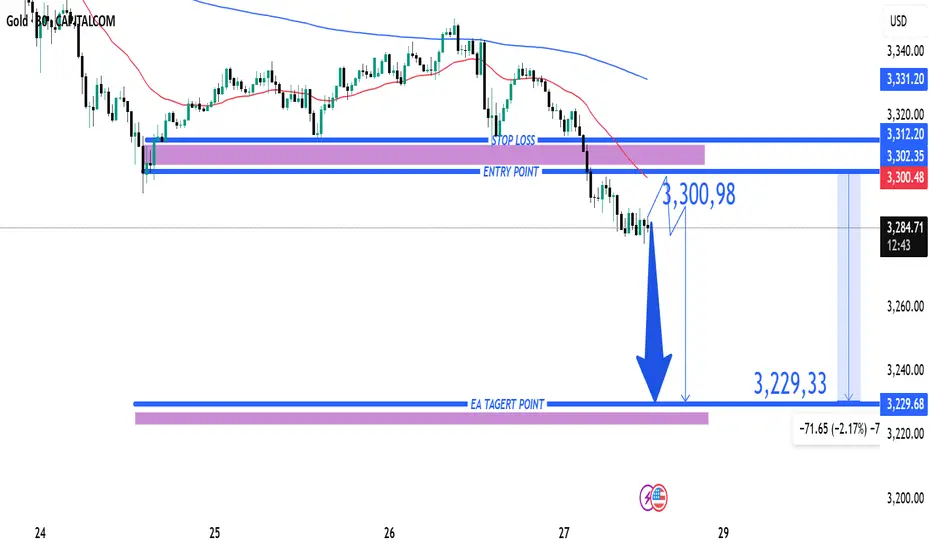
Gold (XAU/USD) Bearish Trade Setup – June 27, 2025Entry Point: Around 3,300.98 USD
Stop Loss (SL): ~3,312.20 USD
Take Profit (TP): 3,229.33 USD
Current Price: 3,286.15 USD
Risk-Reward Ratio: ~1:6.3
(Potential reward ≈ 71.65 pts; risk ≈ 11.22 pts)
Technical Breakdown:
Trend:
The price is in a short-term downtrend, supported by:
Lower highs and lower lows.
Price trading below both 50 EMA (red) and 200 EMA (blue), confirming bearish momentum.
Bearish Breakout:
Price broke below a key support-turned-resistance zone near 3,300–3,302, triggering sell pressure.
Resistance Area:
Strong rejection at 3,302–3,312 zone, which is now acting as resistance.
SL is placed just above this zone to protect against false breakouts.
Target Zone:
TP set at 3,229.33, aligning with a previous support zone — a logical area for price to react.
Strategy Notes:
Bias: Bearish
Entry confirmation: Already triggered.
Risk Management: SL placement is tight and strategic; RR ratio is highly favorable.
Next support below TP: If 3,229 breaks, further downside could follow.
Summary:
This setup shows a well-defined bearish continuation with a clean break of support, a controlled SL above resistance, and a strong RR ratio. A suitable trade for trend-following strategies, but price must not retrace above 3,312 for this idea to remain valid.
Gold at Crucial 325x Support – What's Next for the Yellow Metal?XAUUSD D1 Forecast: Gold at Crucial 325x Support – What's Next for the Yellow Metal?
Namaste, fellow traders!
Today, let's zoom out and look at the bigger picture for Gold (XAUUSD) on the Daily (D1) timeframe. Our analysis indicates that Gold has hit a very strong, hard support level around the 325x region. This is a pivotal point that could dictate Gold's medium to long-term direction!
🌍 Macroeconomic Context: The Forces at Play for Gold
While we've seen some USD weakness due to speculations surrounding the Fed (like the rumors about replacing Powell) and expectations of rate cuts, these factors haven't completely prevented Gold's recent decline on the daily chart. Also, the sustained ceasefire between Israel and Iran is reducing Gold's safe-haven appeal.
However, the current price action at the robust 325x support level is a significant technical signal. The influence of upcoming US macroeconomic data (especially the PCE Index on Friday) and speeches from FOMC members will be crucial in confirming or negating Gold's next moves. If positive news for Gold aligns with this support holding, it could act as a strong catalyst.
📊 XAUUSD Technical Analysis (D1): Predicting Gold's Next Move
Based on the fact that Gold has encountered strong support at 325x, we can anticipate the following scenarios:
Bounce from 325x (Potential Upside Phase):
If the 325x area (which reinforces the 3264.400 support from image_e9d325.png) holds firm, we expect a strong reaction and an upward move for Gold.
The initial target for this bounce would be the 332x region, which aligns with resistance levels 3313.737 - 3330.483 from our previous analysis. On a broader timeframe (as shown in image_83845c.png), this corresponds to the resistance zone around 3326.022. This 332x area could represent a continuation pattern, meaning it might be a corrective rise before the resumption of the larger trend.
Resumption of Downtrend (After Reaching 332x):
Once Gold reaches and tests the 332x zone (3313.737 - 3330.483 / 3326.022) and shows bearish confirmation signals (e.g., a strong bearish engulfing candle, a pin bar, or a clear top formation), we anticipate a resumption of the downward movement.
The next major target for this fall would be the 317x area, which correlates well with the strong support at 3173.052 on the larger timeframe (as depicted in image_83845c.png).
🎯 XAUUSD D1 Trading Plan: Your Long-Term Strategy Ahead!
Considering the current D1 analysis, here's our actionable plan:
1. BUY PHASE (Bounce from Support):
Entry: Observe price reaction in the 325x - 326x zone (especially 3264.400). Only buy if there are clear bullish confirmations (e.g., a confirmed bullish pattern on the daily or 4-hour candle, a strong bounce from the zone with volume).
SL: Just below the 325x support zone (e.g., 3245-3240, depending on confirmation).
TP: 3280 - 3290 - 3300 - 3313.737 - 3326.022 (key 332x zone). This will be our primary target for the bounce.
2. SELL PHASE (Downtrend Resumption):
Entry: After the price reaches the 332x zone (3313.737 - 3330.483 / 3326.022) and shows bearish confirmation signals (e.g., strong bearish engulfing, pin bar, or top formation).
SL: Slightly above the 332x zone (e.g., 3335-3340).
TP: 3300 - 3290 - 3280 - 3270 - 3260 - 3250 - 3200 - 3173.052 (final 317x target).

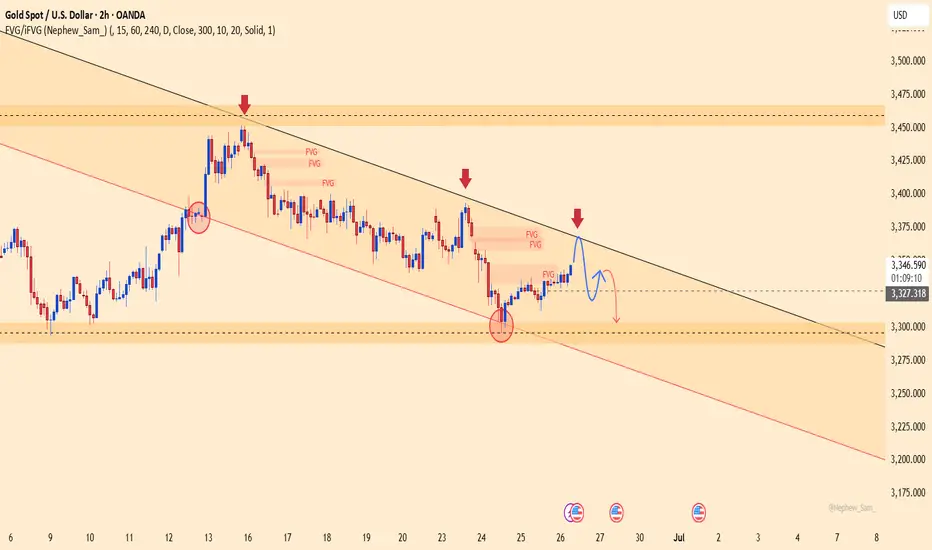
XAUUSD – Bull Trap Revealed, Drop Toward 3,304 Incoming?Gold is retesting the descending trendline around 3,366, but rejection signals are starting to emerge. The recent bounce only tapped into a Fair Value Gap – a hidden liquidity zone – and is now losing momentum.
The structure remains bearish with lower highs, and the downtrend channel continues to dominate price action. If 3,366 gets rejected again, a sharp move toward 3,304 could be triggered – or even lower.
Fresh news supports the bearish case:
U.S. jobless claims beat expectations → USD strengthens
Iran–Israel ceasefire → Gold loses safe-haven appeal
Trading Analysis for Gold Spot / U.S. Dollar (15-Minute Chart)
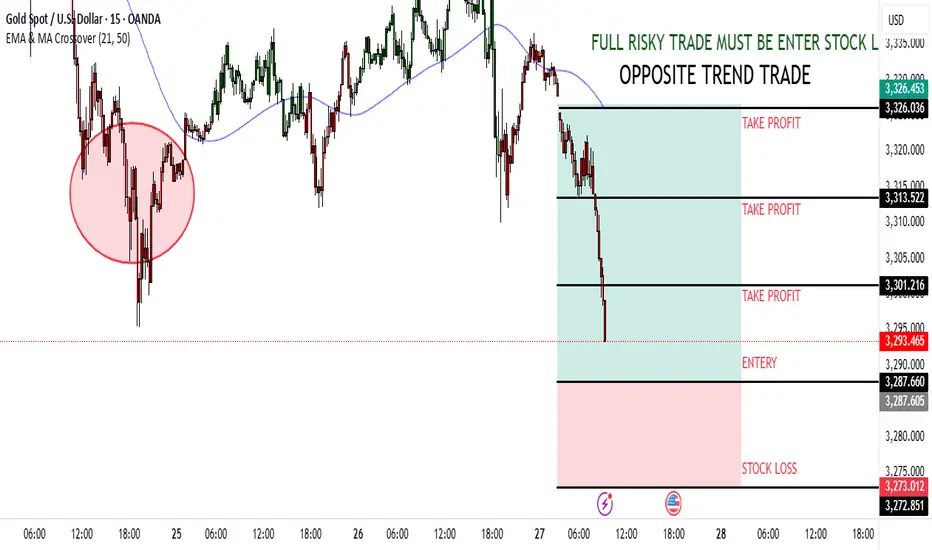
Based on the provided 15-minute chart for Gold Spot / U.S. Dollar (XAU/USD), published by NaviPips on TradingView.com on June 27, 2025, at 09:20 UTC, here’s a suggested trading setup for a sell position:
1. **Current Price and Trend**: The current price is 3,295.890, with a slight decline of -0.235 (-0.10%). The chart shows a recent uptrend that appears to be exhausting near the current level, with a potential reversal indicated by the EMA crossing and a bearish candle.
2. **Sell Entry**: Enter a sell position at 3,295.890 (current price), as it aligns with the resistance zone where the price has peaked and started to decline, supported by the "FULL RISKY TRADE MUST BE ENTER OPPOSITE TREND TRADE" label.
3. **Stop Loss**: Place a stop loss at 3,275.012, below the recent low, to protect against an upward continuation. This level is approximately 20.878 points below the entry, defining the risk.
4. **Take Profit Levels**:
- **Take Profit 1**: 3,326.453, a conservative target about 30.563 points above the entry, aligning with a minor resistance zone.
- **Take Profit 2**: 3,315.522, a mid-range target approximately 19.632 points above the entry.
- **Take Profit 3**: 3,301.216, a deeper target about 5.326 points above the entry.
- **Take Profit 4**: 3,287.605, the furthest target, approximately 8.285 points below the entry, indicating a potential trend reversal.
5. **Price Action**: The chart shows an uptrend with a recent peak followed by a bearish reversal signal. The EMA crossover and the "opposite trend trade" label suggest a high-risk sell setup against the prevailing uptrend.
6. **Risk-Reward Ratio**: The distance to the stop loss (20.878 points) compared to the take profit levels (5.326 to 30.563 points) presents a mixed risk-reward profile. Take Profit 1 offers a 1:1.5 ratio, while lower targets like Take Profit 4 result in a negative ratio, highlighting the high-risk nature of this trade.
### Conclusion
Enter a sell at 3,295.890, with a stop loss at 3,275.012 and take profit levels at 3,326.453, 3,315.522, 3,301.216, and 3,287.605. This is a high-risk trade due to the "opposite trend" strategy, so confirm the reversal with additional indicators and be prepared for potential continued upward momentum if the stop loss is hit.
Gold Correction Hits $3280: Recovery Challenged at $3316Gold has been declining in a consistent descending channel and yesterday's recovery attempts failed to gain confirmation of $3338 resulting in a strong correctional wave breaking below psychological zone $3300 followed by extending to $3280
Immediate resistance $3300 and $3316 pose as challenge for any bounce back off the lows.
If recent low of $3280 is breached, next downside target sits at $3268 which aligns with descending channel support.
Break below $3268 will call for further decline to $3248
Meanwhile, if buying momentum emerges from value bargain areas, strong rebound may be witnessed on sustained break above $3300 followed by next hurdle to be cleared at $3316

XAUUSD / GC / GOLD ANALYSIS 27-Jun-2025LTP 3283
Resistances: 3455/3501
Support: 3250/3119
As per my analysis Gold is trading in a range between 3119-3501.
As long as this range holds, we can see sideways move as a triangle before big breakout.
Above 3501, we can see big bull run towards 4000/5000 USD.
Break of 3119, can see 2800/700/2500-400.
As per my view, I am still bullish for 3700+ first as long as 3119 holds support.

bears active, gold price below 3300Plan XAU day: 27 June 2025
Related Information:!!!
In fact, Powell reiterated this week that the Fed is well-positioned to wait before cutting interest rates until it has a clearer understanding of the impact of steep tariffs on consumer prices. His comments sparked fresh criticism from US President Donald Trump, who has been calling for lower interest rates. Furthermore, reports indicate that Trump is considering naming Powell's successor by September or October.
This development raises concerns about a potential erosion of the Fed’s independence, which should limit any immediate positive reaction in the USD to the upcoming inflation data. In turn, this suggests that the path of least resistance for the XAU/USD pair remains to the upside, and any further decline may still be viewed as a buying opportunity.
personal opinion:!!!
Gold prices are consolidating around 3280 - 3290 in the European trading session, accumulating for selling pressure to prevail.
Important price zone to consider : !!!
BUY point: 3272; 3248 zone
Sustainable trading to beat the market

XAUUSD Possible DAILY ENTRY MODELAccording to my strategy and news and time zonnes ive created and filtered myself and last using my ow fibonacci model im planning a long trade in two hour from now Stoploss and Targets you can see on the charts

Gold - Wolfe Wave or Shakeout after Breakout?TF: 144 minutes
In simple Price action set up (Support & Resistance - Horizontal lines), price has taken out the Swing High at 3438-3440 and then corrected. This is a common/Normal phenomenon in price action set ups. So, people with the Long Bias can use the dips to buy/accumulate.
At the same time, the trendline set ups suggest a possible Wolfe Wave formation in progress.
Price has broken out of the trendline at the top and is now trading inside the overhead resistance trendline.
As Per this Wolfe Wave set up, price could possibly head lower towards 3250.
My Take: Until and unless we trade and sustain above 3440, most likely we would first hit the trendline from the low at around 3350 and then possible head towards the final target 3250.
Trade with caution!
Disclaimer: I am not a SEBI registered Analyst and this is not a trading advise. Views are personal and for educational purpose only. Please consult your Financial Advisor for any investment decisions. Please consider my views only to get a different perspective (FOR or AGAINST your views). Please don't trade FNO based on my views. If you like my analysis and learnt something from it, please give a BOOST. Feel free to express your thoughts and questions in the comments section.

Gold Pullback in Play – Will $3,300 Be Hit Today?Hello traders!
What’s your take on gold today?
OANDA:XAUUSD remains tilted to the downside, currently trading around $3,318, down over 100 pips on the day.
The bearish bias is still favored — and the reason is pretty clear. For short-term traders using pattern-based setups, gold has broken out of a flag pattern and successfully retested the breakout zone, confirming a potential reversal.
If this momentum holds, the next target could be $3,300 by the end of the day.
Do you agree with this scenario?

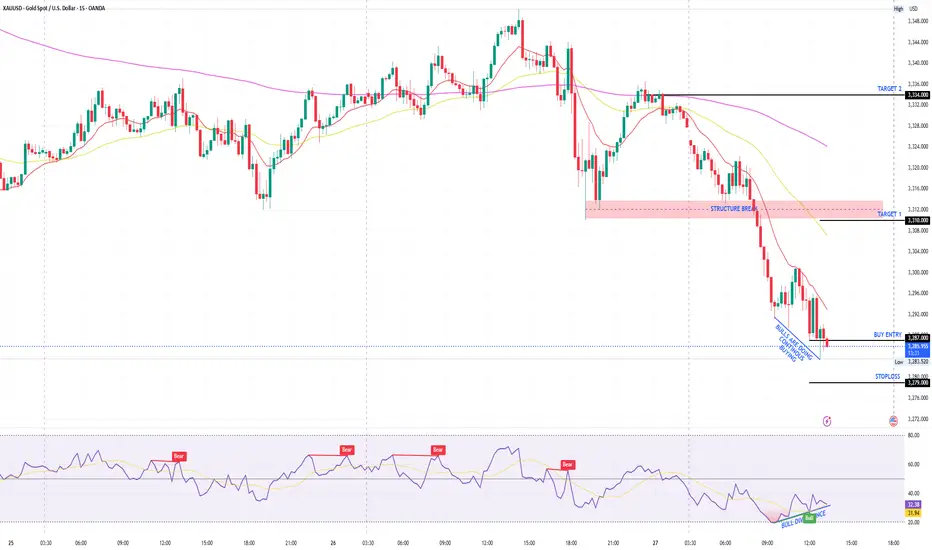
BULL DIVERGENCE IN GOLD AT OVERSOLD ZONE IN LOW RSI LEVELAt lower price, bulls are buying with bulk quantity. We can see on the RSI indicator that the value is increasing. At the same time, the price of gold is decreasing. This suggests that the bulls are getting ready to come back at some level. That is why we are buying gold.
XAUUSD XAUUSD Completing C Wave Which Is 61.8 So Traders Choose Buy Plan From Green Mark Price, Also Remember If Market Cross The 61.8 Green Marked Area Then Choose Next 100 Target Buy Area. BEST OF LUCK Gold will rise soon

XAUUSD Setup Short Trade Opportunity Below ResistanceCurrent Price: 3,327.56 USD
Entry Point: 3,332.67 USD
Stop Loss: 3,342.45 USD
Take Profit Levels:
Target 1 (Downside): 3,294.45 USD (-1.17%)
Target 2 (Upside): 3,393.78 USD (+1.50%)
🔧 Technical Indicators & Tools
Trade Line: Upward sloping trendline connecting higher lows, supporting recent bullish structure.
Moving Averages:
Red: Short-term (likely 50-period EMA)
Blue: Long-term (likely 200-period EMA)
Price is still trading below the long-term MA, suggesting broader bearish pressure.
Resistance Zone: 3,334.96–3,341.30 — a key supply area marked in purple.
Support Zone: 3,294.45 — identified as a previous demand level.
⚖️ Risk-Reward Analysis
Short Setup:
Entry: 3,332.67
Stop Loss: 3,342.45 (Risk ~10 USD)
Target: 3,294.45 (Reward ~38 USD)
R:R Ratio ≈ 1:3.8, which is favorable for a short trade.
📌 Summary
Bias: Bearish intraday
Setup Type: Short-sell at resistance zone
Confirmation: Price rejection or bearish candle near 3,334–3,342 zone
Invalidation: Break and close above 3,351.06 (upper resistance)

Update gold price 27/6/2025To end this second quarter candle, gold will go up and down in my opinion.
Any attempt for long Swing trading will not be executed as the price sweeps up and down.
It is a necessary and sufficient condition when the market lacks liquidity.

XAUUSD: Gold's Golden Glow Fades Below $3350 XAUUSD: Gold's Golden Glow Fades Below $3350 – Navigating Key Levels Amidst USD Weakness!
Let's dive into the fascinating world of Gold (XAUUSD) today. The yellow metal is showing subtle positive movement, primarily influenced by a weaker US Dollar, but a convincing bullish breakout above the $3350 mark remains elusive.
🌍 Macroeconomic Snapshot: USD's Woes & Gold's Mild Support
Gold has seen a slight positive bias for the second consecutive day, yet it's struggling to find significant follow-through, staying below the $3350 level in early European trading.
USD Under Pressure: Reports indicating that US President Donald Trump is considering replacing Fed Governor Jerome Powell have sparked concerns regarding the future independence of the US central bank.
Cautious Outlook: This mixed bag of news calls for caution before confirming a definitive bottom for Gold or positioning for a substantial recovery from levels below $3300 (or Tuesday's two-week low). Traders are currently focused on upcoming US macroeconomic data and speeches from FOMC members, which could influence XAU/USD ahead of Friday's crucial US Personal Consumption Expenditures (PCE) Price Index release.
📊 XAUUSD Technical Analysis & Intraday Trading Plan:
Current Trend: Gold has recently experienced a sharp decline and is now in a consolidation phase, trading around the $329X mark. Price is currently below shorter-term moving averages, indicating lingering bearish pressure or an accumulation phase.
Key Levels Identified:
Strong Support Zones (Potential BUY Areas): Levels around 3294.414, 3276.122, and particularly 3264.400 are crucial demand areas.
Key Resistance Zones (Potential SELL Areas): Levels at 3313.737, 3321.466, 3330.483, and 3341.947 are identified as significant supply zones.
🎯 XAUUSD Trading Plan (Based on your specified levels):
BUY ZONE (Strong Support - Long-Term Bias):
Entry: 3266 - 3264
SL: 3270
TP: 3280 - 3284 - 3290 - 3295 - 3300 - 3305 - 3310 - 3320
BUY SCALP (Quick Buy at Intermediate Support):
Entry: 3284 - 3282
SL: 3278
TP: 3288 - 3292 - 3296 - 3300 - 3305 - 3310 - 3320 - 3330
SELL ZONE (Key Resistance):
Entry: 3331 - 3333
SL: 3337
TP: 3326 - 3320 - 3316 - 3310 - 3305 - 3300
SELL SCALP (Quick Sell at Near Resistance):
Entry: 3313 - 3315
SL: 3320
TP: 3310 - 3305 - 3300 - 3295 - 3290 - 3280
⚠️ Key Factors to Monitor Closely:
US Macro Data: The upcoming US Personal Consumption Expenditures (PCE) Price Index on Friday is critical.
FOMC Member Speeches: Any comments on monetary policy or inflation outlook will directly impact USD and Gold.
Geopolitical Stability: Developments regarding the Israel-Iran ceasefire can influence safe-haven demand.
