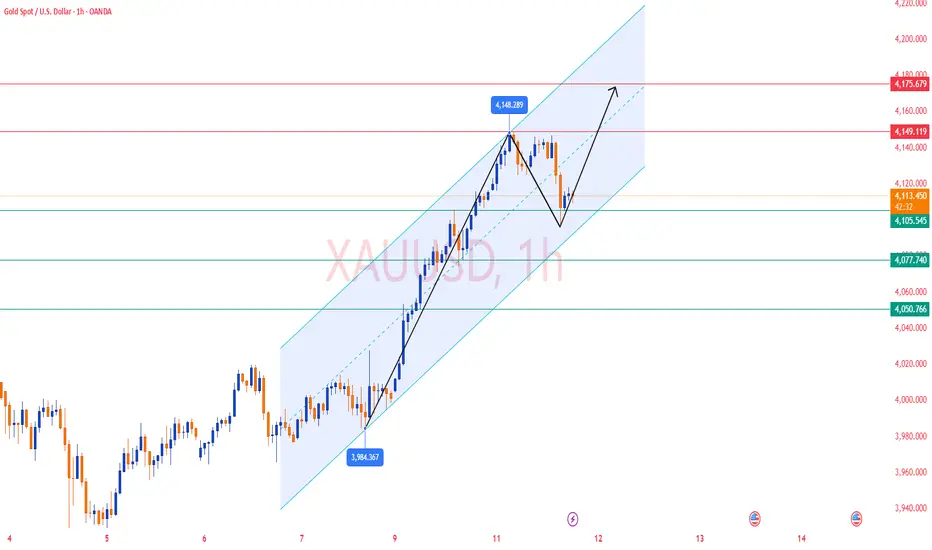
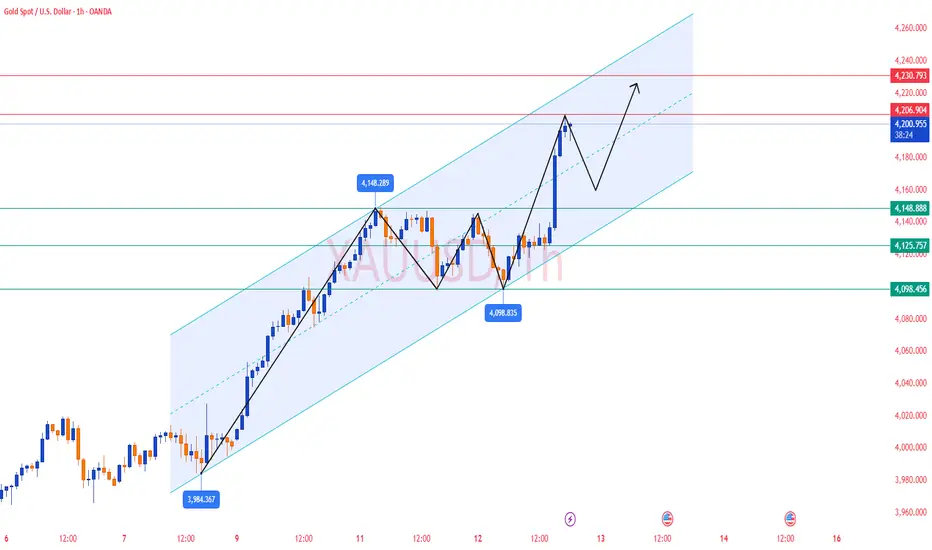
2 bull flags in 2 months XAUUSDTwo bull flags in just 2 months retracing it from 4233 back to where it came from. Thoughts???
Trade ideas

GOLD REVERSAL AREA GOLD will reverse from this area for sure if you see any CHoCH in these level in 5MIn hold it till bottom

WILL GOLD CONTINUE TO RISE?I. BASIC CONTEXT
On November 10, 2025, gold prices surged after the market reacted positively to news of the U.S. government reopening.
The current market sentiment expects the FED to cut interest rates soon as recent economic data indicates a weakening U.S. economy.
Lower interest rates mean cheaper money, a weaker USD, thereby driving funds into safe-haven assets like gold.
The current rally is seen as a news-based pullback, potentially extending to key resistance areas before the market establishes a medium-term trend.
II. TECHNICAL ANALYSIS
Main timeframe: H2
Market structure:
Gold prices have broken out of the accumulation triangle pattern.
Formation of an Inverse Head and Shoulders pattern → signaling the correction phase has ended.
III. TRADING SCENARIOS
✅ Main scenario: WATCH TO BUY THE TREND (BUY THE DIP)
Trend expectation: Prices continue to extend the pullback to resistance areas 4180–4220.
Buy zones (BUY ZONES):
Zone 4105–4103 (near old H2 resistance → becoming new support).
Zone 4115–4116 (confirmation area post-breakout).
Deeper zone: 407x – 405x (Fib 0.618, trendline confluence area).
If prices retest the H2 structure: 4040 – 4035.
Buy stop:
When prices break through the 416x area with strong candle force → a buy stop can be placed to follow the breakout momentum.
Note to check the timing and candle force on H2/M30 to confirm momentum.
⚠️ Alternative scenario: WATCH TO SELL REACTION
If clear signs of weakness appear at resistance, consider a short SELL reaction at:
4180–4185
4205–4220
These are potential profit-taking areas for the current pullback wave.
IV. RISK MANAGEMENT
Stop Loss (SL): 10 points
Take Profit (TP): 10–12–13 points depending on setup
RR ratio: 1:1 – 1:1.3
Prioritize capital management according to the principle R ≤ 1% account/order.
Additionally, monitor news on Mr. Trump's actions during this period.
The U.S. government has reopened this week, so expect a fair amount of news, stay alert.
Trade effectively

XAUUSDAs we see gold has been giving short opportunities timing is the key , I prefer for best sniper entry rather. Entering in fomo please checkout my idea.
KEEP IT SIMPLE.
DROP BASE DROP BOYS...

GOLD SHORTI was bearish on gold today was looking for a good opportunity although I didn't got chance to get entry up but got another chance and made short entry you can checkin the idea

Gold likely to come downAs obvious from my previous chart.
the correction is major 4 th wave correction.
After 5 wave up move forming 3 rd wave major
gold had undergone correction to form A wave
and this pull back is B wave and C wave correction
has started.it should violate low of wave A and come down more.
please go through the chart and my previous posts to understand
clearly.
like this post if it helps you..follow me to get updates

Gold Analysis and Trading Strategy | November 11-12✅From the 4H chart, gold experienced a strong bullish rally after breaking above the 4077 pivot level and reached a recent high of 4148.99.
However, after consecutive bullish candles, the price faced resistance near the upper Bollinger Band (4154.85) and has since pulled back slightly.
Currently, the price is hovering near 4110–4115, just above the MA10 (4104.83) and MA20 (4051.26) — this area serves as a short-term support zone.
The Bollinger Bands remain in an expanding state, indicating that overall volatility is still active.
If the price stabilizes above 4105–4110, the bullish structure remains intact; a break below this zone could trigger further pullback toward 4077–4050.
✅On the 1H timeframe, gold shows a short-term correction after peaking at 4148.
MA5 and MA10 have formed a bearish crossover, and the price is currently below them, signaling short-term bearish pressure.
Bollinger Bands are starting to narrow, reflecting decreasing volatility and a possible sideways consolidation phase.
The MACD has formed a dead cross, and the momentum indicator shows continued downside pressure, but near-term support appears around 4107–4090.
🔴 Resistance levels: 4148 / 4155 / 4175
🟢 Support levels: 4105 / 4077 / 4050
✅ Trading Strategy Reference
🔰 If gold rebounds to 4145–4148 and faces resistance, consider light short positions, targeting 4105–4077, with a stop loss above 4155.
🔰 If gold drops to 4100–4110 and stabilizes, consider short-term long positions, targeting 4130–4150, with a stop loss below 4065.
📈The overall structure remains bullish on higher timeframes, but short-term correction pressure is visible.
In the near term, focus on the 4100–4145 trading range — sell high, buy low within the band, and wait for a clear breakout to determine the next major direction.
XAU Empire | Bullish FlowXAU Empire | Bullish Flow
The market maintains a bullish structure after confirming a break of structure (BOS). Price is currently retracing into a short-term demand zone near 4,100, showing healthy correction within trend. This zone is acting as accumulation before potential continuation.
Momentum supports a move toward 4,316 – 4,386, aligning with unfilled imbalance and previous supply area. Institutional flow remains on the buy side as long as price holds above 4,080.
---
Market Bias: Bullish
Short-Term Range: 4,100 – 4,386
Key Focus: Retracement for continuation

Elliott Wave Analysis – XAUUSD | 13/11/2025🔸 1. Momentum
D1 Timeframe
• D1 momentum continues to close inside the overbought zone, signaling weakening buying pressure.
• A bearish reversal may occur at any moment.
H4 Timeframe
• H4 momentum is also in the overbought zone and starting to contract → a potential signal that H4 may soon turn downward.
H1 Timeframe
• H1 momentum is currently oversold, so a short-term bounce is likely to push momentum back toward the overbought area.
________________________________________
🔸 2. Wave Structure
D1 Structure
• No significant change compared to yesterday; price is still heading toward the completion zone of wave X.
H4 Structure
• Price is inside wave X and currently reaching the 0.618 Fibonacci retracement of wave W (purple).
• This area aligns with both D1 and H4 momentum, creating a strong reversal confluence.
• We wait for an H4 bearish close to confirm the potential top of wave X.
• Note: The current H4 candle is compressing tightly, so one more upward spike is still possible before reversal.
H1 Structure
• Within the red 5-wave sequence, a smaller 5-wave black structure is developing.
• RSI showed a bearish divergence at the top of wave 3 (black) → early signal of a wave 5 top forming.
• Based on wave projections, wave 5 black (which also completes wave 5 red and wave X) may extend into:
o 4223 (0.382 Fibo of wave 1–3)
o 4248 (0.618 Fibo of wave 1–3)
Confluence for wave-top formation:
• RSI divergence between wave 3 and wave 5
• H1 momentum rising into overbought then reversing
→ This supports the expectation of wave X topping around these zones.
________________________________________
🔸 3. Trading Plan
You have three entry options, depending on your trading style:
✅ 1. Sell Limit: 4223 – 4225
• SL: 4233
• TP1: 4181
• TP2: 4145
• TP3: 4046
✅ 2. Sell Limit: 4248 – 4250
• SL: 4260
• TP1: 4181
• TP2: 4145
• TP3: 4046
✅ 3. Sell Stop at 4181
• Trigger only when the candle closes below 4181 (wave 4 black low).
• This method offers stronger confirmation, since structure breaks down before entry.
________________________________________
📌 Summary
• Wave X is approaching its final target area and multiple signals support a potential top.
• H1 may still push higher toward 4223–4248 before reversing.
• These two zones are strong sell areas with momentum and divergence confluence.
• All three entry methods (limit – limit – breakout) provide strategic options depending on risk preference.

GOLD: Big Pullback Loading Before a 4400 Rally?Bias: Bullish – Buy-the-Dip Strategy
Approach: Smart Money Concepts (SMC)
🌐 Market Context
Gold continues to show a strong recovery, maintaining a clear bullish structure across the H1, H4, and Daily timeframes.
Institutional order flow remains firmly on the buy-side as:
Liquidity on H1/H4 highs is being swept consistently
Pullbacks are respecting Demand Order Blocks (OBs)
Multiple Breaks of Structure (BOS) confirm bullish continuation
However, the region 4280 – 4330 (FVG + major trap zone) has historically triggered strong distribution – making it a likely area for liquidity hunts and fake breakouts before any corrective move.
🎯 Key Price Levels
🔴 Resistance Zones (Potential Distribution Areas)
4274 – 4295
4330 – 4345 (FVG + Biggest Trap Zone)
Expect volatility and sharp reactions here – suitable for partial profit-taking, not for chasing buy entries.
🟢 Support / Buy Zones (Institutional Demand Areas)
1️⃣ BUY Opportunity – Shallow Pullback (High Probability)
Entry: 4170 – 4190 (H4 OB + BOS retest)
SL: Below 4170
TP1: 4275
TP2: 4360 – 4400
➡️ This is today’s primary setup. Requires clear bullish confirmation on entry.
2️⃣ BUY Opportunity – Deep Pullback (High R:R Setup)
Entry: 4100 – 4120 (Deep OB + liquidity sweep level)
SL: Below 4100
TP1: 4275
TP2: 4360 – 4400
➡️ Best scenario if the market retraces deeply — exceptional Risk:Reward.
📉 Why Selling Is Not a Priority
Despite resistance overhead, the market remains:
Bullish in structure
Supported by demand zones
Without a confirmed Market Structure Shift (MSS) → Bearish BOS
Therefore, selling remains counter-trend and not part of the main trading plan today.
📈 Institutional Technical Outlook (H1/H4)
1. Price approaching 4280 – 4330 trap zone
Expect:
Liquidity sweeps
Wick-driven false breakouts
Short-term corrections back into OB before continuing upwards
2. Liquidity Map
4170 liquidity pool below current price → likely target for engineered pullback
4300 – 4350 equal highs → attractive upside draw for smart money
🧠 Professional Trade Plan Summary
✔️ Do not chase breakouts near resistance
✔️ Wait for price to retrace into:
4170 – 4190
4100 – 4120
✔️ Main targets:
TP1: 4275
TP2: 4360 – 4400
✔️ At TP1:
Secure 50%
Move SL to Break-Even
✔️ Plan invalidation if price closes below 4100
📌 Notes for Large-Capital Traders (UK/EU)
Today’s environment is ideal for high-quality, low-frequency entries at institutional demand zones.
Avoid buying at highs; patience will deliver the best setups.
This plan follows a clean institutional trend-following methodology — suitable for accounts prioritising consistency and low drawdown.
📊 Daily Bias: Strong BUY
⏳ Waiting for pullback towards 4170 – 4190 or 4100 – 4120
🚀 Targeting 4360 – 4400 over the next sessions

Gold Retests FVG Preparing for a New Uptrend, Target 4,120 USD📊 Market Structure
Gold has officially broken the bearish structure (BoS + ChoCH) by surpassing the 4,025 USD zone, confirming a significant shift in market momentum.
Following a series of consecutive BoS and a break of the downtrend line, the price is entering a balanced retest phase (FVG 4,030 – 4,040 USD) .
As long as the price maintains above the 4,020 USD support zone, the bullish structure remains intact, and it is expected to target the Liquidity Zone 4,070 – 4,090 USD , further extending to the Order Block 4,118 – 4,125 USD .
💎 Key Technical Zones
• FVG Retest Zone: 4,030 – 4,040 USD
• Trendline Support: around 4,000 USD
• Liquidity Zone: 4,070 – 4,090 USD
• Final Target (OB): 4,118 – 4,125 USD
🎯 Trading Plan
1️⃣ BUY Setup #1 – Main FVG Retest
If the price retraces to the FVG zone of 4,030 – 4,040 USD and forms a bullish confirmation signal (bullish candle / rejection wick):
• Entry: 4,033 – 4,038
• SL: 4,020
• TP1: 4,070
• TP2: 4,090
• TP3: 4,120
→ Enter at the “discount” zone after the market absorbs liquidity.
2️⃣ BUY Setup #2 – Defensive (deep trendline retest)
If the price slightly sweeps the small OB zone around the trendline:
• Entry: 3,998 – 4,004
• SL: 3,985
• TP1: 4,070
• TP2: 4,120
→ The structure remains intact, this entry has a high RR, suitable for mid-term swing.
⚠️ Invalidation:
• If the price closes an H1 candle below 3,985 USD → the short-term uptrend is invalidated.
🧠 Vincent’s View
The buyers are fully controlling the H1 structure after breaking the downtrend line that lasted nearly 2 weeks.
The price is likely to complete the FVG – trendline – breakout retest before continuing to expand towards the liquidity peak of 4,120 USD.
This is the “buy-the-dip” strategic phase for this week.
“Smart money buys the discount while everyone waits for confirmation.” ⚜️🟡
⏰ Timeframe: 1H
📅 Updated: 11/10/2025
✍️ Analysis by: Captain Vincent

Gold (XAU/USD) Testing Key Resistance – Potential Pullback BeforAnalysis:
Gold (XAU/USD) is currently trading around 4145, approaching a significant resistance zone between 4100 and 4120, marked as the first target region. This level previously acted as strong resistance, and price may experience a temporary pullback before resuming upward momentum.
The strong psychological support zone near 3890–3920 served as a solid foundation for the recent bullish reversal, confirmed by double-bottom formations and consistent higher highs.
If gold maintains momentum above 4120, the next upside target lies around 4210, aligning with previous structural highs and a major supply zone. However, rejection from the current resistance could trigger a short-term retracement toward 4100 before another push upward.
Summary:
Immediate Resistance: 4100–4120
Next Target: 4210
Key Support: 3890–3920
Bias: Bullish above 4100, potential retracement before continuation

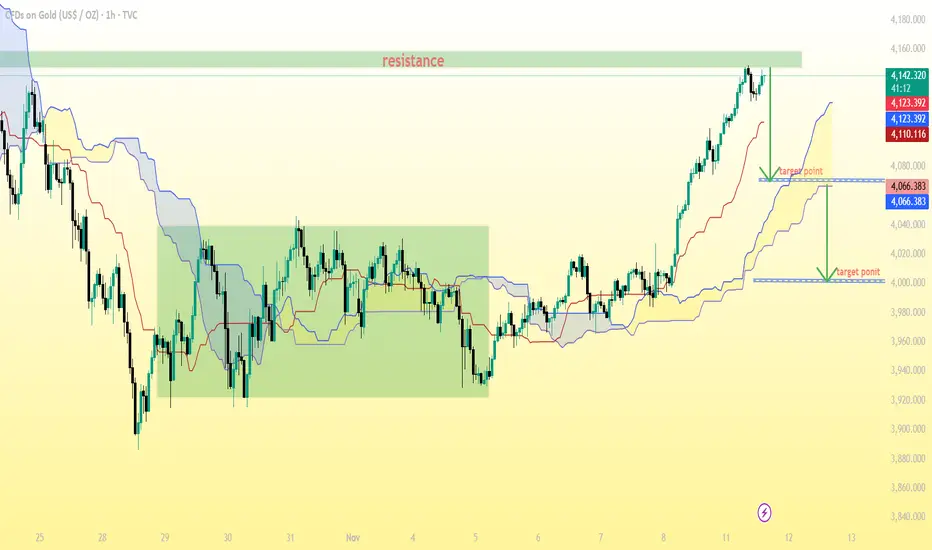
GOLD (XAU/USD) 1-hour chart Pattern..GOLD (XAU/USD) 1-hour chart with Ichimoku Cloud, and my marked resistance and two target points.
Here’s the analysis based on what’s visible:
Current price: Around $4,141 (based on my chart labels).
Resistance zone: Around $4,140 – $4,150, which is where price is currently testing.
Upper target point (minor correction target): Around $4,123 – $4,125.
Lower target point (major correction target): Around $4,066 – $4,070.
📊 Interpretation:
If price fails to break resistance (4,150) and forms rejection candles, it could retrace toward:
Target 1: $4,123 (short-term support)
Target 2: $4,066 (cloud base and major support zone)
If price breaks and holds above 4,150, then the bullish trend can extend further upward, possibly toward $4,180–$4,200.
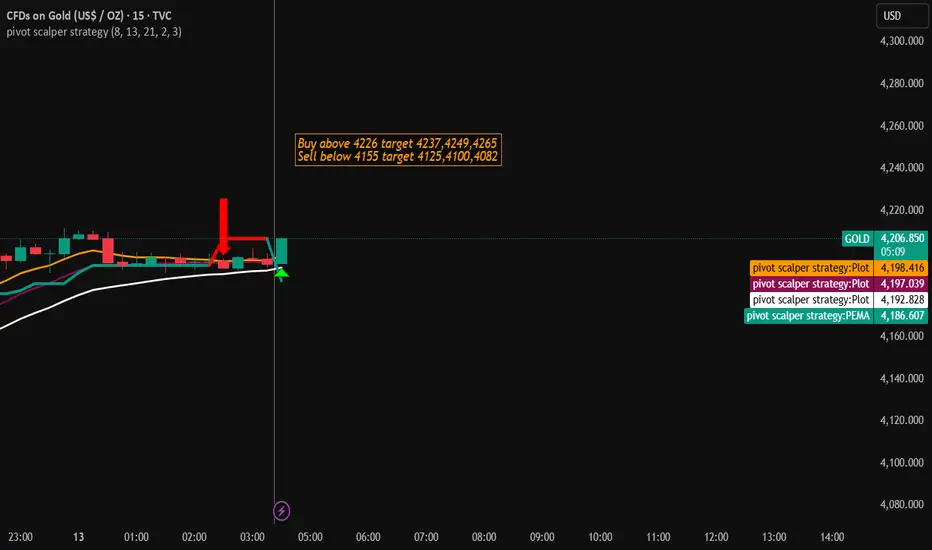
Gold Trading Strategy for 13th November 2025🌟 GOLD TRADE SETUP 💰
(Intraday / Short-term View)
📈 BUY Setup:
🔹 Entry: Buy above the high of the 1-hour candle close if price closes above $4226
🎯 Targets:
1️⃣ $4237
2️⃣ $4249
3️⃣ $4265
🛡️ Stop Loss: Below $4210 (or as per your risk level)
📉 SELL Setup:
🔹 Entry: Sell below the low of the 1-hour candle close if price closes below $4155
🎯 Targets:
1️⃣ $4125
2️⃣ $4100
3️⃣ $4082
🛡️ Stop Loss: Above $4170 (or as per your risk level)
⚠️ Disclaimer:
📜 This analysis is for educational and informational purposes only. It is not financial advice.
Trading in commodities like Gold ($XAU/USD) involves risk. Please conduct your own analysis and manage your risk properly before entering any trade.
✨ Tip:
Watch for strong volume confirmation and momentum breakout on the 1-hour chart before entry. Stay disciplined and avoid emotional trades! 💪
Gold Analysis and Trading Strategy | November 12-13✅From the 4H chart, gold surged sharply to a high of 4206.57 before experiencing a strong pullback, forming a long upper shadow. This indicates that bullish momentum weakened after testing resistance around the upper Bollinger Band (4203.88).
The current price is trading around 4190–4195, slightly above the MA10 (4133.81) and close to the Bollinger midline (4099.50) — this area serves as a short-term support zone. The MA5 (4140.23) remains above MA10, showing that the broader trend is still upward, but the sudden bearish candle signals short-term correction pressure.
The uptrend remains intact on the 4H timeframe, but the rejection near 4206 signals exhaustion of short-term buying power. If gold fails to reclaim 4200, a temporary pullback toward 4130–4100 is likely before another potential rise.
✅ On the 1H chart, gold spiked to 4206, then quickly reversed, forming a bearish engulfing candle. This reflects profit-taking pressure from intraday bulls.
The Bollinger Bands are widening, indicating increased volatility, and the price is currently testing the midline (4138.49) as a short-term pivot.
The MA5 (4181.73) is crossing below the MA10 (4154.48), forming a short-term bearish crossover, suggesting that gold may consolidate or correct slightly before resuming any uptrend.
MACD is showing early signs of divergence, with the histogram turning down after a strong expansion, confirming that momentum is cooling off.
🔴 Resistance levels: 4203–4206 / 4215–4230
🟢 Support levels: 4150–4155 / 4130–4138
✅ Trading Strategy Reference
🔰 If gold rebounds to 4200–4210 and shows resistance, consider taking light short positions, targeting 4150–4130, with a stop loss above 4220.
🔰 If gold drops to 4130–4140 and stabilizes, consider taking long positions, targeting 4180–4200.
📈 Summary:
Gold remains in a broader bullish structure, but short-term charts indicate correction pressure after the surge to 4206.
In the near term, focus on the 4100–4210 range.
Adopt a “sell high, buy low” approach — wait for retracement confirmation before entering new positions, and avoid chasing price near resistance levels.
Gold selling expected today 12-11-2025Gold is about to dump down by 1.5 percent today by chart analysis.
Lets see what happenes.
Waiting for structure to become bearish. If it makes lower low and then again
Then it will be down.

XAUUSD Short idea 12/11/2025Wassup Lads!!!!! Yeah cmonnnn, we're on a winning streak overall. So this is basically purely a time based model, it's simple nothing complex. Gold has taken out London highs and caused a change in the state of delivery, we'll look to go lower for a 2R Win. C'MON!! Let's keep winning!!

Candle Patterns Understanding the Basics of a Candlestick
Each candlestick represents the price movement of an asset within a specific time period — it could be one minute, one hour, one day, or even one week.
A candlestick consists of four main components:
Open – the price at which the asset started trading for the period.
Close – the price at which the asset finished trading for that period.
High – the highest price reached during the period.
Low – the lowest price reached during the period.
The body (the thick part of the candle) shows the range between the open and close prices.
If the close is higher than the open, the candle is bullish (usually green or white).
If the close is lower than the open, it’s bearish (usually red or black).
The thin lines above and below the body are called wicks or shadows, showing the highest and lowest traded prices.

XAU/USD – Tug of War Before CPI: Sideway or Breakout? 1. MARKET CONTEXT
The US government reopens after a 40-day shutdown (a historic record).
Investors are on the sidelines observing ahead of tomorrow's CPI announcement → the market is likely to sideway awaiting news.
2. TECHNICAL ANALYSIS (H1–M30)
Main fluctuation range: 4097–4148
Break 4097 → adjust deeply to 407x – 403x
Break 4148 → trigger short-term increase, target 418x – 4205
Decision zone: 4097 & 4148
3. TRADING PLAN
🎯 Main strategy: Trade within the range (Sideway)
→ “Buy low – Sell high” according to support/resistance zones
RR ratio: 1:1 – 1:2 | SL: 10 points | TP: 10–20 points
BUY zone:
4097–4100 (strong support) → TP 4110–4120
Buy scalp: 4120–4124 → TP 4140–4145
Buy swing: 407x / 403x (if there is a candle reaction)
SELL zone:
4145–4147 → TP 4125–4100
If break 415x & retest, switch to Buy breakout
→ Entry 4140–4145 | TP 416x–418x–4205
4. SUMMARY
Main trend: Sideway awaiting CPI news
Strategy: “Break whichever range, trade that range”
Focus zones:
Upper range: 414x (Sell)
Lower range: 4095–4100 (Buy)

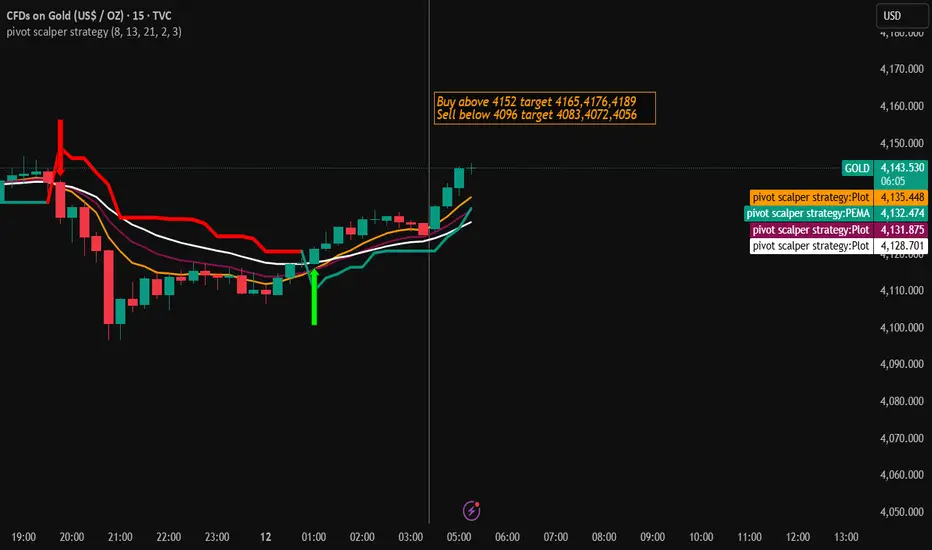
Gold Trading Strategy for 12th November 2025🪙 GOLD Trading Setup (Intraday Strategy)
📈 Buy Setup (Bullish Scenario)
👉 Condition to Enter Buy:
Wait for the 1-hour candle to close above $4152.
This confirms bullish momentum (buyers are taking control).
🎯 Targets after Buy Entry:
Target 1: $4165
Target 2: $4176
Target 3: $4189
🛑 Stop Loss (SL):
You can place your SL just below the breakout candle’s low or around $4140 (for risk control).
💡 Explanation for Beginners:
When the 1-hour candle closes above $4152, it means price has broken an important resistance level. This often attracts more buyers, pushing the price higher toward the target levels.
📉 Sell Setup (Bearish Scenario)
👉 Condition to Enter Sell:
Wait for the 30-minute candle to close below $4096.
This confirms bearish pressure (sellers are taking control).
🎯 Targets after Sell Entry:
Target 1: $4083
Target 2: $4072
Target 3: $4056
🛑 Stop Loss (SL):
Place SL slightly above the breakout candle’s high or near $4110 for protection.
💡 Explanation :
When the 30-min candle closes below $4096, it means the market is showing weakness. This setup allows you to follow the selling momentum as price moves toward lower levels.
⚠️ Risk Management Tips
Never trade without a stop loss.
Risk only 1–2% of your capital per trade.
Avoid entering trades before candle closes — always wait for confirmation.
Stick to your plan; don’t chase trades emotionally.
🧾 Disclaimer
⚠️ This analysis is for educational purposes only and not financial advice. Trading in gold or any financial market involves risk. Always do your own research or consult a financial advisor before making trading decisions.
#Gold | #XAUUSD 4H Update🔴 Price testing key resistance zones
🚧 $4129-$4133 / $4160-$4162
⚠️ Strong supply area — consider booking profits or tightening stops on longs.
👀 Only a clean 4H close above $4162 can open the way to $4185-$4205 .
#Gold TVC:GOLD #XAUUSD #PriceAction #Commodities #Trading #Forex #ChartPattern
📌 #Disclaimer: This analysis is shared for educational purposes only. It is not a buy/sell recommendation. Please do your own research before making any trading decisions.

Gold Reaches Supply Zone: Prepare for a Pullback to FVG📊 Market Structure
Gold continues to maintain its bullish structure after breaking the structure high (BoS) at the 4,000 USD zone and forming a steep bullish channel over the past 3 sessions.
Currently, the price is precisely hitting the Order Block 4,140 – 4,150 USD — a critical supply zone formed from the previous distribution.
The H1 candle is showing slight technical reaction signs , implying the potential for a short pullback to re-accumulate liquidity.
If a pullback occurs, the Premium Zone 4,080 – 4,085 USD and FVG 4,025 – 4,035 USD will be ideal areas to look for buy signals.
The bullish structure is only invalidated if the H1 candle closes below the Support 4,006 USD zone.
💎 Key Technical Zones
• Order Block: 4,140 – 4,150 USD → main supply zone, where profit-taking pressure appears
• Premium Zone: 4,080 – 4,085 USD → medium-term rebalancing zone
• FVG Zone: 4,025 – 4,035 USD → potential discounted price zone for BUY orders
• Support Zone: 4,000 – 4,006 USD → critical defense zone
🎯 Trading Plan
1️⃣ SELL Scalp – Reaction at OB 4,145 USD
If the price continues to react downwards at the 4,140 – 4,150 USD supply zone:
• Entry: 4,143 – 4,147
• SL: 4,155
• TP1: 4,085
• TP2: 4,035
→ Short-term setup, targeting the rebalancing zone before buying back in line with the trend.
2️⃣ BUY Setup – Continuation from FVG Zone
When the price pulls back to the FVG / Premium Zone and creates a confirmed bullish signal:
• Entry: 4,030 – 4,035
• SL: 4,006
• TP1: 4,090
• TP2: 4,145
• TP3: 4,170
→ Trend-following setup, preferred when the price re-accumulates and a clear rejection appears.
🧠 Vincent’s View
Buyers still control the market, but the current OB touch may trigger a short pullback before the bullish wave continues.
The ideal scenario is “tap OB → pullback FVG → continuation,” maintaining a stable bullish structure towards the 4,170 USD target.
“Buy the dip where fear replaces greed — that’s where the next impulse begins.” ⚜️
⏰ Timeframe: 1H
📅 Updated: 11/11/2025
✍️ Analysis by: Captain Vincent

Gold long trade Gold has breakout from inverted triangle after correcting from ath of 4282 amd consolidating between 3900-4030 for a nearby target of 4130-4140.
Further buy or sell decisions will b made after I touches these levels
