Elliott Wave Analysis – XAUUSD | November 11, 2025🔹 Momentum
• D1 timeframe:
Daily momentum has closed, showing that bullish strength is fading. We’ll wait for today’s daily candle to confirm whether a reversal is forming.
• H4 timeframe:
The two momentum lines are sticking together — this indicates that while upward pressure remains, it is weakening, suggesting a possible formation of wave X top.
• H1 timeframe:
H1 momentum is turning down from the overbought zone. With all three timeframes (D1, H4, H1) aligned, the current price area is likely marking a wave top.
________________________________________
🔹 Wave Structure
• D1 timeframe:
The corrective wave (4) is still developing. Once D1 momentum fully reverses and moves into the oversold zone, it may mark the final stage of the correction phase.
• H4 timeframe:
Price has reached the wave X target area around 4145.
With both D1 and H4 momentum in the overbought zone and starting to turn down, this level is likely the completion of wave X.
After that, price may begin a decline to complete wave Y.
The duration of wave Y is expected to correspond to the time it takes for D1 momentum to move from overbought to oversold.
• H1 timeframe:
The red 5-wave structure has completed, with price currently in wave (5).
The target area for wave (5) lies between 4145 and 4050, overlapping with the wave X target zone.
Therefore, the sell entry from yesterday around 4145 remains valid.
________________________________________
🔹 Trading Plan
• Sell Zone: 4145 – 4147
• Stop Loss: 4165
• Take Profit 1: 4075
• Take Profit 2: 4046
• Take Profit 3: 3932
⚠️ Note: If price closes below 4046, it will confirm that purple wave Y is in progress.
In that case, the target of wave Y could extend below 3855.
Trade ideas

Gold H1 – End of Wave 5: Is a Corrective ABC Coming?⚡ XAUUSD – Elliott Wave Intraday Outlook | 11/11
📈 Elliott Wave Context
Gold has completed a clean 5-wave impulsive structure on the H1 timeframe, with Wave 5 pushing into the premium zone above 4130.
Price now shows early exhaustion at the highs, suggesting the market is preparing to transition into a corrective ABC phase.
A confirmed reversal signal will be:
✅ H1 close below the Wave 2–4 trendline → confirming the start of Wave A.
🔎 Technical Breakdown (Wave Structure)
• Wave 1: Initial rally from 3964
• Wave 2: Shallow pullback near 3985
• Wave 3: Strong impulsive breakout toward 4070+
• Wave 4: Mid-cycle correction holding structure
• Wave 5: Final push topping around 4130–4140 (current swing high)
The 5-wave impulse is now completed → market likely moves into A–B–C correction.
📉 Expected Elliott Wave Path (ABC)
Wave A
• First levels: 4105 (Fibo 0.236)
• Main target zone: 4078 (Fibo 0.382)
Wave B
• Corrective rebound toward
o 4105, or
o 4115–4120
Wave C
• Strongest leg of correction
• Ideal target zones:
o 4035 (Fibo 0.618 retracement of the full 1–5 impulse)
o 4004 (Fibo 0.786 retracement)
• Wave C often ≈ Wave A → aligns with 4035–4004
📌 Intraday Trade Plan (Elliott-Based)
✅ Scenario 1 – SELL the upcoming correction (Preferred)
Entry:
• After H1 candle closes below the 2–4 trendline,
or wait for a Wave B retest into 4105–4120.
Stop Loss:
• Above the Swing High → 4145
Take Profit:
• TP1: 4078
• TP2: 4035
• TP3: 4004
✅ Scenario 2 – BUY only if wave invalidation occurs
If gold breaks and holds above 4145, Wave 5 may be extending.
Entry: above 4145
SL: 4120
TP: 4170–4200
✅ Summary
Gold has finished a textbook 5-wave impulse and is now likely entering a corrective ABC structure.
The highest-probability opportunity today is to sell the Wave B retracement and target deeper corrective zones at 4035–4004.

XAUUSD/GOLD 1H SELL PROJECTION 11.11.25XAUUSD/GOLD 1H Sell Projection (11.11.25) chart.
Here’s a quick technical breakdown of what this chart represents:
🟣 Setup Overview
Pair: XAUUSD (Gold)
Timeframe: 1 Hour (H1)
Bias: Bearish (Sell Setup)
🧩 Key Levels
Resistance / High: 4148.82
Stoploss: ~4141.63
Entry Zone: ~4129.45–4128.32
Target 1 (TP1): Around 4110 (S1 + FVG zone)
Target 2 (TP2): Around 4081 (S2 zone)
📉 Projection Logic
Price rejected from major resistance at 4148.
A short-term pullback / retracement is expected into the entry zone.
After possible retest, price is expected to drop towards TP1 and TP2.
The setup suggests a Risk-Reward Ratio (RRR) of roughly 1:2.5 to 1:3, favoring the sell side.
⚙️ Trading Idea Summary
Parameter Value
Bias Sell
Entry Range 4128–4130
Stop Loss 4141
Take Profit 1 (TP1) 4110
Take Profit 2 (TP2) 4081
R:R Ratio ≈ 1:3
Confirmation Bearish engulfing or rejection from resistance zone

XAUUSD Scalp Tape readingThese were my last two scalps on XAUUSD from the previous session (mid-NY). This is how I was reading the tape at that time.

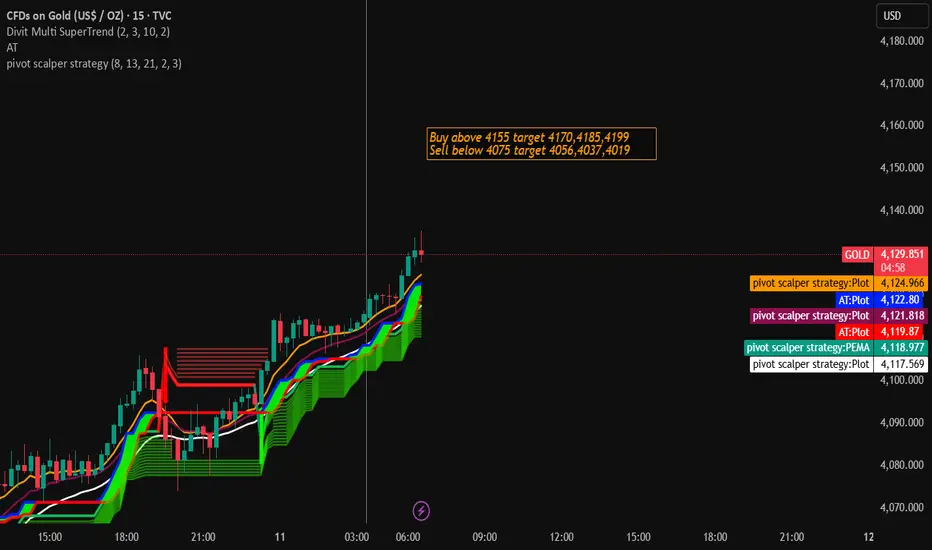
Gold Trading Strategy for 11th November 2025🟡 GOLD INTRADAY TRADING PLAN 💰
📈 BUY SETUP – BULLISH SCENARIO
If Gold shows strong momentum on the 1-hour chart and closes above $4155, it signals potential continuation of the uptrend.
Traders can look for buying opportunities once a candle closes and confirms above the high of that hour.
📋 Buy Entry Conditions:
✅ Wait for a 1-hour candle to close above $4155
✅ Confirm with good volume or strong bullish candle formation
✅ Enter above the candle’s high after confirmation
🎯 Upside Targets:
1️⃣ $4170 – Initial intraday resistance; partial profit zone
2️⃣ $4185 – Secondary resistance; hold with trailing stop
3️⃣ $4199 – Final target for the session
🛡️ Suggested Stop Loss:
Place a protective stop below $4140 or below the candle’s low (depending on your risk tolerance).
📊 Commentary:
A close above $4155 may attract fresh buying interest from intraday and short-term traders. Sustained trading above $4170 could strengthen bullish momentum toward higher targets.
📉 SELL SETUP – BEARISH SCENARIO
If Gold weakens and the 1-hour candle closes below $4075, it could indicate that sellers are gaining control.
A close below this level suggests a possible shift in short-term trend direction.
📋 Sell Entry Conditions:
✅ Wait for a 1-hour candle to close below $4075
✅ Enter below the candle’s low once price confirms breakdown
✅ Ensure downside momentum with volume confirmation
🎯 Downside Targets:
1️⃣ $4056 – First target; book partial profits
2️⃣ $4037 – Second target; hold position with trailing stop
3️⃣ $4019 – Final intraday target zone
🛡️ Suggested Stop Loss:
Place a stop loss above $4090 or above the breakout candle’s high.
📊 Commentary:
A confirmed close below $4075 can trigger a short-term bearish wave. Further weakness toward $4050–$4020 may be expected if sellers maintain control.
⚠️ Disclaimer
📜 This information is for educational and informational purposes only.
It is not financial advice or a recommendation to buy or sell any asset.
Trading in commodities like Gold involves risk of capital loss. Always do your own analysis and use strict risk management before entering any trade.
Gold – Distribution Before DropGold – Distribution Before Drop
Gold is showing signs of exhaustion after the recent corrective bounce. The 3H market structure highlights a clear distribution pattern, as price continues to reject from the 4,100–4,250 supply zone. Repeated Break of Structure (BOS) signals that bearish momentum remains dominant.
Institutional activity suggests that liquidity is being built above local highs, preparing for another downside leg. The current market sentiment stays bearish as long as price trades below the key premium area. A confirmed rejection from this zone could trigger a decline toward the 3,904 liquidity pool.
Only a breakout and hold above 4,250 would invalidate this scenario and shift bias back to bullish accumulation.

XAUUSDGold is almost at the Supply. There might be possibility of reversal from here. Buy side liquidity is done. Now it can start targeting sell side Liquidity.

Domestic Equity Market Trend1. Overview of the Domestic Equity Market
The domestic equity market refers to the marketplace within a country where shares of publicly listed companies are traded. In India, the two major stock exchanges are the National Stock Exchange (NSE) and the Bombay Stock Exchange (BSE). These exchanges provide the platform for investors to buy and sell equity shares, derivatives, and other securities.
The Indian stock market has seen remarkable growth, transitioning from a traditional broker-driven system to an advanced, technology-based environment. The benchmark indices—Nifty 50 and Sensex—serve as the barometers of the market’s overall performance, representing the health of leading sectors in the economy.
2. Recent Market Trends and Developments
In recent years, the domestic equity market has demonstrated resilience and expansion, driven by factors such as economic reforms, digitalization, and rising participation from retail investors.
a. Record Market Capitalization
India’s market capitalization crossed record highs, placing it among the top five global markets. The continuous inflow of foreign and domestic institutional funds, alongside Initial Public Offerings (IPOs) of emerging companies, has propelled the growth.
b. Retail Investor Dominance
Retail participation has surged significantly post-2020, aided by easy access to trading platforms, low brokerage costs, and increased financial literacy. Demat accounts have grown exponentially, indicating a structural shift where individuals are no longer mere spectators but active participants.
c. Sectoral Rotation
Different sectors have led the rally at different times—technology and pharmaceuticals during the pandemic, followed by banking, infrastructure, and capital goods in the recovery phase. This rotation indicates a healthy and balanced market evolution.
d. Growing SME and IPO Market
The SME (Small and Medium Enterprises) and mainboard IPO segments have gained strong traction. The appetite for new-age business models—such as fintech, renewable energy, and logistics—shows the market’s increasing acceptance of innovation-driven enterprises.
3. Key Drivers Influencing Domestic Equity Trends
a. Economic Growth
Equity markets move in tandem with GDP growth. India’s consistent growth rate, backed by manufacturing revival, infrastructure push, and consumption strength, supports bullish trends in equities.
b. Monetary Policy and Interest Rates
The Reserve Bank of India’s (RBI) policies on liquidity and interest rates play a crucial role. Lower interest rates typically boost equity valuations, as investors prefer equities over fixed-income assets for better returns.
c. Global Influences
Despite being a domestic market, Indian equities are affected by global events such as the U.S. Federal Reserve’s policy stance, crude oil price movements, geopolitical tensions, and global capital flows.
d. Corporate Earnings
Sustained improvement in quarterly corporate earnings has kept investor sentiment positive. Companies with strong balance sheets, high return on equity, and efficient management continue to attract long-term investments.
e. Technological Transformation
The rise of digital trading platforms, AI-based analytics, and algorithmic trading has enhanced liquidity and efficiency. This modernization has encouraged both professional and retail investors to engage more actively.
4. Sector-Wise Trends
The performance of the domestic equity market can be better understood by examining sectoral movements:
a. Banking and Financial Services
The banking sector has regained leadership, supported by improved asset quality, higher credit growth, and profitability. PSU banks have shown a strong turnaround, while private banks maintain their growth momentum.
b. Information Technology
While the IT sector faced margin pressures due to global slowdown concerns, it remains a structural growth driver given India’s digital transformation and global outsourcing demand.
c. Infrastructure and Capital Goods
This sector is witnessing a revival, backed by government infrastructure spending and private capex cycles. Stocks in this space are favored for long-term growth potential.
d. Energy and Renewable Sector
The energy sector is transforming rapidly with the focus shifting to renewables. Companies involved in solar, wind, and green hydrogen are drawing strong investor interest.
e. FMCG and Consumer Discretionary
Consumer-driven sectors benefit from rising income levels and urbanization. Despite inflationary pressures, demand remains robust, making them stable defensive plays.
5. Foreign Institutional Investors (FIIs) vs. Domestic Institutional Investors (DIIs)
The balance between FIIs and DIIs has become a defining factor for market stability. While FIIs bring in large capital inflows that can drive momentum, DIIs—such as mutual funds and insurance companies—help stabilize the market during volatile phases. The growing strength of DIIs reflects increasing domestic confidence in the Indian growth story.
6. Valuation and Liquidity Outlook
India’s equity valuations are relatively higher compared to peers, reflecting strong growth expectations. However, this also implies that any earnings slowdown could trigger short-term corrections. Liquidity remains ample, with consistent inflows from mutual funds and systematic investment plans (SIPs), which have become a cornerstone of long-term investing culture.
7. Policy and Regulatory Support
Reforms such as GST, Insolvency and Bankruptcy Code (IBC), Production-Linked Incentive (PLI) schemes, and Make in India have improved the investment climate. The Securities and Exchange Board of India (SEBI) continues to enhance transparency, corporate governance, and investor protection, strengthening market integrity.
8. Emerging Themes and Opportunities
a. Digital Economy and Fintech
India’s digital economy is expanding rapidly, creating investment opportunities in payment systems, e-commerce, and tech-driven services.
b. Manufacturing and “China+1” Strategy
Global supply chain diversification has made India a preferred destination for manufacturing investments, benefiting auto, electronics, and industrial sectors.
c. Green and Sustainable Investments
ESG (Environmental, Social, and Governance) investing is gaining momentum, with investors focusing on companies with sustainable practices and ethical governance.
d. Small-Cap and Mid-Cap Momentum
Smaller companies have outperformed large caps in recent times, driven by innovation, agility, and niche market leadership. However, this segment also comes with higher risk and volatility.
9. Risks and Challenges
No market is without risks. Key challenges for the domestic equity market include:
Global slowdown impacting exports and IT revenues.
Inflationary pressures leading to tighter monetary policies.
Political and regulatory uncertainties, especially around election periods.
Valuation concerns in overbought segments.
Liquidity shocks if foreign investors withdraw funds suddenly.
Long-term investors must stay alert to these risks while maintaining a diversified portfolio.
10. Long-Term Outlook
The long-term outlook for India’s domestic equity market remains optimistic and growth-oriented. Structural reforms, digital infrastructure, demographic advantage, and a strong entrepreneurial ecosystem make India a compelling investment destination. The combination of policy stability, rising domestic consumption, and innovation ensures that Indian equities remain a central focus for global investors.
Conclusion
The domestic equity market trend reflects a story of transformation, resilience, and opportunity. From being an emerging market to becoming one of the world’s fastest-growing equity destinations, India’s market evolution is driven by strong fundamentals, policy reforms, and investor participation. While short-term corrections are inevitable, the long-term trajectory remains bullish. For investors, staying informed, disciplined, and diversified is the key to navigating this ever-evolving landscape.

Part 1 Intraday Master ClassWhat Are Options?
An option is a financial contract that gives the holder the right, but not the obligation, to buy or sell an underlying asset (such as stocks, indices, or commodities) at a predetermined price (called the strike price) before or on a specific expiry date.
Options are classified into two types:
Call Option: Gives the right to buy an asset at a specific price.
Put Option: Gives the right to sell an asset at a specific price.
For this right, the buyer of an option pays a premium to the seller (writer) of the option.

Gold Analysis and Trading Strategies | Monday✅ Technical Outlook (4-Hour Structure)
● After reaching the historical high of 4381, gold entered a corrective phase, forming a segmented structure of “decline → bottoming → rebound.”
Each segment has lasted for roughly one week.
Currently, after touching 4245, gold has entered the second corrective wave, and from a cycle perspective, this adjustment is not fully completed yet.
● Over the past two days, gold has repeatedly found support around the 4000 psychological level, showing signs of rebound. This indicates that buyers are actively defending this area and that short-term bullish interest remains.
● Short-term moving averages (MA5, MA10, MA20) are currently clustered around the 4080–4100 region, forming strong pressure and signaling that the short-term trend remains bearish.
However, the long-term moving averages are slowly turning upward, suggesting that downside support remains valid and that deeper declines may be limited.
● The Bollinger Bands continue to narrow, indicating a range-bound and repetitive price structure.
The lower band is gradually aligning with previous lows, which together limit the downside space for further price declines.
✅ Daily Chart Structure
● Gold remains in a consolidation phase, with the overall Bollinger Bands displaying a gradual narrowing pattern, suggesting that a one-directional move is unlikely in the near term.
● The lower band is steadily rising and aligning with prior lows → limiting further downside risk.
● The upper band remains near 4100–4130, serving as the main short-term resistance zone for rebounds.
🔴 Resistance Levels: 4100–4130
🟢 Support Levels: 4005–4000
🎯 Trading Strategy Reference
🔰 Strategy 1 (Sell on Rebound)
● Short around 4100–4105 in batches
Targets: 4050–4020
Breakdown target: 4000
🔰 Strategy 2 (Buy on Pullback)
● Buy around 4000–4005 in batches
Targets: 4020–4030
Breakout target: 4050
📌 Outlook for Next Week
Overall, gold remains in a structure of weak consolidation — supported but with limited rebound strength.
The price is expected to continue oscillating within the 4000–4100 USD range next week.
● If Federal Reserve officials sound more “hawkish”:
Rate-cut expectations decline → USD strengthens → Gold may retest the 4000 support.
● If Fed officials turn more “dovish”:
Rate-cut expectations rise → Gold may retest the 4100 resistance zone.
● If geopolitical tensions escalate:
Safe-haven demand may push gold to break above the upper boundary of the range.
Next Monday’s short-term focus remains the 4000–4100 range.
Wait for a breakout, then follow the direction accordingly.
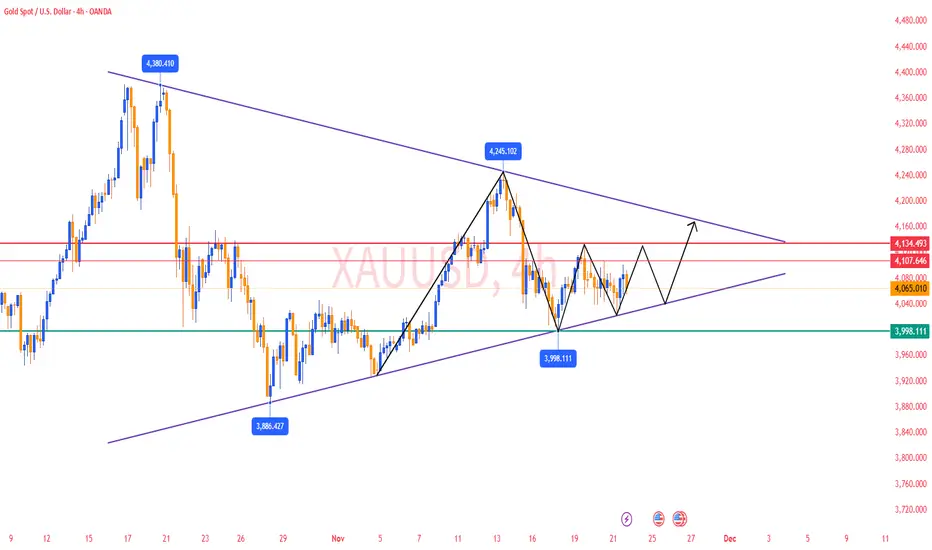
XAUUSD/GOLD WEEKLY BUY PROECTION 23.11.25XAUUSD / GOLD – 4H BUY PROJECTION (23.11.25)
Professional Description (Premium Format)
1️⃣ Market Structure
Price is trading inside a symmetrical triangle with clear 4H uptrend support.
Current candles show bullish rejection from Support S1, indicating buyers are active.
2️⃣ Entry Zone
Ideal buy area is near 4H uptrend line + Support S1 confluence.
Buy confirmation expected after bullish engulfing / strong wick rejection.
3️⃣ Risk Management
Setup follows Risk–Reward Ratio 1:2.
Stop-loss placed below Support S2 to protect against false breakouts.
4️⃣ Upside Targets
TP1 – Resistance R1: First reaction zone.
TP2 – Resistance R2: Final breakout target if momentum continues.
5️⃣ Technical Confluence
Triangle squeeze indicates possible volatile breakout toward upper structure.
Higher-timeframe trend bias supports bullish continuation.
🔥 Hashtags (TradingView Ready)
#gold #xauusd #goldanalysis #goldtrading #xauusdanalysis #forextrading #priceaction #4hchart #tradingplan #technicals #supplyanddemand #trianglepattern #riskmanagement #bullishsetup #premiumanalysis
If you want, I can also create:
✅ Short caption version
✅ TradingView long description
✅ Instagram caption style
Just tell me!

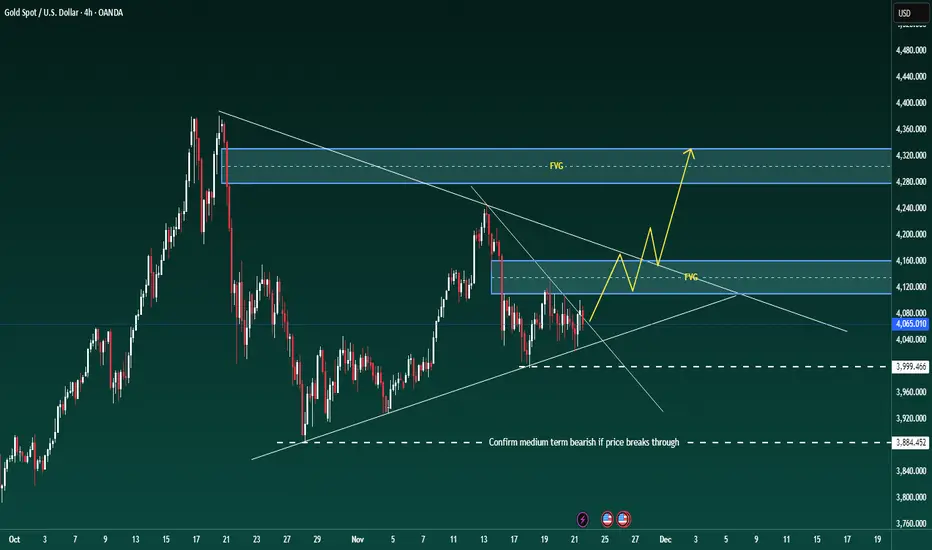
Strong news chain could push gold to retest 4300🟡 XAU/USD – Weekly Trading Plan (Nov 23–29)
SMC – FVG – Supply/Demand – High-Impact News Week
1. Market Context
Gold is sideways in the H4 accumulation structure, forming higher lows along the trendline.
Above are 3 important supply layers:
OLD FVG 1
OLD FVG 2
Large FVG 4220–4300
the price needs to sweep liquidity & hit the supply zone before creating a new direction.
2. Strong News Schedule for the Week
This week has a lot of USD news directly affecting gold:
Tuesday (Nov 25)
Core PPI – Retail Sales – PPI (4 consecutive red news) → strong volatility.
Wednesday (Nov 26)
Unemployment Claims
Durable Goods → Core Durable Goods
GDP q/q – GDP Price Index
Core PCE (most important inflation news of the week)
➡️ This is the decisive day for the trend for the rest of the week.
Friday (Nov 28)
German CPI (affects EUR → USD indirectly)
🎯 News Conclusion:
→ Gold likely to fake move – sweep liquidity before running correctly.
→ Thin SL zones will be continuously hunted.
3. Key Levels (from the chart you sent)
🔻 SELL Zone (Supply – FVG)
4189 – 4191 (Main Sell)
SL: 4195
This is a strong reaction zone for the week.
4132 – 4134 (Sell scalp)
SL: 4138
🔵 BUY Zone (Demand – Trendline – SMC)
4906 – 4904 (main BUY scalp zone in the chart)
SL: 3999
→ This is the only zone clearly marked as BUY in the chart.
Psychological level: 4000 – 3985
If the price falls → strong reaction to form the weekly low.
4. Weekly Trading Scenarios
🅰️ Scenario 1 – Price retraces to supply zone before dropping (most likely)
Price is forecasted to retest 4132–4134 → 4189–4191
After hitting 4190 ± → potential appearance of:
Bearish BOS H1/H4
Strong reversal to 4050 – 4000
🔻 SELL Plan
Sell 4132–4134 (scalp) SL 4138
Main Sell 4189–4191 SL 4195
TP targets:
TP1: 4090
TP2: 4050
TP3: 4000
🅱️ Scenario 2 – Price dips before news then surges (kill liquidity)
If gold is pushed down before PPI/GDP news:
Best BUY zone: 4000 – 3985
Form a low → surge back up to test supply.
🔵 BUY Plan
BUY 4000–3985
SL: 3975
TP:
4050
4100
4130
🅾️ Scenario 3 – If 4200 breaks
If 4200 is broken by a large-bodied H4 candle:
➡️ High probability gold will move up to test large FVG 4250–4300
→ At that point, only look for BUY pullbacks, no more SELL.

Gold Nonfarm: Buy OB 4030, Target Break 4111🔍 Market Context – November 20, 2025
Gold initially dropped nearly 70 pips at the start of the day but quickly rebounded sharply from the 4030–4032 zone, demonstrating strong buying pressure and a refusal to decline further.
The market structure on the H1–H2 timeframe is forming a classic, well-defined Inverse Head & Shoulders pattern—a quintessential bullish reversal pattern—signaling a potential upward expansion if the neckline is successfully broken.
📅 Key News Events Today:
🇺🇸 Non-Farm Payrolls (NFP)
📉 US Unemployment Rate
🏛 FOMC Meeting Minutes
🗣 Speeches by Trump, Barkin, Williams
🧾 Initial Jobless Claims
⚠️ These events could trigger sharp volatility and will determine the confirmation or rejection of the reversal pattern.
📊 Technical Analysis
🛒 BUY SETUP – Primary Priority
✅ Entry: 4030 – 4032
🛡 Stop Loss (SL): 4027
🎯 Take Profit (TP):
TP1: 4039
TP2: 4047
TP3: 4059
💡 Rationale: Price bounced strongly at the OB + SSS zone. This is a crucial technical support area and the base of the Inverse H&S pattern. The objective is to break the neckline to trigger the uptrend.
🔻 SELL SETUP – Short-Term Strategy
📍 Entry: 4093 – 4095
🛡 SL: 4098
🎯 TP:
TP1: 4088
TP2: 4077
TP3: 4060
TP4: 4033
💡 Rationale: This strategy is only applicable if the price forms a false breakout of the BSL zone and reverses. This is an ideal entry point for quick scalping if the market reacts negatively to the news.
🔑 Key Price Zones
Buy Zone (OB + SSS): 4030 – 4032
→ Strong demand zone, the base of the Inverse Head & Shoulders pattern, confirming the reversal signal if held.
Breakout Neckline Zone: 4101 – 4111
→ The neckline of the Inverse H&S pattern. Breaking this zone will open up opportunities for a sharp rise.
Final Resistance Zone: 4133 – 4140
→ The final target if the breakout is successful and the bullish pattern is confirmed.
✅ Strategy Conclusion
🎯 Main Strategy: Priority is to BUY in the OB zone 4030–4032.
🩸 SELL is only for short-term scalping if there is a signal of rejection at the BSL zone.
🕓 Caution: Be careful entering trades near the Nonfarm news release time—wait for price action to confirm the direction.

Elliott Wave Analysis XAUUSD – November W4, 2025
1. Momentum
W1 – Weekly timeframe
Weekly momentum is showing early signs of a reversal. If next week forms a confirmed bullish weekly candle, the market may enter 4–5 consecutive bullish weeks, pushing weekly momentum into the overbought zone.
D1 – Daily timeframe
Daily momentum continues to rise, suggesting the market may experience 1–2 more days of upward movement before reaching the overbought region.
H4 – 4-hour timeframe
H4 momentum remains bullish, indicating that Monday is likely to show a continuation of upward movement or sideways consolidation.
________________________________________
2. Elliott Wave Structure
Weekly Structure (W1)
The last three weekly candles are bullish, but not strongly decisive:
• Two candles have short bodies
• One is a bullish candle with an upper wick
This behavior suggests the market is completing wave X (purple). Therefore, the main expectation is a continued decline to complete wave Y (purple) toward the lower target zones. Once wave Y finishes and weekly momentum confirms reversal, a new major bullish trend is likely to begin.
________________________________________
Daily Structure (D1)
• Wave X (purple) is likely complete.
• Price is now progressing within wave Y (purple).
Inside wave Y:
• Wave 1 (red) appears to have finished.
• Price is currently in wave 2 (red) or has already started the early phase of wave 3 (red).
🔸 Key confirmation level:
A break below 4001 would confirm that the market has entered wave 3 (red), leading to a sharp and decisive decline.
🔸 Alternative scenario:
Because D1 momentum is still rising, wave 2 (red) may be forming a WXY corrective pattern (green zigzag), meaning the market may still produce a final upward swing before the next strong decline.
________________________________________
3. H4 Wave Structure
At the moment, there are two scenarios in line with the D1 structure:
• The market may already be in the early phase of wave 3 (red).
• Or price is completing the final leg of the WXY correction of wave 2 (red) (indicated by the green zigzag).
The zone around 4081 currently acts as the balance area, also the region with the highest traded volume (green POC line).
• If price stays below 4081 during Monday, the probability favors wave 3 (red), meaning strong support zones 4020 and 3958 are likely to break.
• If price stays above 4081, upside targets at 4145 and 4184 become ideal levels for completing wave 2 (red).
________________________________________
4. Trading Plan
📌 Preferred Limit Sell Zones:
• 4145
• 4184
📌 Direct Sell Zone:
• 4020 → only valid if a strong H4 candle closes below 4020, followed by a retest.
A more detailed trading plan will be updated on Monday, once fresh market data becomes available.

BULLISH MOVE on gold for the next trading season. who's ready ?BULLISH MOVE on gold for the next trading season. who's ready ? I'M TRYING TO CAPTURE 1:6 risk to reward. Let's see what's gonna happen./
GIVE ME YOUR IDEA AS WELL.

XAUUSD – ACCUMULATION TRIANGLE ON D1💛 XAUUSD – ACCUMULATION TRIANGLE ON D1, AWAITING A NEW BREAKOUT THIS WEEK 🎯
🌤 Overview of the New Week
Hello everyone, Lana here 💬
Gold, after a very strong rise from the 3,500 region to above 4,400, is entering a "resting" phase on the D1 frame: the price continuously tests the upward trendline but has not yet broken it to confirm a downtrend.
The market is clearly waiting for a real breakout before forming a new medium-term wave.
Next week, we have CPI and PPI – important inflation data that could act as a catalyst to push gold out of the current accumulation zone.
💹 Technical Analysis (Daily Triangle)
On the D1 frame, when connecting the descending peaks and ascending bottoms, gold is in a narrowing triangle pattern.
The upward trendline below is still maintained, indicating that the medium-term trend has not reversed.
Below are important zones:
≈ 3,890: if the price closes below this area, it could confirm medium-term weakening.
Fibonacci & psychological resistance zone 3,800–3,900: strong support, confluence with old price structure.
POC Volume Profile around 3,650: if a deep decline scenario occurs, this will be the next price attraction zone.
Above, the old peak zone around 4,300–4,400 remains a large liquidity zone, a natural target if gold breaks the upper edge of the triangle.
In summary: the more compressed the triangle, the stronger the breakout – the direction will depend heavily on CPI/PPI data & Fed expectations.
🎯 Reference Trading Plan (Medium-Term)
💖 Scenario 1 – Maintain Uptrend (priority when the trendline is not broken)
Observe the reaction at the D1 upward trendline (area around 4,000).
If the price continuously bounces from the trendline and stays above the 3,890 area, you can:
Prioritize buying according to the trend at support retests on H4–H1.
Medium-term targets: 4,150 → 4,250 → 4,300–4,400 if the triangle breaks upwards.
💢 Scenario 2 – Triangle Breaks, Shifts to Medium-Term Decline
If D1 closes below 3,890:
Consider this a signal confirming medium-term weakening.
Prioritize selling at newly formed resistance zones.
Step-by-step targets: 3,800 → 3,700 (POC) → 3,500 (strong previous support).
In both scenarios, specific entry points should be refined on smaller frames (H4, H1) based on price action/OB/FVG.
⚠️ Note News & Risk Management
Next week's CPI & PPI could be the "final blow," pushing gold out of the triangle – volatility can be wide and fast, spreads may widen.
Last week's NFP news hardly created big waves for gold after the US government shutdown, indicating the market is holding strength waiting for more important data.
🌷 Conclusion & Interaction with LanaM2
Gold on D1 is in the final stage of the accumulation triangle – this is a time where patient observation is as important as a beautiful entry point 💛
Next week, I will continue to update daily details on smaller frames so everyone can have more specific entry points.

Public Sector Banks in the Trading Market1. What Are Public Sector Banks?
Public Sector Banks are commercial banks where the Government of India holds majority ownership, usually above 51%. These banks operate under government oversight and play a vital role in:
Mobilizing public savings
Lending to priority sectors
Executing government welfare schemes
Providing financial inclusion
Supporting economic stability
Some major PSBs include:
State Bank of India (SBI) – India’s largest bank
Bank of Baroda (BoB)
Punjab National Bank (PNB)
Canara Bank
Union Bank of India
Indian Bank
Bank of India (BoI)
UCO Bank, Bank of Maharashtra, Central Bank of India, etc.
These banks collectively hold nearly two-thirds of India’s banking assets, giving them huge influence in stock market behaviour.
2. Importance of PSBs in the Trading Market
a) High Liquidity and Trading Volumes
PSB stocks like SBI, BoB, and PNB consistently appear in the NSE’s most-traded list, making them attractive for:
Intraday traders
Swing traders
Options traders
Institutional investors
Liquidity ensures narrower spreads, faster order execution, and stable price discovery.
b) Macro Indicators
PSBs reflect the health of:
Credit growth in the economy
Corporate borrowing trends
Housing and retail loan demand
Government capital expenditure
Stress in sectors like MSME or agriculture
Thus, traders use PSB performance to gauge broader market trends.
c) Interest Rate Impact
Bank profitability is heavily dependent on the interest rate cycle.
Rising rates → higher net interest margin (NIM) → PSBs rally
Falling rates → lower margins → PSBs correct
Therefore, PSB stocks move quickly after:
RBI monetary policy
Inflation data
Government bond yield changes
This makes them ideal for event-based trading.
3. How Public Sector Bank Stocks Behave
PSB stocks often show cyclical behaviour related to the broader economy.
a) Credit Demand Cycle
When corporate and retail loan demand is strong:
Bank lending grows
NIMs improve
Profitability increases
Stocks rally
During slowdowns, lending slows and PSBs weaken.
b) NPA (Non-Performing Assets) Influence
A major factor that affects PSB valuations is bad loans.
High NPAs = weak valuations
Lower NPAs = strong re-rating and investor confidence
Whenever PSBs report declining NPAs, stocks usually see multi-month rallies.
c) Government Recapitalization
PSBs sometimes require government capital infusion to strengthen balance sheets.
Announcements of recapitalization often cause:
Short-term volatility
Long-term stability
Such events attract traders seeking momentum.
4. Key Factors Traders Track in PSBs
1. RBI Monetary Policy
Interest rate hikes usually have a positive impact on PSBs initially but may impact loan growth later. The reverse is true for rate cuts.
2. Credit Growth Data
Higher loan growth = bullish sentiment.
3. NPA Trends
Quarterly results showing reduced NPAs cause strong buying.
4. Provisioning Coverage Ratio
Higher provisioning means lower future risk.
5. Government Policies
Schemes like:
Jan Dhan Yojana
Mudra loans
PM Kisan
Affordable housing subsidies
impact PSB balance sheets as these banks execute most government programs.
6. Bond Yield Movements
Bond yields impact treasury income. PSBs hold large government bond portfolios, so:
Falling yields → appreciate bond prices → higher profits
Rising yields → mark-to-market losses
This directly affects stock movements.
7. Global Market Sentiment
PSBs often move in line with:
US interest rate trends
Crude oil prices
Global risk appetite
Because they reflect India’s financial stability.
5. Why Traders Prefer PSB Stocks
✔ Volatility and Momentum
PSBs offer clear trending phases and sharp breakouts during periods of:
Economic expansion
NPA reduction
Privatization rumours
Monetary policy shifts
Their volatility works well for both intraday and swing trading.
✔ High Options Activity
PSBs like SBI and PNB have:
Liquid options
Tight premiums
Wide strike selections
This helps option sellers and buyers trade with confidence.
✔ Low Valuation Base
PSBs often trade at low price-to-book (P/B) ratios compared to private banks. So when re-rating happens, rallies are stronger and sustained.
✔ Strong Institutional Participation
FIIs and DIIs frequently invest in PSBs during bullish economic cycles. Their buying creates long uptrends.
6. Risks in Trading Public Sector Banks
PSBs carry unique risks that traders must consider.
1. High Exposure to Government Schemes
While beneficial for society, these schemes sometimes:
Reduce profitability
Increase operational costs
Lead to higher NPAs in certain sectors
2. Slow Decision-Making
Compared to private banks, PSBs may be slower to adapt to:
Digital banking
Fintech competition
Modern risk assessment systems
This can limit valuation expansion.
3. Vulnerability to Economic Stress
PSBs are more exposed to:
MSME distress
Agriculture stress
Infrastructure lending defaults
These risks cause periodic corrections.
7. Trading Strategies for Public Sector Banks
1. Event-Based Trading
Best events for trading PSBs:
RBI monetary policy
Union Budget
Quarterly results
NPA announcements
Government recapitalization news
Privatization rumours
Traders often take positions before or after these events.
2. Trend Following Strategies
PSBs tend to show long, clean trends. Traders use:
20/50/200 EMA crossovers
RSI breakout levels
Price-volume surge patterns
Trendline breakouts
Trending phases provide multi-week or multi-month opportunities.
3. Options Strategies
Popular strategies:
Bull call spread (during NPA improvement cycles)
Short straddle/strangle (during consolidation phases)
Protective put (around volatile policy announcements)
4. Pair Trading
Traders sometimes pair:
SBI vs Bank of Baroda
PNB vs Union Bank
Canara Bank vs Indian Bank
Based on relative strength comparisons.
8. Long-Term View of PSB Stocks
Historically, PSBs have delivered inconsistent long-term returns, but cycles of reform — such as:
Bank mergers
Digital transformation
NPA resolution
Government capital infusion
Interest rate cycles
have created powerful rally phases.
Investors who entered during undervalued periods often gained significantly over the long term.
Conclusion
Public Sector Banks are foundational pillars of India’s financial ecosystem. For traders, they offer a rare combination of:
High liquidity
Strong correlation with macroeconomic trends
Event-driven volatility
Clear trend opportunities
Attractive options trading potential
However, trading PSBs also requires careful monitoring of:
NPAs
RBI policies
Government decisions
Bond yields
Sector-wise economic health
Understanding these factors helps traders navigate PSB stocks effectively in both short-term and long-term market environments.

Gold is compressed; next week’s US data will pick a side.Gold is being compressed, the upcoming US data week will determine which side is squeezed.
Good evening everyone, Brian here with a view on XAUUSD on the H2 and H4 frames for the upcoming week.
Fundamental Analysis – a "tailor-made" week for the USD
Next week is packed with US data, meaning gold will react more to numbers than narratives:
Core PPI, PPI, and Retail Sales
Initial Unemployment Claims
Prelim GDP q/q
Core PCE Price Index m/m – the Fed's preferred inflation measure
If inflation and growth come out weak, the market will lean more towards the slow growth / easing policy narrative. This usually puts pressure on the USD and supports gold, especially when real yields gradually decrease.
Conversely, stronger-than-expected data will strengthen the USD, increase yields, and create short-term downward pressure on gold. In such a context, price and liquidity areas around news release times will be more important than usual – typically, fading emotional spikes back to structural areas is safer than chasing the initial move.
Technical Analysis – triangle, FVG, and key support areas
On the H4 frame, gold is still trading within a broad triangle structure. The previous decline has stalled, with prices continuously reacting at the upward support line and around 4,000, but there has yet to be a clear breakout from the pattern.
When zooming into H1–H2:
The price has broken a short-term downtrend line and closed strongly above – this is an early signal that selling pressure in this move is weakening.
The nearest support is around 4050–4040, deeper is the 4000–3998 support band (marked on the chart as important support). As long as it holds above 4,000, the structure remains positive.
Above, we have a very important confluence area around 4135–4160 including:
Fibo 0.382 of the most recent main decline
An old fair value gap (FVG) and resistance block
Chart note: "Gold will go strong if it passes this price range" – aligns with my view: if the price accepts above this area, the potential for a stronger upward move will open up.
Around 4100 is an area prone to "large liquidity response" – expect strong profit-taking and position restructuring if the price returns to this area.
Currently, I consider the market to be accumulating above 4,000 in a corrective pattern, with a slight upward bias as long as 4,000 is maintained.
Key Price Areas
Resistance:
4100 – first liquidity area
4135–4160 – Fibo 0.382 + FVG + strong resistance
Support:
4050–4040 – nearest intraday support
4000–3998 – large frame support; if broken, the picture changes
3940 area – stronger support if 4k is breached
Trading Scenarios for Next Week
(All are for reference only, not investment advice.)
Scenario 1 – Buy when price corrects above 4,000 (foundation for the next upward wave)
Idea: follow the forming upward bias as the price respects the triangle support and the 4,000 mark.
Entry area: 4050–4040 or any clean retest of the broken downtrend line on smaller frames
Cautious position addition area: 4025–4005 if there is a deep sweep to 4,000 with a strong bounce reaction
Stop loss: below 3990–3988 depending on risk appetite
Targets:
First: 4100 (liquidity area)
Second: 4135–4140 (lower edge of FVG/resistance)
Extended: 4155–4160 if a strong continuation move appears
Signals to wait for: wick rejections from support, bullish engulfing candles, or clear intraday structural phase shifts to higher highs and lows.
Scenario 2 – Break & Retest Long above 4135–4140
If the price doesn't give a deep correction and runs straight up:
Condition: H2/H4 candle closes clearly above 4135–4140 and holds on retest
Entry: when price pulls back in a controlled manner to the 4135–4140 area, turning this area from resistance to support
SL: below 4120
TP: 4180 → 4200+ depending on momentum strength
This is the "gold goes strong" scenario as noted on the chart – viewing the FVG/0.382 area as a launchpad for a larger impulsive upward wave.
Scenario 3 – Bearish scenario if 4,000 is broken
If fundamentals and flows turn against gold, decisively pushing the price below 4,000, the bullish view needs to be set aside.
Condition: daily candle closes clearly below 4000–3998
Plan: wait for the price to retrace up to retest 4000–4020 from below
Entry: short when rejection signals appear at that retest area
TP: 3960 → 3940, then reassess the structure
When below 4,000, the triangle will break down, and the market is likely to hunt deeper liquidity areas before potentially forming a new medium-term upward wave.
In summary: as long as 4,000 holds, I prioritize the buy scenario on corrections, respecting the upward potential to 4135–4160 and beyond. If there is a decisive break below 4,000, the picture will reverse – then retracements up will be opportunities to look for shorts.
Trade according to what the structure shows, not what I hope for. Manage risk tightly around next week's data points and let the major price areas "do the heavy lifting."
If this perspective helps you plan better, don't forget to follow Brian for weekly gold analysis and share your scenarios in the comments to compare.
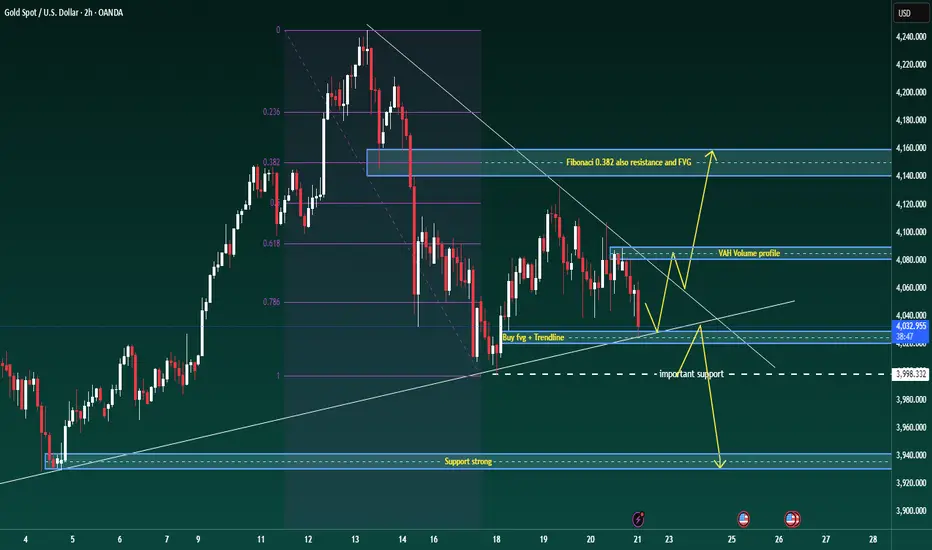
Gold is stuck in a wide range, ready for a decisive break.Good evening traders, Brian here with a fresh look at gold on the 2-hour chart.
Price is compressing in a broad sideways range, building energy for the next leg – the break from this structure will set the tone for the coming sessions.
Fundamental analysis
The core driver remains the Fed’s December decision. The market is effectively split on whether we see a cut or a delay:
A camp of institutions argues that rising unemployment and softer data could still justify a 25-basis-point cut in December, keeping pressure on the dollar and supporting gold on dips.
Others point out that the Fed is short of clean, up-to-date data and may prefer to wait until next year before committing to an easing cycle.
As a result, pricing for a December cut is roughly “fifty–fifty” and highly sensitive to the next run of labour-market and activity data.
In short: the macro backdrop is undecided, so intraday direction will be driven mainly by levels and liquidity until the next data catalyst hits.
Technical analysis
On the H2 chart, gold is in a broad consolidation after the recent sell-off:
Price is trading inside a descending structure, repeatedly respecting the short-term trendline from the recent high.
The Fibonacci retracement of the latest impulse shows the 0.382 level lining up with a prior fair-value gap and horizontal resistance – this forms a key rejection zone overhead.
Below price, there is a confluence of support where the rising trendline meets a small bullish FVG around 4027–4029, followed by a more important horizontal support band near 3998.
The volume profile highlights a Value Area High (VAH) around 4075–4080, which is likely to act as a reaction zone if price rotates back into it.
Until we break convincingly out of this structure, I treat it as a large accumulation range with a slight downside bias: sellers are still defending lower highs, but buyers are stepping in aggressively at trendline support.
Key levels
Resistance zones:
4080–4085 (VAH / short-term supply)
4135–4145 (Fibonacci 0.382 + FVG + structural resistance)
Support zones:
4027–4029 (trendline + FVG confluence buy area)
3995–4000 (important horizontal support)
3940 region (deeper support if the range finally breaks down)
Trade scenarios
1. Primary long – buy the trendline/FVG confluence
Entry: 4027–4029
Stop: 4023
Targets: 4035 – 4050 – 4068 – 4080
Idea: look for price to react at the rising trendline where it overlaps with the small FVG. A clean rejection candle or shift in intraday order flow from that zone sets up a rotation back towards the VAH and potentially the upper boundary of the range.
2. Break-and-retest short – if the trendline fails
Trigger: clear H1/H2 close below the rising trendline and the 4027 area
Plan: wait for price to retest the underside of the broken trendline / prior support
Entry: on rejection of that retest
Initial targets: 4000, then 3940 if momentum accelerates
This scenario treats any breakdown as a structural shift, using the retest as a lower-risk point to join the move rather than chasing the first leg.
3. Intraday scalp zones
These are discretionary, short-term opportunities for active traders:
Reaction sells: around 4085, and higher up if we spike into the 4135–4145 resistance band. Look for exhaustion or rejection patterns back into the range (potential targets 4060 then 4033).
Reaction buys: into 3998–4000 if we see a liquidity sweep below the current range, with tight stops and quick profit-taking back towards the mid-range.
Part 4 Learn Institutional Trading Option Pricing Concepts (Greeks)
Option pricing models use various mathematical tools called Greeks:
1. Delta
Measures how much an option's price moves with the underlying asset.
Call delta: 0 to 1
Put delta: 0 to –1
2. Theta
Measures time decay—how much premium decreases daily.
3. Vega
Measures sensitivity to volatility.
4. Gamma
Indicates how delta changes as the underlying moves.
These Greeks help traders understand risk and adjust their strategies.

Gold 4H – Liquidity Plays Ahead of Fed Minutes & PMI Data🥇 XAUUSD – Weekly Smart Money Outlook | by Ryan_TitanTrader
📈 Market Context
Gold continues to trade inside a controlled 4H consolidation as markets brace for a highly event-driven week: U.S. PMI releases, updated Fed guidance, and renewed debates over the timing of future rate cuts.
Recent data has shown mixed momentum — softer employment trends but steady business activity — keeping the dollar volatile and gold reactive near mid-range liquidity.
Institutional flows remain cautious, reducing aggressive positioning ahead of major macro catalysts. This environment typically leads to engineered sweeps on both sides of the range as Smart Money hunts liquidity before revealing direction.
Expect short-term volatility spikes, especially around U.S. session opens and PMI releases.
🔎 Technical Analysis (4H / SMC View)
• Price is navigating a minor bearish structure, forming lower highs while protecting deeper liquidity beneath 4020.
• The recent 4H BOS + corrective pullback suggests the market may generate a liquidity grab toward the discount zone before any strong bullish leg develops.
• A Premium Sell Zone at 4225–4227 sits above resting liquidity, making it an ideal region for stop hunts and short-term distribution.
• The Discount Buy Zone at 4010–4008 aligns with structural reaction points, unmitigated demand, and a liquidity shelf — ideal for accumulation.
• Mid-range liquidity around 4060–4080 may be swept before the market chooses a larger weekly direction.
🟢 Buy Zone: 4010–4008
SL: 4000
TP targets: 4085 → 4120 → 4175 → 4220
Rationale:
• Deep discount zone beneath 4H liquidity
• Confluence of demand + structural mitigation
• High probability of engineered sweep before bullish expansion
🔴 Sell Zone: 4225–4227
SL: 4235
TP targets: 4175 → 4120 → 4060 → 4015
Rationale:
• Premium supply above equal-high liquidity
• Favors stop hunt + distribution before correction
• Aligns with previous 4H rejection and imbalance fill
⚠️ Risk Management Notes
• Wait for M15 ChoCH / BOS inside each zone before entering — avoid blind entries.
• Expect spreads and liquidity manipulation around news: US PMI, Fed speeches, and data surprises.
• Avoid trading 10–20 minutes before high-impact events.
• Scale partial profits at each structural target to secure gains and let runners develop.
✅ Summary
Gold remains trapped in a structured 4H range where Smart Money is likely to sweep one side before delivering a decisive expansion.
Discounted buys at 4010–4008 and premium sells at 4225–4227 remain the highest-probability weekly setups.
Stay patient, respect liquidity, and follow confirmation.
🔔 FOLLOW @Ryan_TitanTrader for more weekly SMC setups 🚀

Gold at a Crossroads: Up or Down?If we zoom in and carefully observe how the GOLD price is moving, it becomes immediately clear:
The market has just shown a very strong upward impulse, but now something interesting is happening. The price is tightening and forming a small, narrow triangle, which indicates that the market is accumulating energy. In these situations, there are usually two possible directions, but given the clearly bullish context, I feel that a breakout to the upside is much more likely.
What do you think? Do you agree with me?
Leave your thoughts in the comments. And trust me, being part of the TradingView community will help you improve every day as a trader.
Of course, this is not financial advice, just my personal view on the chart.

Gold Comex XAUUSD holding buy @4035 , target 4110, 4150, 4185Parameters Data
Asset Name : Price 🟩 Gold Comex : 4080.50
Price Movement 🟩 Upmove will continue to 4095, 4110 if break 4110 then breakout Until 4050 not break if break then 4025, 4000 possible.
Reason 🟩 Geopolitical Risk & US Dollar Weakness: Middle East tension aur Dollar Index mein kami se safe-haven demand badhi. 🟥 RSI Overbought: Short-term correction ki possibility.
Confidence 🟩 Bullish 22/30 Bullish , Avoid , Bearish (73.33% score Above 60% hai, isliye Green.)
Probability 🟩 80% Upside: Price all-time high zone mein hai, jahan momentum aur risk appetite strong hai.
R:R 🟨 Neutral: Current level par R:R 1:1 hai. Pullback par entry favorable (1:2) ho sakti hai.
FNO Data 🟩 Strong Long Build-up: Price up aur OI up expected hai. Fresh buying ka sanket.
Liquidity Zones 🟩 Support Zone: $4050 - $4065 (Previous Resistance turned Support) 🟥 Resistance Zone: $4095 - $4110 (Next Technical Target)
Max Pain 🟨 N/A (No specific Max Pain data found for this contract)
DEMA Levels 🟩 20 DEMA: $4045.00 50 DEMA: $3995.00 100 DEMA: N/A 200 DEMA: N/A 250 DEMA: N/A (All key averages ke upar trade, extremely bullish signal)
Supports 🟩 S1: $4065.00 S2: $4050.00 S3: $4025.00
Resistances 🟩 R1: $4095.00 R2: $4110.00 R3: N/A
ADX/RSI/DMI 🟥 RSI(14): 75.10 (Overbought) ADX: 45.00 (Very Strong Trend)
Market Depth 🟩 Buy-biased (High demand at $4075 levels)
Volatility
